Summary
The virus comet assay is a cell-based virulence assay used to evaluate an antiviral drug or antibody against a target virus. The comet assay differs from the plaque assay in allowing spontaneous flows in 6-well plates to spread virus. When implemented quantitatively the comet assay has been shown to have an order-of-magnitude greater sensitivity to antivirals than the plaque assay. In this study, a quantitative comet assay for influenza virus is demonstrated, and is shown to have a 13-fold increase in sensitivity to ribavirin. AX4 cells (MDCK cells with increased surface concentration of α2–6 sialic acid, the influenza virus receptor) have reduced the comet size variability relative to MDCK cells, making them a better host cell for use in this assay. Because of enhanced antiviral sensitivity in flow-based assays, less drug is required, which could lead to lower reagent costs, reduced cytotoxicity, and fewer false-negative drug screen results. The comet assay also serves as a readout of flow conditions in the well. Observations from comets formed at varying humidity levels indicate a role for evaporation in the mechanism of spontaneous fluid flow in wells.
Keywords: comet, plaque, antiviral assay, influenza, image analysis, evaporation
1.Introduction
Cell-based virulence and drug-susceptibility assays are essential for clinical, pharmaceutical, public health and general laboratory studies of many different viruses. These assays are often conducted by infecting cell monolayers and incubating over more than one virus replication cycle under liquid media or semisolid gel. This type of assay conducted under a gel with a low multiplicity of infection (MOI) is referred to as a plaque assay, where the term “plaque” refers to the expanding circular regions of virus-infected cells beneath the agar (Dulbecco, 1952). If low MOI infections are incubated under liquid media instead of agar, convection within wells of a 6-well plate will often spread the virus into elongated “comet”-shaped plaques.
The mechanism driving flows in wells has not been determined conclusively, but temperature gradients and evaporation have been suggested (Law et al., 2002; Zhu and Yin, 2007). A computational model of virus spread under a constant flow has demonstrated an inverse relationship between the extent of spread and the Damköhler number, a dimensionless parameter representing the ratio between the rate of virus binding to cells and the rate of fluid transport. The observation that strong-binding influenza variants form plaques, while weak-binding influenza variants form elongated comets (Gambaryan et al., 1998) supports the connection to the kinetics of binding to cells.
Comet or plaque assays conducted with dilutions of drug or antibody are referred to as plaque or comet reduction assays, and are used to determine the effective concentration of an antiviral or antibody required to inhibit virus spread. The comet reduction assay has been used most frequently by pox virus researchers because the flow allows differentiation between spread via extracellular enveloped virions (EEV) which are released from the cell to form the comet tails, and spread via cell-associated enveloped virions (CEV) which spread only from a cell to neighboring cells and form the comet head (for example Smith et al., 2009; Barefoot et al., 2008; Olson, 2009). The comet reduction assay has also been used with influenza virus (Matrosovitch et al., 2003).
Until recently, comet and comet reduction assays had been used primarily as a qualitative measure, since comets are more difficult to count than are plaques. With an imaging-based quantification method, Zhu and Yin demonstrated that the quantitative comet assay for vesicular stomatitis virus (VSV) had 18-fold higher sensitivity to drug, in terms of the half-maximal inhibitory concentration (IC50), than the plaque assay (Zhu and Yin, 2007). An assay with greater sensitivity requires less drug or antibody per experiment, reducing costs and lowering cytotoxicity. Increased sensitivity in a drug screen could offer reduced false negative results. The quantitative comet method has since been used in a vaccinia virus vaccine study (Wilck et al., 2010).
The influenza A virus, family Orthomyxoviridae, is notable for its high mutation rate, which can result in drug-resistance and can create novel pandemic strains such as the swine-origin 2009 H1N1 virus. There are currently only two approved classes of antivirals in the United States for use against influenza, neuraminidase inhibitors and M2 ion channel inhibitors. Multiple seasonal strains have shown resistance to drugs from one class or another. An enhanced-sensitivity quantitative drug susceptibility assay could be of use for influenza virus surveillance and diagnosis, and could be adapted for drug discovery. In this work, a quantitative comet assay is demonstrated for influenza virus, and several observations concerning the effects of incubation conditions on comet spread are reported.
2. Materials and methods
2.1 Viruses and antiviral
Influenza A H1N1 (A/WSN/33) virus stocks were created by propagating virus on MDCK cells. Wild-type vesicular stomatitis virus (order Mononegavirales, family Rhabdoviridae, Indiana serotype) was propagated on BHK cells to create stocks. For both viruses, cell debris was removed by centrifugation followed by filtration of the supernatant through a 0.22micron filter. Stocks were stored at −80°C. Ribavirin (Research Products International, Mount Prospect, USA) (see Graci and Cameron, 2006) is used with influenza virus comet reduction and plaque reduction assays.
2.2 Cell lines and media
MDCK cells and ST6Gal I-expressing MDCK cells (Hatakeyama et al., 2005; Matrosovich et al., 2003) (referred to hereafter as “AX4 cells”) were provided by Yoshihiro Kawaoka. The ST6Gal I gene in the AX4 cell line results in over-expression of the α2–6 sialic acid virus receptor on the cell surface. Growth media for AX4 and MDCK cell lines consisted of 10x concentrated minimum essential medium (Sigma, St. Louis, USA.) diluted in autoclaved MilliQ-purified water and supplemented with sodium bicarbonate (Sigma), vitamins (Sigma), amino acids (Sigma), L-glutamine (Gibco, Grand Island, USA), and 5% newborn calf serum (Hyclone, Logan, USA). AX4 cells were cultured in 7.5mg/mL puromycin (Gibco) to maintain selection for the plasmid containing the ST6Gal I gene. Media used for influenza virus infection contained 3 mg/mL bovine serum albumin (Gibco) in place of serum. VSV infections were carried out on BHK cells. Growth media for BHK cells was composed of minimum essential medium (Cellgro, Manassas, USA) supplemented with 10% fetal bovine serum (Atlanta Biologicals, Lawrenceville, USA) and GlutaMAX (Gibco). For VSV infection, serum was reduced to 2%. Cells and infections were cultured at 37°C, 5% CO2, in a humidified incubator unless otherwise specified. Many strains of influenza require trypsin for efficient release from the cell surface, though it is not necessary for influenza A/WSN/33 (Li et al., 1993) and was not used in this work.
2.3 Comet assays
Cells (MDCK, AX4, or BHK) were seeded in 6-well plates and grown to confluence overnight in growth media. The next day, cell monolayers were rinsed with PBS or media, inoculated with approximately 70 plaque-forming units (PFU) of either VSV or influenza per well in 200 μL of infection media, and incubated for one hour at 37°C and 5% CO2. After one hour, monolayers were rinsed and overlaid with 2mL of infection media. If necessary, drug was added to the media at this time. Infections were incubated at 37°C and 5% CO2 for an additional 14 hours (VSV) or 40 hours (influenza). In some cases, the incubator humidity was recorded using a portable data logger (Omega, Stamford, USA), which is accurate to within 5%, according to reported specifications. After the appropriate incubation time, monolayers were fixed with 4% paraformaldehyde (MP Biomedicals, Solon, USA), stained with crystal violet (PML Microbiologicals, Wilsonville, USA) (stock solution diluted 1:40 in ethanol), and allowed time to dry in a fume hood. Because dead cells detach from the plate, crystal violet cell stain reveals the virus-infected regions as macroscopic unstained gaps in the purple-colored cell monolayer. Comet area was quantified by image analysis (see 2.5).
2.4 Plaque assay
Influenza virus plaque assays were carried out on AX4 cells. The protocol was identical to the comet assay technique (see Section 2.3) except that the plaque assay infections were incubated for 60 hours under infection media in a 1% (i.e. 1 g/100mL) SeaPlaque agarose (Lonza, Rockland, USA) semisolid gel to prevent convective spread of virus. The gel was formed by bringing a 2% agarose solution (in miliQ water) to a boil, allowing it to cool to 42°C, mixing at a one-to-one ratio with 2x concentrated infection media, pouring the solution onto the infected monolayers, and allowing the solution to gel at room temperature for 20 minutes before returning the plates to the incubator. After incubation, agar overlays were removed, plates were fixed with 4% paraformaldehyde (MP Biomedicals), and cell monolayers were stained with crystal violet (PML Microbiologicals). Plaques were counted manually to determine virus titer. For the plaque-reduction assay, in which ribavirin dilutions are added to the gel layer, plaques were quantified by manual count and by plaque area (see Section 2.5).
2.5 Image analysis
Stained 6-well plates were digitized using a document scanner (Epson Perfection 4490; Epson, Long Beach, USA) at 300dpi, ensuring that the scan settings were adjusted to γ=1 and with no cropping of the intensity histogram. The plate was placed bottom-down on the scanner and illuminated from above using a light box (Porta-Trace Model 1012; Gange, Johnson City, USA). A MATLAB script was used to select the 6 wells automatically and output the unstained area fraction in each well. This value was calculated as the fraction of pixels above (lighter than) a predetermined intensity threshold corresponding to 4 standard deviations from the mean background intensity of stained cell monolayers cultured without drug, or 3 standard deviations from the mean background intensity of monolayers incubated with 24 μg/ml of ribavirin for 40 hours, where cytotoxicity of the drug resulted in a less dense and therefore lighter-stained monolayer. IC50 values were calculated by interpolation.
Though not an essential step in the quantitative influenza virus comet assay, for comparison of assay conditions individual comets were quantified using ImageJ software (Rasband, 1997–2011) by drawing manually a region of interest (ROI) surrounding each individual comet or area of cytopathic effect. The image was thresholded and the number of pixels brighter than the threshold was then measured for each ROI. Where comets overlap, there was an unavoidable degree of subjectivity in the segmentation, but the analysis for each condition was done by the same investigator as consistently as possible. This procedure was useful for comparing different types of comets, but is not required in the typical comet assay application.
2.6 Virus burst experiment
AX4 cells were seeded in 6-well plates and grown to confluence overnight in growth media. The next day, cell monolayers were rinsed and inoculated with influenza virus at a multiplicity of infection (MOI) of 0.8 in 200μL/well of infection media for one hour. After one hour the plates were rinsed and 2mL of infection media was added to each well. Plates were then incubated at 5% CO2 and 37°C. At select timepoints after infection, the supernatant was mixed with a pipette and a sample was removed and frozen at −80°C. Each well was only sampled once. Later, the supernatant samples were diluted and virus titered via the plaque assay, as described in Section 2.4.
2.7 Humidity conditions
To test the effects of humidity on comets, three different incubator chambers were used, with different environmental conditions. The environments in these chambers were all set to 37°C and 5% CO2, while the relative humidity level was varied. A non-humidified condition was created by removing the water bath from one chamber (model 3110, made in 1997; Forma Scientific, Marietta, USA). The relative humidity in this incubator (referred to hereafter as “dry”) stayed at or below 25%. The other two incubators had a water bath to humidify the environment, but the steady-state relative humidity level in one (model 3110, made in 1997; Forma Scientific, Marietta, USA) (referred to hereafter as “wet”) approached 100%, while the other (model 3110, made in 2010; Forma Scientific, Marietta, USA) (referred to hereafter as “intermediate”) approached a steady-state value of 90%. Presumably this distinction comes from air turnover rate differences between the newer and older models.
2.8 Statistics
Means were compared using the Student’s t-test, performed in Microsoft Excel using the “TTEST” function. The variance of two data sets was compared using the Levene F-test based on the median. The test statistic W was calculated according to the formula of Brown and Forsythe (Brown and Forsythe, 1974) in an Excel spreadsheet. The probability was then calculated from W using the “FTEST” function. Coefficients of variability were calculated as the standard deviation divided by the mean.
3. Results
3.1 Comparison of comet and plaque reduction assays for influenza virus
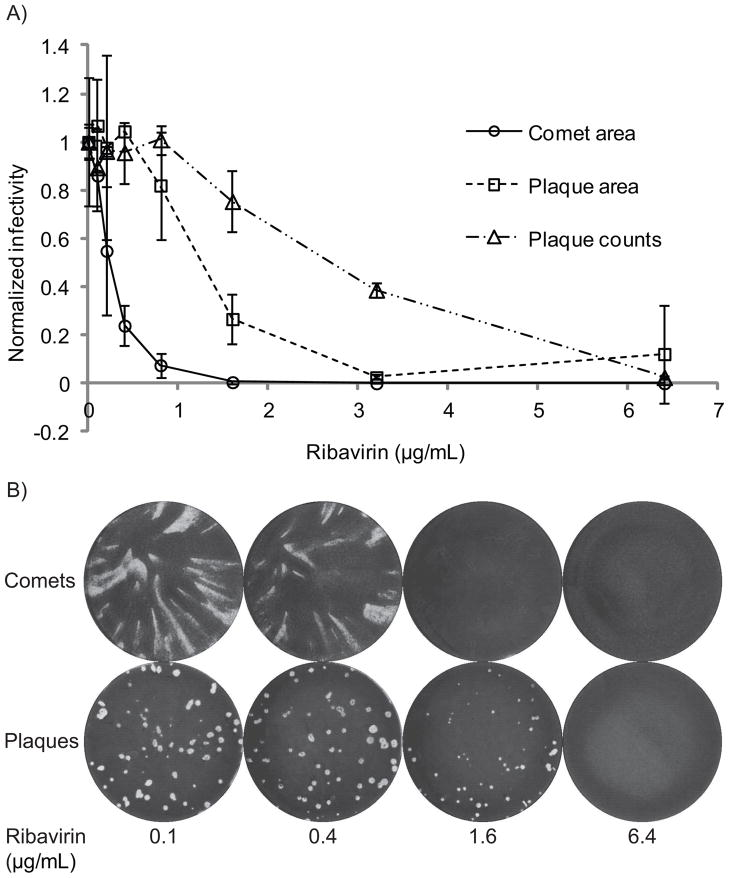
Parallel influenza virus comet and plaque assays were conducted using AX4 cells with varying concentrations of ribavirin added to the wells immediately following inoculation with influenza. Both plaque reduction and comet reduction assays showed a dose-dependent decrease in cytopathic effect with increasing ribavirin (Figure 1). The IC50 for the comet assay was 0.23μg/mL, 13 times lower than the plaque counts IC50 of 2.7μg/mL. The plaque area IC50 was 1.3μg/mL, indicating that using area rather than counts as the measured endpoint results in a two-fold increase in sensitivity to drug. The additional six-fold sensitivity increase must therefore be attributable to convective flow and increased diffusion allowed by replacing agar with liquid media. This could be explained in terms of reduced virus load on secondary infected cells in a comet relative to a plaque, since the virions released from the first infected cell are spread over a much larger area. Given the reduced virus load, a lower concentration of drug is required to inhibit replication and spread.
Figure 1.
A) Dose-response curves for comet reduction and plaque reduction assays with influenza A virus and ribavirin on AX4 cells in a humidified incubator at roughly 90% relative humidity. Comet area is represented by open circles. For the plaque assay, both plaque counts and plaque area measurements are represented. Area and counts values have been normalized by the average value of drug-free controls. Data points represent the mean of three measurements. B) Representative images of comets and plaques with increasing ribavirin.
3.2 Effect of cell type on influenza comets
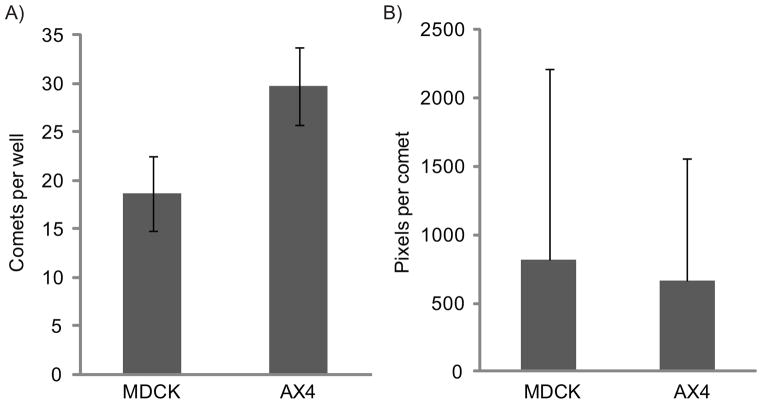
Influenza comet assays were conducted in 12 wells each of AX4 and MDCK cells. The same dilution of virus was used to inoculate each plate, but the total number of visually-identifiable comets was 37% lower in MDCK plates than in AX4 plates (Figure 2A), a statistically significant difference (p<0.01, 2-tailed t-test assuming equal variance). The variance in comet size was significantly larger for MDCK cells (p<0.05, Levene F test using the median) (see Figure 2B), and the coefficient of variability was larger for MDCK cells, at 1.7 compared to 1.3 for AX4 cells.
Figure 2.
Comparison of influenza A comets on AX4 and MDCK cell lines. A) Number of visually-identifiable comets per well. The means and standard deviations of 12 wells each are represented. B) Comet size in pixels per comet after thresholding the image. Represented are the means and standard deviations of 224 comets on MDCK cells, and 357 comets on AX4 cells.
3.3 Effect of environmental humidity on the comet assay
In one possible mechanism, radial flows driving comet formation are related to thermal gradients in the fluid, which may be affected by evaporative cooling from the air-liquid interface. The “wet,” “intermediate,” and “dry” incubators described in Section 2.7 were used to evaluate effects of humidity on various aspects of the comet assay.
3.31 Comparison of quantitative comet reduction assays at varying environmental humidity conditions
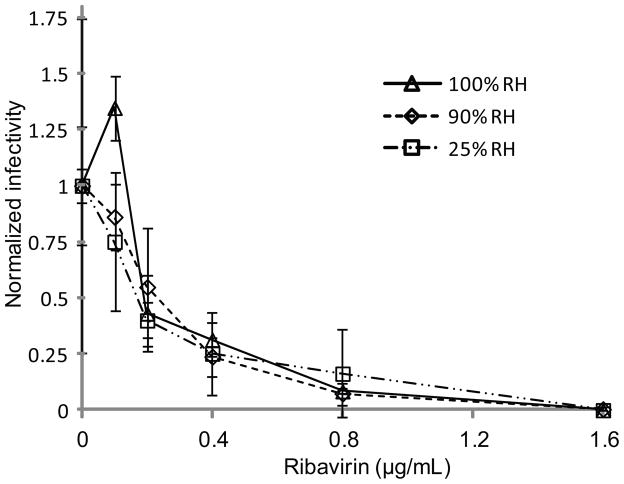
Quantitative influenza virus comet reduction assays were conducted in triplicate using 2-fold dilutions of ribavirin from 1.6 to 0.1 μg/mL at dry, intermediate, and wet humidity conditions (Figure 3). Humidity readings in the incubators report an average of 25%, 90%, and 100% relative humidity, respectively, in the three incubators. Despite clear differences in comet morphology between the three cases, no statistically significant difference was found between the ribavirin IC50 values, which fall in the range of 0.17 to 0.23 μg/mL.
Figure 3.
Ribavirin dose-response curves of influenza A comets on AX4 cells incubated at three different environmental relative humidity conditions: 25%, 90%, and 100%. Data points represent the mean of three measurements.
3.32 Differences in comet morphology at varying environmental humidity conditions
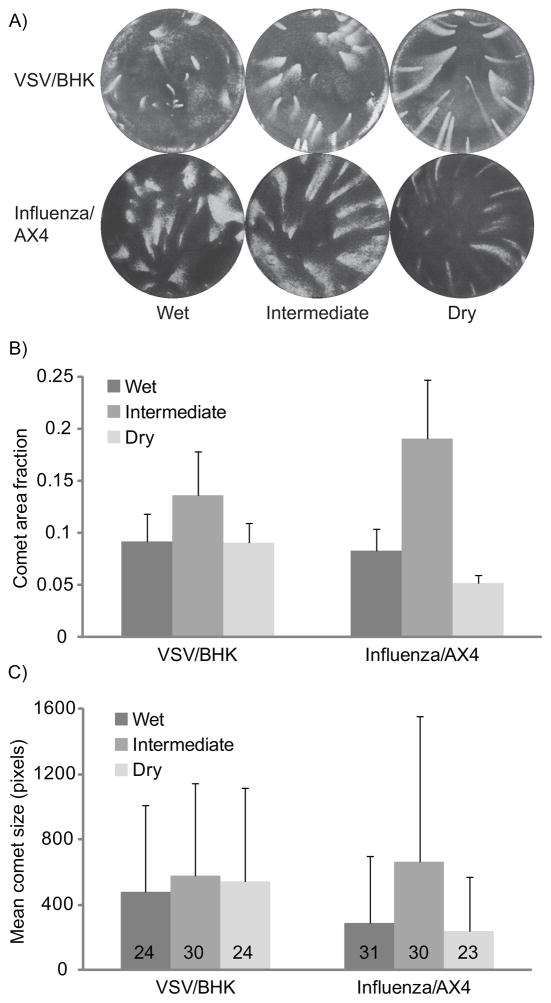
Influenza and VSV comet assays were conducted on AX4 cells and BHK cells, respectively, and incubated in either the wet, intermediate, or dry incubator (representative images in Figure 4A). Average humidity readings for influenza infections were 25% (dry), 90% (intermediate), and 100% (wet). During VSV infection, average humidity readings were 13% (dry), 86% (intermediate), and 95% (wet). Comets from the dry incubator tended to be narrower, more elongated, and oriented uniformly toward the outer wall. The wet conditions, on the other hand, gave rise to less-predictable orientations and the comets were generally shorter in length, indicating weaker convective flow. For both viruses, the mean comet area per well from the intermediate incubator was significantly greater than from wet or dry conditions (p<0.01, 2-tailed t-test assuming unequal variance) (see Figure 4B). For VSV infections on BHK cells, this greater area was the result of an increased number of identifiable comets per well in the intermediate condition (on average 30, compared with 24 for the other two conditions), and a smaller change in individual comet size, with variation between conditions of at most 21%. In contrast, influenza comets on AX4 cells at intermediate conditions are on average more than twice the size of comets at the wet and dry conditions (Figure 4C), while the largest number of identifiable comets was not produced at intermediate conditions.
Figure 4.
Comparison of influenza comets on AX4 cells and VSV comets on BHK cells formed under three different environmental humidity conditions. A) Representative images. B) Average unstained fraction of each well, corresponding to total comet area. Means and standard deviation of 6 wells are represented for the dry and wet conditions, and from 12 wells for the intermediate condition. C) Bars represent mean comet size in pixels per comet after thresholding the image. The mean number of comets counted per well is included on the bar corresponding to each condition. Means and standard deviations were calculated from all the individual comets across 6 wells for the dry and wet conditions, and 12 wells for the intermediate condition.
3.33 Effect of environmental humidity on influenza virus replication kinetics and titers
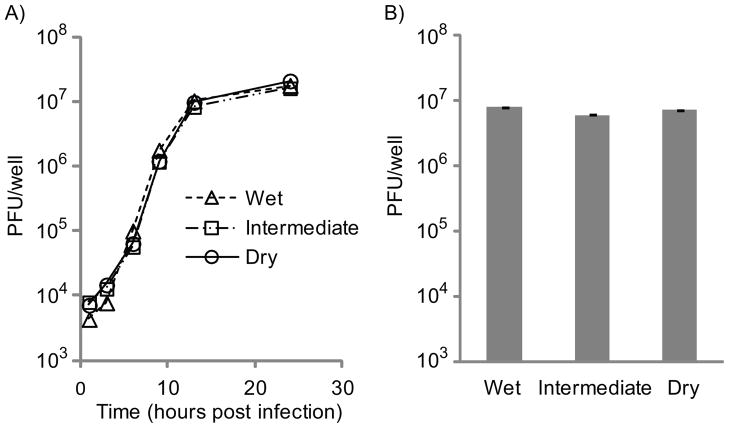
In order to determine whether the differences in influenza comet morphology and area might also be due in part to biological differences at varying humidity conditions, influenza virus burst experiments were carried out on AX4 cells in dry, intermediate, and wet incubators. Prior to infection, cells for all three cases were cultured at intermediate conditions. After inoculation with influenza at 0.8 MOI, the cells in each case were overlaid with fresh media and placed into the appropriate incubator. Samples were taken from parallel wells at 1, 3, 6, 9, 13, and 24 hours after inoculation and virus was quantified by the plaque assay with two replicates. The average relative humidity over the course of the experiment was 20% (dry), 81% (intermediate), and 100% (wet). Virus release profiles are shown in Figure 5A. There is no statistically significant difference in the final titers. The range from smallest titer (intermediate) to largest titer (dry) is 23% of the largest. Since the titer values do not trend with humidity, this range is likely within the noise.
Figure 5.
Influenza A virus burst experiment at three different relative humidity conditions. A) Burst experiment starting with fresh media. AX4 cells were infected at an MOI of 0.8, and parallel wells were sampled at various timepoints and quantified via plaque assay. Infections were incubated at 20% (“dry”), 80% (“intermediate”), or 100% (“wet”) relative humidity. Each data point is the mean of two measurements. Error bars fall within the data points. B) Burst experiment with media and cells pre-conditioned at wet, intermediate, or dry conditions for 19 hours prior to inoculation and incubated at the specified conditions for another 21 hours after inoculation. The virus titers were determined via plaque assay. Each column is the mean of two measurements. Error bars represent the standard deviation.
A second titer experiment was conducted using cells preconditioned in the three humidity conditions prior to infection. This case is more representative of secondary infections in the comet assay. AX4 cells were grown to confluence in intermediate conditions. The growth media was then replaced by 2 mL of infection media and plates were conditioned in dry, intermediate, or wet incubators and incubated 19 hours. After 19 hours, the supernatant from each well was removed but saved during the one-hour inoculation with virus solution at the same concentration as used previously. After inoculation, the cell monolayer was rinsed, the preconditioned media samples were returned to the same wells from which they were taken, and cells were returned to the same incubator in which they had been pre-conditioned for another 20 hours. At the end of the incubation period the supernatant from each well was removed and frozen at −80°C prior to quantitation by plaque assay, accounting for differences in total volume due to evaporation. In this case, the titers still did not trend with humidity and the range from the largest (wet) to smallest (intermediate) was, as before, 23% of the largest value (Figure 5B).
In the context of the influenza comet assay, virus titers were not altered significantly by humidity effects, so the differences in comet area and morphology with humidity must be due primarily to flow conditions within the well.
3.4 Effect of agarose concentration on virus spread
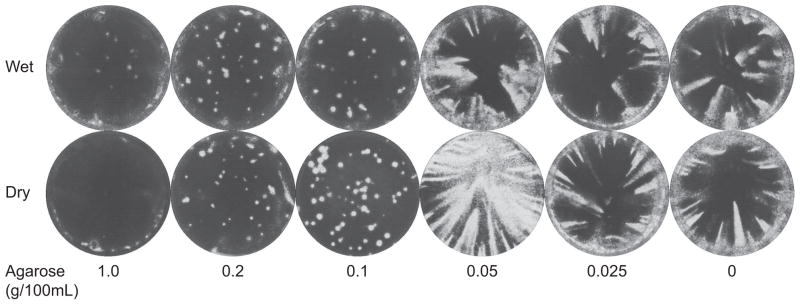
To bridge the gap between the comet assay and the plaque assay, influenza virus infections were conducted following the plaque assay method (Section 2.4), but varying the final agarose concentration between 1% (a plaque assay) and 0% (a comet assay), and incubating for 40 hours, as in the comet method. For both humidified and non-humidified incubator conditions, a transition from comets to plaques was seen at an agarose concentration between 0.05% and 0.10% (Figure 6). Above this threshold, higher concentrations of agar resulted in smaller plaques, but reducing the concentration below the threshold did not yield larger comets. The transition from plaques to comets is a sudden change around the threshold concentration rather than a gradual shift, and is independent of humidity conditions. This threshold likely represents a minimum concentration required for long-range crosslinking into a gel state, consistent with the agarose-water phase diagram from San Biagio et al. (San Biagio et al., 1996).
Figure 6.
Comet-to-plaque transition using agarose dilutions. Low MOI influenza virus infections were incubated under varying agarose concentrations for 40 hours under “wet” (100% relative humidity) or “dry” (20% relative humidity) conditions. The infections took on either a “comet” or “plaque” morphology with a sharp transition between 0.05% and 0.1% agarose.
4. Discussion
A quantitative comet assay method has been demonstrated for influenza virus. The major advantage of the quantitative comet reduction assay is an order-of-magnitude greater sensitivity to drug activity. This allows comet assays to be conducted with lower reagent concentrations, minimizing cell-toxicity effects and reducing assay costs relative to other methods conducted in wells of the same size. Plates can be quantified in an automated way that saves time and avoids tedious plaque counting. This unbiased and automated method of infectivity quantitation represents an advantage over the method of Matrosovich et al. (Matrosovich et al., 2003), who used visual analysis to estimate the 90% inhibitory drug concentration (IC90).
Cell type and humidity were determined to be important parameters in the influenza comet assay. Comets grown on AX4 cells (with increased surface receptor relative to MDCK cells) have reduced variability in size, which would lead to more reproducible and robust assays. Humidity has a strong influence on influenza virus comet size. The ideal humidity conditions fall in an intermediate level between 25% and 100%, with 80–90% relative humidity (normal conditions in most contemporary humidified incubator models) resulting in the most robust comet formation of the conditions tested. The mechanism behind these differences is likely due to altered magnitude of fluid flow, rather than changes in virus production.
Because the quantitative comet assay is a multi-cycle phenotype assay and many of the design considerations are independent of the nature of the virus-host-drug interactions, the assay should be readily adaptable to different virus strains, host types, and antiviral agents. The major requirements are that the virus be capable of plaque formation and efficient release from host cells into the extracellular fluid. For a example, quantitative comet assays for both VSV and influenza A have been demonstrated to give an order-of-magnitude increase in drug sensitivity. Nonetheless, comet morphology – and perhaps the robustness of the assay – may vary depending on the virus and host cell used. In this work, influenza A comets were more than ten times as sensitive to humidity conditions than VSV comets. Biological differences that might influence comet morphology and comet sensitivity to flow conditions include the number of virus progeny produced per cell, virus-receptor binding strength, and receptor density on the cell surface.
Various assay parameters that have not been addressed in detail in this work can be manipulated in order to optimize the assay for a given virus strain or application. These parameters may include well size, fluid volume, incubation time, virus dilution, media composition, and staining technique. The most significant considerations are to generate as many comets as possible per well without significant overlapping (each independent comet is like an experimental replicate), and create comets that are large enough and developed enough to be clearly discernable from background. As seen in Figure 3, non-optimized comet assays can give acceptable results, though comet morphology and assay variability may be affected.
It is interesting that maximizing flow does not create the largest comets. In order for a comet to become visible, virus must infect a sufficient number of contiguous cells. Otherwise, microscopic dead-cell islands will go undetected by a low-resolution scan. Because the living cell monolayer expands to close any gaps or wounds (Fenteany et al., 2000; Matsubayashi et al., 2004; Nikolic et al., 2006; Poujade, et al. 2007), comet incubation conditions that lead to very high comet perimeter-to-area ratios are sub-optimal. More rapid convection in the dry incubator seems to result in more diffuse influenza infections with larger comet perimeter-to-area ratios, leading to reduced total infection area. Overly-diffuse spread is less likely to occur with VSV comets since VSV infections produce titers roughly 2 orders of magnitude greater than influenza infections (data not shown).
Our humidity results support a mechanistic model in which evaporation provides a driving force for fluid flow in 6-well plates. In high evaporation conditions, comets tend to be highly elongated, indicating the dominance of convection over diffusion; while in low evaporation conditions comets tend to be broader, indicating more of a balance between diffusive and convective forces. Though primarily a biological assay, a stained comet assay well also provides a 3-dimensional (2 spatial dimensions and time) record of flow conditions in the well. For example, comets with curvature were observed (see Figure 4A, dry condition), indicating transient flow fields probably related to the changing evaporation conditions as the humidity inside the plate approaches its steady-state level. A more complete understanding of the nature of flows in wells might also have broader benefit for other applications involving fluid in circular plates.
Acknowledgments
Many thanks to Yoshihiro Kawaoka, Masato Hatta, and Martha McGregor for providing cells and virus used in this study, and for helpful discussions regarding the comet assay and other techniques for influenza virus culture. Thanks also to Shreejith Rajkumar for writing much of the MATLAB comet analysis script. Financial support came from the National Institutes of Health (AI077296), and a pre-doctoral fellowship (S.M.L) from the Biotechnology Training Program at the University of Wisconsin-Madison (NIH 5T32GM08349).
Footnotes
Publisher's Disclaimer: This is a PDF file of an unedited manuscript that has been accepted for publication. As a service to our customers we are providing this early version of the manuscript. The manuscript will undergo copyediting, typesetting, and review of the resulting proof before it is published in its final citable form. Please note that during the production process errors may be discovered which could affect the content, and all legal disclaimers that apply to the journal pertain.
References
- Anekal SG, Zhu Y, Graham MD, Yin J. Dynamics of virus spread in the presence of fluid flow. Integr Biol. 2009;1:664–671. doi: 10.1039/b908197f. [DOI] [PMC free article] [PubMed] [Google Scholar]
- Barefoot B, Thornburg NJ, Barouch DH, Yu J, Sample C, Johnston RE, Liao HX, Kepler TB, Haynes BF, Ramsburg E. Comparison of multiple vaccine vectors in a single heterologous prime-boost trial. Vaccine. 2008;26:6108–6118. doi: 10.1016/j.vaccine.2008.09.007. [DOI] [PMC free article] [PubMed] [Google Scholar]
- Brown MB, Forsythe AB. Robust tests for the equality of variances. J Am Stat Assoc. 1974;69:364–367. [Google Scholar]
- Dulbecco R. Production of plaques in monolayer tissue cultures by single particles of an animal virus. Proc Natl Acad Sci U S A. 1952;38:747–752. doi: 10.1073/pnas.38.8.747. [DOI] [PMC free article] [PubMed] [Google Scholar]
- Fenteany G, Janmey PA, Stossel TP. Signaling pathways and cell mechanics involved in wound closure by epithelial cell sheets. Curr Biol. 2000;10:831–838. doi: 10.1016/s0960-9822(00)00579-0. [DOI] [PubMed] [Google Scholar]
- Gambaryan AS, Matrosovich MN, Bender CA, Kilbourne ED. Differences in the biological phenotype of low-yielding (L) and high-yielding (H) variants of swine influenza virus A/NJ/11/76 are associated with their different receptor-binding activity. Virology. 1998;247:223–231. doi: 10.1006/viro.1998.9274. [DOI] [PubMed] [Google Scholar]
- Graci JD, Cameron CE. Mechanisms of action of ribavirin against distinct viruses. Rev Med Virol. 2006;16:37–48. doi: 10.1002/rmv.483. [DOI] [PMC free article] [PubMed] [Google Scholar]
- Hatakeyama S, Sakai-Tagawa Y, Kiso M, Goto H, Kawakami C, Mitamura K, Sugaya N, Suzuki Y, Kawaoka Y. Enhanced expression of an alpha2,6-linked sialic acid on MDCK cells improves isolation of human influenza viruses and evaluation of their sensitivity to a neuraminidase inhibitor. J Clin Microbiol. 2005;43:4139–4146. doi: 10.1128/JCM.43.8.4139-4146.2005. [DOI] [PMC free article] [PubMed] [Google Scholar]
- Law M, Hollinshead R, Smith GL. Antibody-sensitive and antibody-resistant cell-to-cell spread by vaccinia virus: role of the A33R protein in antibody-resistant spread. J Gen Virol. 2002;83:209–222. doi: 10.1099/0022-1317-83-1-209. [DOI] [PubMed] [Google Scholar]
- Li S, Schulman J, Itamura S, Palese P. Glycosylation of neuraminidase determines the neurovirulence of influenza A/WSN/33 virus. J Virol. 1993;67:6667–6673. doi: 10.1128/jvi.67.11.6667-6673.1993. [DOI] [PMC free article] [PubMed] [Google Scholar]
- Matrosovich M, Matrosovich T, Carr J, Roberts NA, Klenk HD. Overexpression of the alpha-2,6-sialyltransferase in MDCK cells increases influenza virus sensitivity to neuraminidase inhibitors. J Virol. 2003;77:8418–8425. doi: 10.1128/JVI.77.15.8418-8425.2003. [DOI] [PMC free article] [PubMed] [Google Scholar]
- Matsubayashi Y, Ebisuya M, Honjoh S, Nishida E. ERK activation propagates in epithelial cell sheets and regulates their migration during wound healing. Curr Biol. 2004;14:731–735. doi: 10.1016/j.cub.2004.03.060. [DOI] [PubMed] [Google Scholar]
- Nikolic DL, Boettiger AN, Bar-Sagi D, Carbeck JD, Shvartsman SY. Role of boundary conditions in an experimental model of epithelial wound healing. Am J Physiol Cell Physiol. 2006;291:C68–75. doi: 10.1152/ajpcell.00411.2005. [DOI] [PubMed] [Google Scholar]
- Olson VA, Karem KL, Smith SK, Hughes CM, Damon IK. Smallpox virus plaque phenotypes: genetic, geographical and case fatality relationships. J Gen Virol. 2009;90:792–798. doi: 10.1099/vir.0.008169-0. [DOI] [PubMed] [Google Scholar]
- Poujade M, Grasland-Mongrain E, Hertzog A, Jouanneau J, Chavrier P, Ladoux B, Buguin A, Silberzan P. Collective migration of an epithelial monolayer in response to a model wound. Proc Natl Acad Sci U S A. 2007;104:15988–15993. doi: 10.1073/pnas.0705062104. [DOI] [PMC free article] [PubMed] [Google Scholar]
- Rasband WS. ImageJ. U. S. National Institutes of Health; Bethesda, Maryland, USA: 1997–2011. http://imagej.nih.gov/ij/ [Google Scholar]
- San Biagio PL, Bulone D, Emanuele A, Palma-Vittorelli MB, Palma MU. Spontaneous symmetry-breaking pathways: time-resolved study of agarose gelation. Food Hydrocoll. 1996;10:91–97. [Google Scholar]
- Smith SK, Olson VA, Karem KL, Jordan R, Hruby DE, Damon IK. In vitro efficacy of ST246 against smallpox and monkeypox. Antimicrob Agents Chemother. 2009;53:1007–1012. doi: 10.1128/AAC.01044-08. [DOI] [PMC free article] [PubMed] [Google Scholar]
- Wilck MB, Seaman MS, Baden LR, Walsh SR, Grandpre LE, Devoy C, Giri A, Kleinjan JA, Noble LC, Stevenson KE, Kim HT, Dolin R. Safety and Immunogenicity of Modified Vaccinia Ankara (ACAM3000): Effect of Dose and Route of Administration. J Infect Dis. 2010;201:1361–1370. doi: 10.1086/651561. [DOI] [PMC free article] [PubMed] [Google Scholar]
- Zhu Y, Yin J. A quantitative comet assay: imaging and analysis of virus plaques formed with a liquid overlay. J Virol Methods. 2007;139:100–102. doi: 10.1016/j.jviromet.2006.09.006. [DOI] [PubMed] [Google Scholar]


