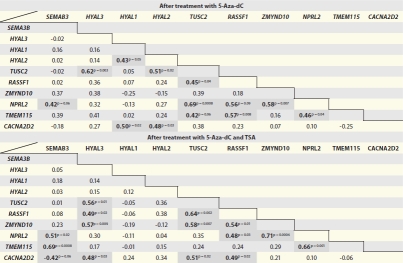
Table 1.
Pair-wise correlation coefficient matrix of expression levels of contiguous genes mapped across 3p21.3 after treatments with 5-Aza-dC and 5-Aza-dC/TSA
 |
Statistically significant correlation coefficients (r) are indicated in bold, p < 0.05.
Pair-wise correlation coefficient matrix of expression levels of contiguous genes mapped across 3p21.3 after treatments with 5-Aza-dC and 5-Aza-dC/TSA
 |
Statistically significant correlation coefficients (r) are indicated in bold, p < 0.05.