Abstract
We report an in-plane optical spectroscopy study on the iron-selenide superconductor K0.75Fe1.75Se2. The measurement revealed the development of a sharp reflectance edge below Tc at frequency much smaller than the superconducting energy gap on a relatively incoherent electronic background, a phenomenon which was not seen in any other Fe-based superconductors so far investigated. Furthermore, the feature could be noticeably suppressed and shifted to lower frequency by a moderate magnetic field. Our analysis indicates that this edge structure arises from the development of a Josephson-coupling plasmon in the superconducting condensate. Together with the transmission electron microscopy analysis, our study yields compelling evidence for the presence of nanoscale phase separation between superconductivity and magnetism. The results also enable us to understand various seemingly controversial experimental data probed from different techniques.
The recent discovery of a new Fe-based superconducting system AxFe2−ySe2 (A = alkaline metals or Tl, x≤1) with Tc over 30 K has attracted considerable attention1. The system not only sets a new record for the highest Tc for the iron-selenide (FeSe-) based compounds at ambient pressure, but also exhibits a number of physical properties that are markedly different from all other Fe-pnictide/chalcogenide systems. Unlike other Fe-pnictides or chalcogenides where the superconductors develop from spin-density-wave (SDW) type metals with compensating hole and electron Fermi surfaces locating respectively at the Brillouin zone center and corners2,3,4, the superconductivity in this system was found to be in close proximity to an insulating phase5. The Fermi surface (FS) topologies of superconducting compounds are very different from previously known superconducting Fe-pnictides. Both band structure calculations6,7 and angle-resolved photoemission spectroscopy (ARPES) studies8,9 indicated that only the electron pockets are present in the superconducting compounds, while the hole bands sink below the Fermi level, indicating that the inter-pocket scattering between the hole and electron pockets is not an essential ingredient for superconductivity. More surprisingly, recent muon-spin relaxation (µSR)10,11, neutron diffraction12,13,14, Raman15, resistivity and magnetization16 measurements on AxFe2−ySe2 (A = K, Rb, Cs, Tl) revealed a coexistence of superconductivity and very strong antiferromagnetism. A blocked checkerboard antiferromagnetic (AFM) order occurs in the Fe-deficient lattice with the Fe vacancies forming a  superstructure modulation. The ordered moment reaches 3.31 µB/Fe12,13,14.
A crucial question for the new system is whether the superconductivity and the strong magnetism coexist on a microscopic scale or they are phase separated? Neutron diffractions indicated that the intensity of the magnetic Bragg peaks shows a sharp downturn as the temperature is lowered below Tc12. The Raman scattering experiments also revealed a sudden reduction of the intensity of the two-magnon peak upon entering the superconducting phase15. Both measurements seem to suggest that the antiferromagnetism and the superconductivity are strongly coupled, pointing to a microscopic coexistence of antiferromagnetic order and superconductivity. On the other hand, several other measurements, including magnetization17, TEM18, ARPES19, Mössbauer20, STM21, indicate that the superconductivity and magnetic order are phase separated in the sample. The strong inconsistency from different experiments becomes a crucial issue for the system and needs to be solved.
Here we report optical spectroscopy measurements on well-characterized superconducting samples. Unexpectedly, we observed the development of a relatively sharp reflectance edge below Tc on the relatively incoherent electronic background. Its energy scale is much smaller than the superconducting energy gap, and as a consequence, this feature is not determined by the pairing gap formation. Furthermore, the feature could be noticeably suppressed and shifted to lower frequency by a moderate magnetic field. We elaborate that this reflectance edge arises from the development of a Josephson-coupling plasmon in the superconducting condensate. The data highly suggest a nanoscaled and possibly stripe-type phase separation between superconductivity and magnetic insulator, which was further confirmed by the transmission electron microscopy (TEM) dark-field image technique. The results also enable us to understand various seemingly controversial experimental data probed from different techniques.
Results
Figure 1 shows the temperature dependence of the in-plane resistivity, magnetization, and specific heat data. The resistivity shows a weak metallic temperature dependence. Two step transitions were seen in resistivity curve. A sharp drop at 42 K was observed followed by a major transition near 30 K. The transition at 42 K could be weakly seen in a highly enlarged scale in the magnetization curve with H∥c, similar to the report in Ref. 23, but is not visible in the specific heat measurement, suggesting an extremely small fraction or interface superconductivity at this transition temperature in the sample. Clear diamagnetization in susceptibility and jump in specific heat were seen at lower temperature, ∼28 K, where the sample already reaches zero resistivity. High temperature magnetization measurement revealed the presence of an AFM phase transition near 520 K for this sample.
Figure 1. (a) The in-plane resistivity versus temperature for K0.75Fe1.75Se2 single crystal.
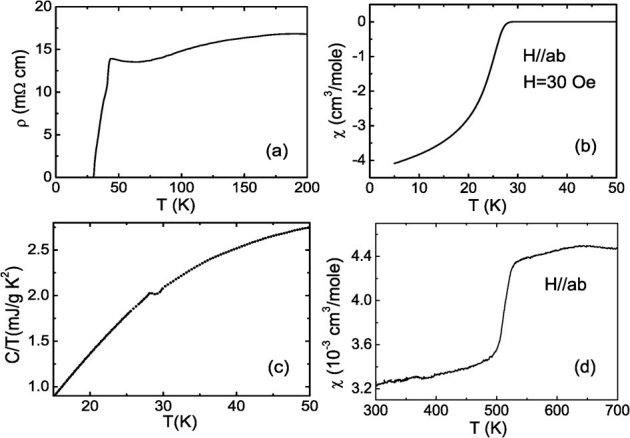
The sample shows a sharp drop in ρ(T) at 43 K, then a major transition near 30 K. (b) The temperature dependence of magnetic susceptibility below 50 K. Sharp diamagnetic transition appears at 28 K. (c) The low temperature specific heat data for the sample. Clear specific jump is observed near 28 K, evidencing bulk superconductivity. (d) The high temperature magnetic susceptibility measured at 1 T for the sample. Antiferromagnetic phase transition is still present for the superconducting sample.
Figure 2 shows the R(ω) and σ1(ω) spectra for the K0.75Fe1.75Se2 sample. The left panels show the R(ω) and σ1(ω) spectra up to 8000 cm−1, the right panels show the spectra in the expanded low frequency region within 250 cm−1. Similar to the insulating compound with lower Fe content22, the reflectance over broad frequencies is rather low, roughly below the value of 0.4. In the earlier study on the insulating compounds, two characteristic spectral features specific to the KxFe2−ySe2 system were identified: a double peak absorption structure between 4000–6000 cm−1 and abundant phonon peaks (much more than those expected for a standard 122 structure). Both features were interpreted to be highly related to the blocked checkerboard AFM order associated with the presence of Fe vacancies and their orderings22. Those features are also seen in the present compound, suggesting the presence of Fe vacancies and their orderings in the superconducting samples. The presence of  superstructure modulation was confirmed by the TEM measurement as we shall present below. It is also consistent with the high temperature magnetization measurement showing the presence of AFM transition near 520 K (Fig. 1 (d)).
Figure 2. (a) and (b): optical reflectance R(ω) and conductivity σ1(ω) spectra at different temperatures up to 8000 cm–1.
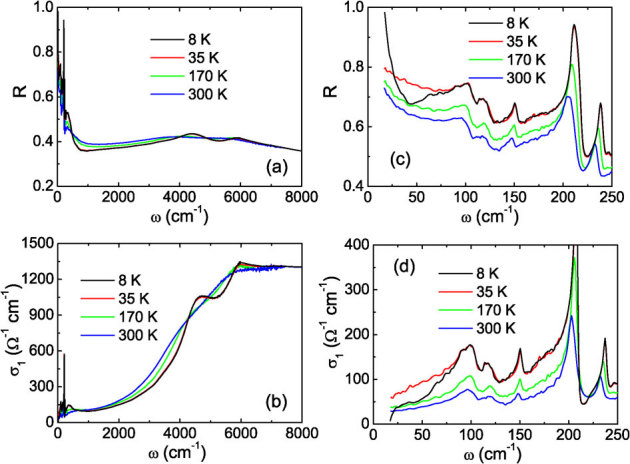
(c) and (d): An expanded plot of R(ω) and σ1(ω) spectra below 250 cm–1. A sharp plasma edge in R(ω) develops at low frequency in the superconducting state.
The major spectral change relative to the insulating compound appears at low frequencies. The reflectance R(ω) values at low frequencies are obviously higher than that of insulating samples22. Furthermore, the low-ω R(ω) shows a metallic temperature dependence: the R(ω) values increases with decreasing temperature. However, this kind of metallic response is rather weak. In the optical conductivity spectra, the low-frequency region is still dominated by phonon modes. The electronic background has a rather low spectral weight without showing a clear Drude-like component. Unexpectedly, a relatively sharp reflectance edge develops below 30 cm−1 in the superconducting state. This surprising sharp feature was repeatedly observed in different superconducting samples.
The observation of a sharp reflectance edge below Tc is the most intriguing experimental result in the infrared spectroscopy measurement. It is important to understand its physical origin. Naturally, one has to examine whether or not the spectral feature is caused by the formation of a superconducting energy gap? As indicated below, this possibility is highly unlikely for several reasons. First and the most importantly, the superconducting energy gap (2Δ) amplitudes determined directly by the ARPES experiments on the electronic pockets, which are the only dispersive bands crossing the Fermi level, are close to 18–20 meV8,24. Those values are much larger than the energy scale seen for the edge. Second, although the sample is superconducting, the reflectance values at the lowest measurement frequency limit in the normal state are still far below the unit, leading to a non-Drude-like response in σ1(ω). As we shall also explain below that the sample likely contains some insulating phase, it is hard to imagine that a full gap feature could be realized in the relatively nonhomogeneous sample. Furthermore, the reflectance spectral at 8 K shows a strong dip feature near 44 cm−1. At this frequency, its R(ω) value is much lower than that in the normal state (R(8 K)/R(35 K)≈0.9). The dip is so pronounced that the feature is unlikely to be related to a superconducting gap.
On the other hand, the relatively sharp feature is more likely to be caused by the Josephson-coupling plasma edge. As seen from Fig. 3, the real part of the dielectric function ε1(ω) in the normal state (e.g. at 35 K) is positive and further increases in the lowest-frequency region, similar to the case of insulating dielectrics. However, in the superconducting state, the low-ω ɛ1(ω) becomes a rapidly decreasing function of ω toward ω = 0. The reflectance edge corresponds to the zero-crossing of the real part of the dielectric function ɛ1(ω), indicating that this edge is resulted from collective plasma oscillation.
Figure 3. The real part of dielectric functions versus frequency at 35 and 8 K. ɛ1(ω) at 35 K is positive and increases further with decreasing frequency.
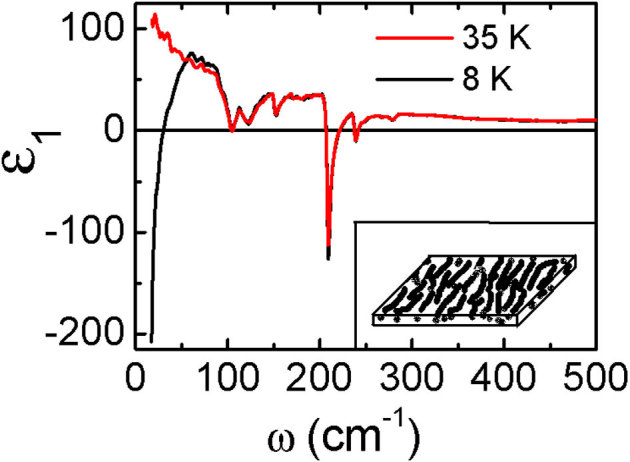
However, the ɛ1(ω) crosses the zero at low frequency in the superconducting state. The inset shows a schematic picture of the nanoscale stripe-type phase separation between superconducting (white stripe) and insulating (black) regions.
The Josephson plasmon has been widely observed in the high-Tc cuprates with the electric field polarized along the c-axis25,26,27,28. Since the cuprate superconductor could be viewed as an alternating stack of superconducting CuO2 planes and insulating building blocks, the optical response is still insulator-like in the normal state. However, once entering into the superconducting state, those CuO2 layers are coupled through the Josephson tunneling effect. Then, a plasma edge corresponding to the superconducting condensate emerges with its location mainly determined by the critical current density in the stacking direction. Because of the periodic spacing of the CuO2 layers in the crystal structure, the Josephson plasma edge is very sharp. We suggest that similar situation occurs for K0.75Fe1.75Se2 compound here. If the sample has a nanoscale phase separation between the superconducting and insulating phases, for example, a stripe-type phase separation as outlined schematically in the inset of Fig. 3, this type of Josephson coupling plasmon would be well expected.
To verify the above proposal, we performed TEM investigations by using the superstructure reflection spots for dark-field imaging on the superconducting crystals. Figures 4 (a) shows an electron diffraction pattern taken along the [001] zone axis direction, in which the superstructure spots with both (1/5, 3/5, 0) and (1/2, 1/2, 0) wave vectors can be clearly seen. Figure 4 (b) displays the dark-field TEM images by using one of the superstructure spot as indicated in Fig. 4 (a). The well ordered regions with fine striped or speckled contrasts can be commonly observed. The length of a stripe could be in the range from several to several tens or even over 100 nanometers, while it width is usually less than 10 nanometers. This kind of complex contrast in Fig. 4 (b) can be explained directly as the coexistence of Fe-vacancy ordered bright areas and Fe deficiency-free (or Fe-disordered) areas. Taking into account of the remarkable superconductivity in present sample, we can conclude that the Fe deficiency-free/Fe-disordered areas are mainly governed by the superconducting phase. The dark-field TEM image technique provides direct and strong support for the presence of nanoscaled stripe or speckled phase separation. Because the phase separation could not be uniform everywhere in the sample, the Josephson coupling strength would exhibit local variations. It implies that the Josephson plasma frequencies would show a distribution around a center frequency. As a result, the Josephson plasma edge could not be as sharp as that observed in the c-axis optical response in the cuprates.
Figure 4. Phase separation in a K0.75Fe1.75Se2 superconducting crystal.
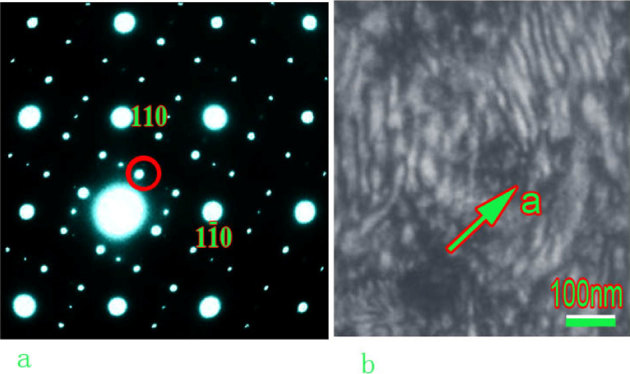
(a) Electron diffraction pattern showing the presence of superstructure spots along the [310] direction, the cycled spot is used for dark-field imaging. (b) Dark field image taken from a thin region of a K0.75Fe1.75Se2 crystal. Stripe-type phase separation could be directly observed. The arrow a indicates the [100] direction.
Naturally, the insulating phase could be assigned to the AFM ordered phase with a  superstructure modulation, while the superconducting phase originates from the K-deficient K0.75Fe2Se2 composition. Because of the K-vacancy ordering, it results in a
  superlattice. This phase is indeed heavily electron-doped, and thus has a big electron FS, which has been detected by the ARPES experiment8,9. From earlier optical measurement on the insulating sample, a small indirect gap ∼30 meV was identified22. Because the barrier is rather low, the two superconducting stripes separated by the AFM ordered insulating region could be coupled through the Josephson tunnelling effect in the superconducting state.
To further substantiate the picture, we tried to reproduce the shape of the Josephson plasma edge with a simple model as suggested by van der Marel and Tsvetkov29 that has taken account of the distribution of the Josephson plasma frequencies around a center frequency. The expression for dielectric function has the form of
where F(X) is the normalized distribution function of the screened Josephson plasma frequencies, which we assume to have a form of Gaussian distribution function,  . In the above equation, ωJ is the central frequency of the screened Josephson plasma frequency, σn the normal fluid component, ε∞ the high frequency dielectric constant, and σ the variance of the distribution function. Figure 5 (a) shows the shape of the Josephson plasma edge as a function of the variance of the distribution function in the normalized Gaussian distribution function of the screened plasma frequencies. The change of the normalized Gaussian distribution of the screened plasma frequencies with the parameter σ is plotted in Fig. 5 (b). Here the parameters were chosen as ωJ = 40 cm−1, σn = 5 S/cm, ε∞ = 15. The variance of the distribution function is chosen as σ = 1, 5, 10, 15. Clearly, the Josephson plasma edge becomes less sharp when the Josephson plasma frequencies have broader distributions. Qualitatively, it explains the observation fairly well.
Figure 5. (a) the variation of the reflectance edge shape as a function of the distribution of the the Josephson plasma frequencies.
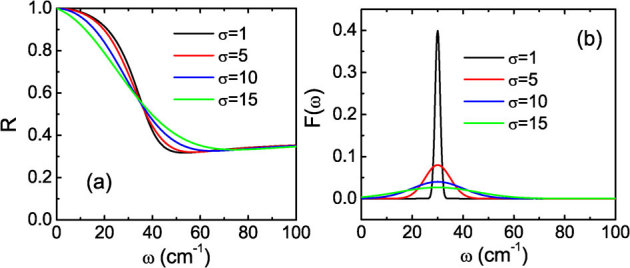
(b) the plot of the normalized Gaussian distribution of the screened plasma frequencies as a function of the parameter σ.
Since the Josephson coupling plasmon is a phenomenon related to the tunnelling of the condensed superconducting carriers, it should be easily influenced by the external magnetic field. We therefore explored the effect of the magnetic field on the Josephson coupling plasmon edge. Figure 6 shows a far-infrared reflectance measurements under zero field and H = 8 T for a different sample grown in the same condition. The field is applied along the c-axis which is perpendicular to the electric field of the infrared radiation. Relative to the curve at 35 K, the R(ω) at 5 K shows a clear edge-like shape with a dip appearing near 50 cm–1. Applying magnetic field to the sample, the edge-like feature weakens and shifts towards lower frequencies. From Fig. 6 (a), it is easy to find that R(ω) under the field of 8 T at T = 5 K follows the normal-state R(ω) measured at 35 K down to much lower frequencies. Figure 6 (b) is a plot of the ratio of the zero-field reflectance at 35 K to the reflectance curves at 5 K under different fields. Then we find a peak in the ratio curve, which shifts to lower frequency side by over 13 cm–1 by a magnetic field of 8 T. Meanwhile, the intensity of the peak drops. The rather significant change of the plasma edge structure by such a moderate field also favors a Josephson coupling plasmon scenario rather than a superconducting energy gap, since the upper critical field is known to be extremely high in this compound23.
Figure 6. (Color online) (a) The reflectance at 5 K under H = 0 and 8 T.
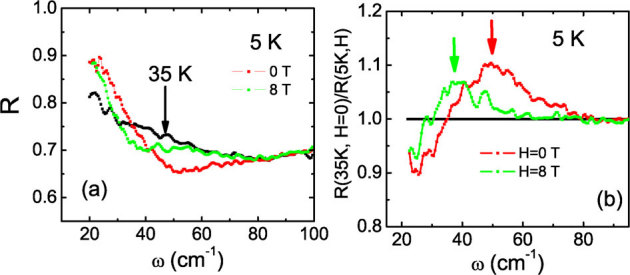
The reflectance curve at 35 K under zero field is also shown as indicated by the black arrow. (b) The ratio of the zero-field reflectance at 35 K to the reflectance curves at 5 K under different fields. The arrows indicate the frequency shift of the peaks.
Discussion
Our experimental investigation revealed novel Josephson coupling phenomenon in the new AxFe2–ySe2 superconducting single crystals, which was not seen in other Fe-based superconductors. In fact, except for the polarized infrared measurement of E||c-axis on cuprates below Tc, we were not aware of observation of Josephson plasmons in any other superconducting compounds. Our experimental results yield compelling evidence for the presence of nanoscale phase separation between superconducting and AFM ordered insulating phases. The rather incoherent low-frequency optical conductivity is naturally due to the presence of sizeable fraction of insulating phase which largely blocks the conducting paths. The presence of the sizeable fraction of insulating phase could also account for the presence of double interband transition peaks between 4000 and 6000 cm–1 and abundant phonon peaks observed in all measured superconducting samples, which were interpreted as being associated with the blocked antiferromagnetism due to the presence of Fe vacancy ordering22.
Based on the nanoscale phase separation picture, one can also explain those seemingly controversial experimental data probed from different techniques. Currently, the strongest experimental support for a microscopic coexistence of antiferromagnetic order and superconductivity comes from the neutron diffraction12 and two-magnon Raman-scattering15 measurements. The intensity of the magnetic Bragg peaks in neutron diffraction shows a sharp downturn (approximately 5%) as the temperature is lowered below Tc. The intensity of the two-magnon peak in Raman scattering also undergoes a 5% sudden reduction on entering the superconducting phase. If the phase separation occured at a macroscopic region, this drop is really hard to understand. However, the phase separation revealed in this study comes out at a nanoscale level. There exist a huge amount of the phase boundaries. Below Tc, the superconducting proximity effect near the phase boundaries would effectively reduce the AFM ordered region. Then, the reduction of several percent magnetic response would not be unexpected.
Methods
The single crystals used in the present study were grown from a self-melting method with nominal concentration of K:Fe:Se = 0.8∶2.1∶2 in a procedure similar to the description in reference22. The actual composition, determined by the average value of the energy dispersive x-ray (EDX) spectroscopy analysis, was found very close to 0.75∶1.75∶2. The temperature dependence of the in-plane resistivity, magnetization, and specific heat were measured by PPMS and SQUID from Quantum Design. Optical measurements at zero and magnetic field were done on Bruker 113v and Vertex 80 v spectrometers in the frequency range from 17 to 25000 cm–1. The sample surface area is about 4 mm×4 mm. An in situ gold and aluminum overcoating technique was used to get the reflectance R(ω). The real part of conductivity σ1(ω) is obtained by the Kramers-Kronig transformation of R(ω). The TEM measurement was taken on a FEI Tecnai-F20 (200 kV) transmission electron microscope.
Author Contributions
N.L.W. planned and coordinated the experiments. R.H.Y, T.D. grew single crystals and carried out resistivity, magnetization, specific heat, and optical spectroscopy experiments. T.D. did the model simulation. Y.J.S. J.Q.L. performed TEM measurement and dark field analysis. P.Z. helped with transport and specific heat measurement. G.F.C. contributed to crystal growth at the early stage. J.P.H. helped with data interpretation. N.L.W. wrote the paper.
Acknowledgments
We acknowledge enlightening discussions with Christian Bernhard. This work was supported by the NSFC and the 973 project of the MOST.
References
- Guo J. et al. Superconductivity in the iron selenide KxFe2Se2 (0≤ x ≤ 1). Phys. Rev. B 82, 180520 (2010). [Google Scholar]
- Dong J. et al. Competing Orders and Spin-Density-Wave Instability in La(O1–xFx)FeAs. Europhys. Lett. 83, 27006 (2008). [Google Scholar]
- de la Cruz C. et al. Magnetic order close to superconductivity in the iron-based layered LaO12xFxFeAs systems. Nature 453, 899–902 (2008). [DOI] [PubMed] [Google Scholar]
- Singh D. J. Electronic Structure of Fe-Based Superconductors. Physica C 469, 418–424 (2009). [Google Scholar]
- Fang M. H. et al. Fe-based high temperature superconductivity with Tc = 31K bordering an insulating antiferromagnet in (Tl, K)FexSe2 Crystals. Europhys. Lett. 94, 27009 (2011). [Google Scholar]
- Nebrasov I. A. and Sadovskii M. V. Electronic structure, topological phase transitions and superconductivity in (K, Cs)xFe2Se2. JETP Lett. 93, 166–169 (2011). [Google Scholar]
- Yan X. W. et al. Electronic and magnetic structures of ternary iron selenides AFe2Se2 (A = K, Cs, or Tl). Phys. Rev. B 84, 054502 (2011). [Google Scholar]
- Zhang Y. et al. Heavily electron-doped electronic structure and isotropic superconducting gap in AxFe2Se2 (A = K, Cs). Nature Materials 10, 273–277 (2011). [DOI] [PubMed] [Google Scholar]
- Qian T. et al. Absence of holelike Fermi surface in superconducting K0.8Fe1.7Se2 revealed by ARPES. Phys. Rev. Lett. 106, 187001 (2011). [DOI] [PubMed] [Google Scholar]
- Shermadini Z. et al. Coexistence of Magnetism and Superconductivity in the Iron-based Compound Cs0.8(FeSe0.98)2. Phys. Rev. Lett. 106, 117602 (2011). [DOI] [PubMed] [Google Scholar]
- Yu V. et al. Iron vacancy superstructure and possible room temperature antiferromagnetic order in superconducting CsyFe2–xSe2. Phys. Rev. B 83, 144410 (2011). [Google Scholar]
- Bao W. et al. A Novel Large Moment Antiferromagnetic Order in K0.8Fe1.6Se2 Superconductor. Chinese Phys. Lett. 28, 086104 (2011). [Google Scholar]
- Ye F. et al. Common Crystalline and Magnetic Structure of superconducting A2Fe4Se5. Phys. Rev. Lett. 107, 137003 (2011). [DOI] [PubMed] [Google Scholar]
- Bao W. et al. Vacancy tuned magnetic high-Tc superconductor KxFe2–x/2Se2. arXiv:1102.3674.
- Zhang A. M. et al. Two-magnon Raman-scattering evidence for coexisting superconductivity and antiferromagnetic order in A0.8Fe1.6Se2 systems. arXiv:1106.2706.
- Liu R. H. et al. Coexistence of superconductivity and antiferromagnetism in single crystals A0.8Fe2–ySe2 (A = K, Rb, Cs, Tl/K and Tl/Rb): evidence from magnetization and resistivity. Europhys. Lett. 94, 27008 (2011). [Google Scholar]
- Shen B. et al. Intrinsic Percolative Superconductivity in KxFe2–ySe2 Single Crystals. Europhys. Lett. 96, 37010 (2011). [Google Scholar]
- Wang Z. et al. Microstructure and Fe-vacancy ordering in the KFexSe2 superconducting system. Phys. Rev. B 83, 140505(R) (2011). [Google Scholar]
- Chen F. et al. Electronic identification of the actual parental phase of KxFe2–ySe2 superconductor and its intrinsic mesoscopic phase separation, arXiv: 1106.3026.
- Ryan D. H. et al. 57Fe Mössbauer study of magnetic ordering in superconducting K0.80Fe1.76Se2.00 single crystals. Phys. Rev. B 83, 104526 (2011). [Google Scholar]
- Li W. et al. Phase separation and magnetic order in K-doped iron selenide superconductor, Nature Phys. Advanced Online Publication, 10.1038/NPHYS2155 (2011). [Google Scholar]
- Chen Z. G. et al. Infrared spectrum and its implications for the electronic structure of the semiconducting iron selenide K0.83Fe1.53Se2. Phys. Rev. B 83, 220507(R) (2011). [Google Scholar]
- Wang D. M. et al. The effect of varying Fe-content on transport properties of K intercalated iron selenide KxFe2–ySe2. Phys. Rev. B 83, 132502 (2011). [Google Scholar]
- Zhao L. et al. Common Fermi Surface Topology and Nodeless Superconducting Gap in K0.68Fe1.79Se2 and (Tl0.45K0.34)Fe1.84Se2 Superconductors Revealed from Angle-Resolved Photoemission Spectroscopy. Phys. Rev. B 83, 140508(R) (2011). [Google Scholar]
- Tamasaku K. Nakamura Y. and Uchida S. Charge dynamics across the CuO2 planes in La2–xSrxCuO4. Phys. Rev. Lett. 69, 1455–1458 (1992). [DOI] [PubMed] [Google Scholar]
- Basov D. N., Timusk T., Dabrowski B. and Jorgensen J. D. c-axis response of YBa2Cu4O8: A pseudogap and possibility of Josephson coupling of CuO2. Phys. Rev. B 50, 3511–3514 (1994). [DOI] [PubMed] [Google Scholar]
- Uchida S., Tamasaku K. and Tajima S. c-axis optical spectra and charge dynamics in La2–xSrxCuO4. Phys. Rev. B 53, 14558–14574 (1996). [DOI] [PubMed] [Google Scholar]
- Shibata H. and Yamada T. Far-infrared reflectivity along the c-axis in La2CuO4+δ, La1.89Ca1.11Cu2O6+δ, and Nd2CuO4–xFx single crystals. Phys. Rev. B 56, R14275–R14278 (1997). [Google Scholar]
- van der Marel D. and Tsvetkov A. Transverse ooptical plasmons in layered superconductors. Czech. Journal of Physics 46, 3165 (1996). [Google Scholar]


