

Abstract
GLYCAM06 is a generalisable biomolecular force field that is extendible to diverse molecular classes in the spirit of a small-molecule force field. Here we report parameters for lipids, lipid bilayers and glycolipids for use with GLYCAM06. Only three lipid-specific atom types have been introduced, in keeping with the general philosophy of transferable parameter development. Bond stretching, angle bending, and torsional force constants were derived by fitting to quantum mechanical data for a collection of minimal molecular fragments and related small molecules. Partial atomic charges were computed by fitting to ensemble-averaged quantum-computed molecular electrostatic potentials.
In addition to reproducing quantum mechanical internal rotational energies and experimental valence geometries for an array of small molecules, condensed-phase simulations employing the new parameters are shown to reproduce the bulk physical properties of a DMPC lipid bilayer. The new parameters allow for molecular dynamics simulations of complex systems containing lipids, lipid bilayers, glycolipids, and carbohydrates, using an internally consistent force field. By combining the AMBER parameters for proteins with the GLYCAM06 parameters, it is also possible to simulate protein-lipid complexes and proteins in biologically relevant membrane-like environments.
Keywords: GLYCAM, molecular dynamics, glycolipid, bilayer, phospholipid
1. Introduction
Proteins and carbohydrates often exist as components of membranes [1, 2] and their functions depend in part on their orientation (presentation) relative to the membrane surface [3]. In the case of glycolipids, the lipid tail embeds in the membrane bilayer exposing the carbohydrate head group to the surrounding aqueous environment. Although the physical and bulk structural properties of lipid bilayers, such as the compressibility modulus, bilayer thickness, or lipid head group density, are available for a wide variety of lipids [4], detailed 3D structural characterization of embedded molecules remains challenging [3].
In the case of glycolipids, NMR spectroscopy has been used to examine the presentation of the carbohydrate head group [5], and data suggest that the glycan adopts distinct conformations. However, experimental data may be insufficient to uniquely characterize the conformations and orientations populated by the carbohydrate head group relative to the membrane surface [6]. Therefore, there is a potential for computational methods to augment and complement the sparse experimental data for membrane-associated biomolecules. This potential has been demonstrated in the case of lipid bilayers (reviewed in [7]) and protein/lipid bilayer systems [8–12], wherein MD simulations have enhanced our understanding of the structural, functional and dynamic properties of these systems.
Here we extend the GLYCAM biomolecular force field for carbohydrates to lipids, phospholipids and glycolipids. Phospholipids are the primary component of cell membranes and their hydrophobic tails are composed of aliphatic carbon chains that may be saturated, monounsaturated, or polyunsaturated. The hydrophilic head groups are often charged, containing phosphatidylcholine, phosphatidylethanolamine, phosphatidylserine, or may be linked to other types of biomolecules. Lipid classes, such as sphingolipids, phospholipids and glycolipids, combine to yield the heterogeneous and multifunctional eukaryotic plasma membrane [1]. The lipid composition of a biological membrane is nonuniform and creates functionally specific regions of the membrane, such as lipid rafts [13], that can impact the activity of associated proteins [1]. Lipid rafts are often associated with the presence of cholesterol in the membrane [13].
The similarities in atomic composition and connectivities between carbohydrates and lipids facilitated the extension of the recently reported GLYCAM06 (glycans and glycoconjugates in AMBER) biomolecular force field [14] to lipids and glycolipids. To remain consistent with the GLYCAM06 formalism, the following criteria were used to guide its extension: 1) the new parameters should be transferable to the most common and biologically relevant lipids, lipid bilayers, and glycolipids, 2) they should be self-contained and therefore readily transferable to many quadratic force fields, 3) as few new atom types as possible should be introduced, 4) the new parameters should be compatible with all existing parameters and molecular classes in GLYCAM06, 5) the accuracy of the parameters should be rigorously assessed by application to developmental and test molecules through comparison with theoretical and experimental data, and 6) the use of 1– 4 non-bonded electrostatic or van der Waals (vdW) scale factors should be avoided [15].
To illustrate the performance of the resultant parameters in a bilayer simulation, a 15 ns MD simulation of a 1,2-dimyristoyl-sn-glycero-3-phosphatidylcholine (DMPC) bilayer in explicit TIP3P water was performed. The physical properties of DMPC are well established, thus facilitating critical comparison between the MD and experimental data.
2. Methods
2.1 Parameter Development
Quantum mechanical (QM) geometry optimizations were performed using the GAUSSIAN98 software package [16] at the HF/6-31G* level of theory unless otherwise noted, while single point energies were calculated at the B3LYP/6-31++G(2d,2p) level, in accordance with the parameterisation methods outlined in GLYCAM06 [14].
The AMBER 8 software package [17] was employed for all molecular mechanical (MM) and MD calculations. As recommended for carbohydrates [18] 1–4 non-bonded and electrostatic scale factors were set to unity (SCEE =1 and SCNB = 1, respectively). Atomic vdW parameters were taken from the GLYCAM/AMBER parameter set [14], which originated from AMBER [19]. Consistent with GLYCAM06, torsion rotation terms and valence harmonic force constants were generated by fitting to QM data computed for representative molecules at the B3LYP/6-31++G(2d,2p)//HF/6-31G* level, for rotamers sampled at 30 degree increments. Torsion coefficients (V1, V2, and V3) for the classical bond rotation terms were fitted to the quantum data without using phase shifts, employing a multi-variable least squares algorithm. Torsion contributions were explicitly defined for all constituent linkages employing representative molecular fragments. Equilibrium bond lengths and angles were selected from the best available experimental data for each representative molecule, or from closely related molecules, with preference being given to gas-phase structural data; sources and structures are listed in Table 1. The Cambridge Structural Database [20] was accessed through the ConQuest software package [21] to identify pertinent experimental structures.
Table 1.
Atom types, bonds, angles and torsion parameters in GLYCAM06 (lipid extension)
| Atom Name | vdW radius (Å) | ε (kcal/mol) | Type |
|---|---|---|---|
| CK | 1.908 (PARM 94) | 0.086 (PARM 94) | sp2 carbon for alkenes |
| CJ | 1.908 (PARM 94) | 0.086 (PARM 94) | sp2 alkene carbon single-bonded to an sp2 alkene carbon |
| CP | 1.908 (PARM 94) | 0.109 (PARM 94) | sp3 aliphatic carbon adjacent to phosphate |
| HP | 1.100 (PARM 94) | 0.016 (PARM 94) | H bonded to C adjacent to a positively charged group |
| N3 | 1.824 (PARM 94) | 0.170 (PARM 94) | Positively charged amino group nitrogen (Lys, phospholipids, etc.) |
| P | 2.100 (PARM 94) | 0.200 (PARM 94) | Phosphorous in phosphates |
| Bond Terms | |||
|---|---|---|---|
| k | Equilibrium Value | Training Molecule or Data Source | |
| N3-CG | 355.0 | 1.490 | Methyl ammonium |
| P -OS | 230.0 | 1.610 | PARM 94 |
| P -O2 | 525.0 | 1.480 | PARM 94 |
| CP-OS | 285.0 | 1.460 | CG-OS (GLYCAM06) |
| CG-CP | 310.0 | 1.520 | CG-CG (GLYCAM06) |
| CK-CK, CJ-CJ | 629.0 | 1.337 | Ethene |
| OS-CK, OS-CJ | 350.9 | 1.359 | Methoxyethene |
| CG-CK, CG-CJ | 324.0 | 1.514 | Propene |
| CJ-CK | 350.9 | 1.467 | Butadiene |
| N3-H | 434.0 | 1.010 | PARM94 |
| CG-HP | 360.0 | 1.095 | CG-HC (GLYCAM06) |
| CK-HA, CJ-HA | 360.0 | 1.095 | CG-HC (GLYCAM06) |
| CP-H1 | 340.0 | 1.095 | CG-H1 (GLYCAM06) |
| Angle Terms | |||
|---|---|---|---|
| Term | k | Equilibrium Value | Training molecule or Data Source |
| N3-CG-CG, N3- CG-CP | 67.0 | 111.6 | Ethyl ammonium |
| CG-N3-CG | 54.0 | 111.1 | GLYCAM06 |
| OS-P -OS | 45.0 | 109.6 | PARM94 |
| P -OS-CG, P -OS- CP | 50.0 | 119.0 | Dimethyl phosphate |
| O2-P -OS | 100.0 | 108.2 | PARM94 |
| O2-P -O2 | 140.0 | 119.9 | PARM94 |
| CG-CP-OS, CP- CG-OS | 70.0 | 108.5 | CG-CG-OS (GLYCAM06) |
| CG-OS-CJ, CG-OS-CK | 38.0 | 107.0 | Methoxyethene |
| OS-CJ-CJ, OS- CK-CK | 59.5 | 119.0 | Methoxyethene |
| P -OS-P | 12.8 | 150.0 | Dimethyl diphosphate |
| CJ-CG-CK, CK-CG-CK, CJ-CG-CJ | 46.7 | 111.5 | 1,4-Pentadiene |
| CG-CJ-CG, CG- CK-CG | 46.1 | 115.6 | 2-Methylpropene |
| CK-CJ-CJ, CK- CK-CJ | 49.4 | 127.7 | Butadiene |
| CG-CJ-CJ, CG- CK-CK | 47.9 | 122.5 | Propene |
| CG-CG-CJ, CG- CG-CK | 43.0 | 112.0 | 1-Butene |
| OH-CG-CJ, OH- CG-CK | 70.0 | 107.5 | OH-CG-CG (GLYCAM06) |
| CP-CG-CG | 45.0 | 113.5 | CG-CG-CG (GLYCAM06) |
| N3-CG-HP | 57.0 | 109.6 | Methyl ammonium |
| HP-CG-HP | 40.0 | 109.5 | HC-CG-HC (GLYCAM06) |
| HP-CG-CG, HP- CG-CP | 45.0 | 112.6 | HC-CG-CG (GLYCAM06) |
| CK-CJ-HA, CJ- CK-HA | 32.7 | 126.4 | Butadiene |
| H -N3-CG | 45.5 | 109.2 | Methyl ammonium |
| HA-CJ-HA, HA- CK-HA | 31.3 | 117.4 | Ethylene |
| HA-CJ-CJ, HA- CK-CK | 38.2 | 121.3 | Ethylene |
| H1-CG-CJ, H1- CG-CK | 41.4 | 114.0 | Propene |
| HC-CG-CJ, HC- CG-CK | 41.4 | 114.0 | Propene |
| HA-CJ-CG, HA- CK-CG | 50.0 | 114.0 | Propene |
| H1-CP-CG, H1- CG-CP | 45.0 | 111.0 | H1-CG-CG (GLYCAM06) |
| H1-CP-OS | 60.0 | 110.0 | H1-CG-OS (GLYCAM06) |
| H -N3-H | 35.0 | 109.5 | PARM94 |
| H1-CP-H1 | 45.0 | 109.5 | H1-CG-H1 (GLYCAM06) |
| OS-CJ-HA, OS- CK-HA | 65.1 | 107.5 | Methoxyethene |
| Torsion Terms | |||||||
|---|---|---|---|---|---|---|---|
| Term | V1 | V2 | V3 | Training molecule | Average training error | Test molecule | Average test error |
| CG-N3-CG-CG, CG-N3-CG-CP | 0.10 | −0.20 | 0.10 | Ethylmethylamine | 0.363 | ||
| N3-CG-CG-CG | 0.10 | −0.10 | 0.30 | N-Propylamine | 0.210 | Propyl Ammonium | 0.344 |
| N3-CG-CG-OS, N3-CG-CP-OS | −0.50 | 0.50 | 1.50 | N-(2- Methoxyethyl)amine | 0.437 | 2-Methoxyethyl Ammonium | 0.789 |
| N3-CG-CG-OH | −1.00 | 0.50 | 0.60 | N-(2- Hydroxyethyl)amine | 0.180 | ||
| N3-CG-CG-HC, N3-CG-CG-H1, N3-CG-CP-H1 | 0.0 | 0.0 | 0.10 | Ethyl amine | 0.164 | Ethyl Ammonium | 0.013 |
| HP-CG-N3-CG | 0.0 | 0.0 | 0.25 | Dimethyl Ammonium | 0.223 | ||
| H -N3-CG-HP | 0.0 | 0.0 | 0.13 | Methyl ammonium | 0.013 | ||
| H -N3-CG-CG, H–N3-CG-CP | 0.0 | 0.0 | 0.13 | Ethyl ammonium | 0.013 | ||
| OS-P -OS-CG, OS-P–OS-CP | 0.0 | 0.70 | 0.50 | Dimethyl phosphate | 0.084 | ||
| O2-P -OS-CG, O2-P–OS-CP | 0.10 | −0.50 | 0.10 | Dimethyl phosphate | 0.140 | ||
| CG-CG-OS-P, CG-CP-OS-P | −1.20 | 0.05 | 0.10 | Ethylmethylphosphate | 0.348 | ||
| H1-CG-OS-P, H1-CP-OS-P | 0.07 | Dimethylphosphate | 0.114 | ||||
| CK-CG-CG-N, CJ-CG-CG-N | −0.22 | 0.03 | 0.18 | N-but-3-en-1-yl acetamide | 0.153 | ||
| C -CG-CG-CK, C -CG-CG-CJ | 0.40 | 0.33 | −0.42 | Methyl pent-4-enoate | 0.177 | ||
| OH-CG-CG-CK, OH-CG-CG-CJ | −1.06 | −0.16 | −0.11 | 3-Butenol | 0.161 | Pent-4-en-2-ol | 0.512 |
| CG-OS-CK-CK, CG-OS-CJ-CJ | −0.25 | −3.99 | −0.87 | Methoxyethene | 0.089 | (E)-1-sec-butoxy-2- methyl but-1-ene | 0.604 |
| CG-CG-OS-CK, CG-CG-OS-CJ | 0.22 | −0.42 | −0.01 | Ethoxyethene | 0.289 | (E)-1-sec-butoxy-2- methyl but-1-ene | 0.489 |
| CK-CG-CK-CK, CJ-CG-CK-CK, CK-CG-CJ-CJ, CJ-CG-CJ-CJ | −0.21 | −0.68 | −0.04 | 1,4-Pentadiene | 0.069 | 3-Methyl-1,4- heptadiene | 0.145 |
| CG-CG-CJ-CG, CG-CG-CK-CG | 0.29 | −0.34 | −0.01 | 2-Methyl-1-butene | 0.230 | 2,5-Dimethyl-2,4- heptadiene | 0.640 |
| OH-CG-CK-CK, OH-CG-CJ-CJ | −0.50 | −1.00 | −0.50 | Prop-2-en-1-ol | 0.250 | ||
| CJ-CJ-CK-CK | 0.92 | −1.75 | 0.69 | Butadiene | 0.132 | 2,5-Dimethyl-2,4- heptadiene | 0.652 |
| CG-CG-CG-CK, CG-CG-CG-CJ | 0.0 | 0.0 | 0.0 | 1-Pentene | 0.252 | ||
| CG-CG-CK-CK, CG-CG-CJ-CJ | 0.0 | −0.40 | −0.50 | 1-Butene | 0.093 | ||
| OS-C -CG-CG | 0.0 | 0.0 | 0.20 | Methyl propanoate | 0.057 | Methyl 2- methylpropanoate | 0.140 |
| H1-CG-CG-CK, H1-CG-CG-CJ, HC-CG-CG-CK, HC-CG-CG-CJ | 0.0 | 0.0 | 0.10 | 1-Butene | 0.036 | ||
| CG-OS-CJ-HA, CG-OS-CK-HA | 0.40 | 0.22 | 0.08 | Methoxyethenea | 0.154 | ||
| H1-CG-OS-CJ, H1-CG-OS-CK | 0.0 | 0.0 | 0.10 | Methoxyethene | 0.402 | ||
| CK-CG-CK-HA, CJ-CG-CK-HA, CK-CG-CJ-HA, CJ-CG-CJ-HA | 0.05 | 0.03 | 0.31 | 1,4-Pentadieneb | 0.500 | ||
| HC-CG-CJ-CG, HC-CG-CK-CG | 0.0 | 0.0 | 0.10 | 2-Methyl-1-propene | 0.302 | ||
| HA-CJ-CK-CK, HA-CK-CJ-CJ | 0.69 | 0.40 | 0.17 | Butadiene | 0.183 | ||
| HA-CK-CJ-HA | 0.92 | −1.75 | 0.69 | Butadienec | 0.127 | ||
| HO-OH-CG-CK, HO-OH-CG-CJ | 0.38 | 0.58 | 0.20 | 2-Propenol | 0.120 | ||
| H1-CG-CK-CK, H1-CG-CJ-CJ, HC-CG-CK-CK, HC-CG-CJ-CJ | 0.10 | −0.10 | -0.34 | Propene | 0.032 | ||
| HC-CG-CK-HA, HC-CG-CJ-HA, H1-CG-CK-HA, H1-CG-CJ-HA | 0.0 | 0.0 | 0.0 | Propene | 0.054 | ||
| OH-CG-CK-HA, OH-CG-CJ-HA | 0.0 | 0.0 | 0.0 | Prop-2-en-1-ol | 0.198 | ||
| CG-CG-CK-HA, CG-CG-CJ-HA | 0.0 | 0.0 | 0.0 | 1-Butene | 0.200 | ||
| OS-CJ-CJ-CG, OS-CK-CK-CG | 0.0 | −13.00 | 0.0 | 1-Propenylmethylether | |||
| CK-CJ-CJ-HA, CJ-CK-CK-HA | 0.0 | −15.00 | 0.0 | Butadiene | |||
| OS-CJ-CJ-HA, OS-CK-CK-HA | 0.0 | −20.00 | 0.0 | Methoxyethene | |||
| CJ-CK-CK-CG, CK-CJ-CJ-CG | 0.0 | −3.50 | 0.0 | 1,3-Pentadiene | |||
| CJ-CK-CK-CJ, CK-CJ-CJ-CK | 0.0 | −2.00 | 0.0 | Hexatriene | |||
| CG-CK-CK-CG, CG-CJ-CJ-CG | 0.50 | −15.00 | 0.0 | 2-Butene | |||
| HA-CK-CK-CG, HA-CJ-CJ-CG | 0.0 | −21.00 | 0.0 | Propene | |||
| HA-CK-CK-HA, HA-CJ-CJ-HA | 0.0 | −8.50 | 0.0 | Propene | |||
| HP-CG-CG-OS, HP-CG-CP-OS, H1-CG-CP-OS, H1-CP-CG-OS | 0.0 | 0.0 | 0.05 | HC-CG-CG-OS | (GLYCAM06) | ||
| OS-CP-CG-OS | 0.0 | 0.82 | 0.0 | OS-CG-CG-OS | (GLYCAM06) | ||
| CP-CG-OS-C | 0.47 | 0.0 | -0.04 | CG-CG-OS-C | (GLYCAM06) | ||
| OS-CP-CG-CG, OS-CG-CG-CP | −0.27 | 0.0 | 0.0 | OS-CG-CG-CG | (GLYCAM06) | ||
| CP-CG-OS-CG | 0.0 | 0.0 | 0.16 | CG-OS-CG-CG | (GLYCAM06) | ||
| H1-CG-CP-H1 | 0.0 | 0.0 | 0.17 | H1-CG-CG-H1 | (GLYCAM06) | ||
| H1-CG-CG-CP, H1-CP-CG-CG | 0.0 | 0.0 | 0.15 | H1-CG-CG-CG | (GLYCAM06) | ||
| HP-CG-CG-H1, HP-CG-CP-H1, HP-CG-CG-HC | 0.0 | 0.0 | 0.13 | HC-CG-CG-HC | (GLYCAM06) | ||
| HP-CG-CG-CG | 0.0 | 0.0 | 0.10 | HC-CG-CG-CG | (GLYCAM06) | ||
Coupled to CG-OS-CK-CK/CG-OS-CJ-CJ
Coupled to CK-CG-CK-CK/CK-CG-CJ-CJ/CJ-CG-CK-CK/CJ-CG-CJ-CJ
Coupled to HA-CK-CJ-HA
Partial charges for use in the gas-phase minimisations of the small molecule parameterisation sets were computed by fitting to the molecular electrostatic potential (ESP) computed on a CHELPG [22] grid of points at the B3LYP/cc-pVTZ level, with an ESP restraint (RESP) weight of 0.0005 [23]. Consistent with AMBER [24] and GLYCAM [25], partial charges for the intact biomolecules (lipids), to be employed in condensed-phase simulations, were subsequently derived by ESP-fitting at the HF/6-31G* level. As earlier proposed for use with GLYCAM [26] a RESP weight of 0.01 was employed for the biomolecular charge derivation. In order to address the issue of conformational charge dependence [27], conformationally-averaged RESP charges were computed for each lipid from sixty-three unique lipid conformations extracted from an existing equilibrated DMPC bilayer, freely available from the website of Professor D. P. Tieleman at http://moose.bio.ucalgary.ca/.
Two other MD-equilibrated homogeneous lipid membranes composed of 1-stearoyl-2-docosahexaenoyl-sn-glyerco-3-phosphocholine (SDPC) [28] and palmitoyl oleoyl phosphatidylethanolamine (POPE) [29] were used, along with the DMPC bilayer, to determine the average ensemble charge distribution for functional regions of the lipids. The lipids were divided into a head group region, which was composed of phosphatidycholine or ethanolamine groups and the glycerol sub-unit, and two hydrocarbon tail groups, sn1 and sn2.
2.2 Phospholipid bilayer equilibration and simulation
A lipid bilayer containing 48 DMPC molecules was constructed based on a POPC bilayer model [30], with the bilayer normal aligned along the z-axis. The starting structure had a surface area per DMPC molecule of 78.4 Å2 and a bilayer thickness of 41.9 Å. Using the PTRAJ program in AMBER, a 24 Å layer of TIP3P water molecules (with a 1.4 Å crystal spacing) was added to the upper and lower surfaces of the bilayer, resulting in the addition of 1847 waters (Figure 1). All bilayer equilibration and simulation steps were performed using AMBER 9 [19]. An iterative approach was adopted to equilibrate the bilayer system and achieve properties consistent with the Lα-phase of DMPC. Initially, with the lipids restrained, the water molecules were energy minimised (500 steps of steepest decent, 1500 steps of conjugate gradient) and then subjected to 10 ps of molecular dynamics in the NPT ensemble at 1 atm with anisotropic pressure scaling. The entire system was subsequently energy minimised (500 steps of steepest decent, 500 steps of conjugate gradient). Using the NVT ensemble while restraining the waters, the DMPC molecules were subjected to 5 ps of molecular dynamics at 300 K. The entire system was then minimised again for 1000 steps (500 steps of steepest decent, 500 steps of conjugate gradient). In the NPT ensemble at 1 atm with anisotropic pressure scaling, the bilayer was then restrained and only waters were equilibrated with 10 ps MD at 300 K. Finally, in the NVT ensemble, the entire system was brought to the desired temperature of 300 K over 50 ps. A production MD simulation of the bilayer-water system was then performed for 15 ns at 300 K in the NVT ensemble. A 2 fs time-step was employed throughout for integrating the equations of motion. Hydrogen-containing bonds were constrained with the SHAKE algorithm [31], and long range electrostatics were treated using the Particle Mesh Ewald method [32]. Snapshots were collected at 1 ps intervals for subsequent analysis.
Figure 1.

The DMPC bilayer system pre- and post-equilibration. (A & C) Initial model of the bilayer (pre-equilibration) and (B & D) after the minimisation and heating steps (the starting structure for the 15 ns simulation). To help visualize the bilayer and size of the periodic box the nitrogen (blue spheres) and phosphorous atoms (cyan spheres), and waters (small red spheres) are emphasized. Hydrogen atoms were removed for clarity.
Average bilayer thickness was computed from the distance along the z-axis (bilayer normal) between the centers of mass of the desired atoms in each leaflet, using structures taken at 100 ps intervals. The bilayer thickness (dl) was calculated using the center of mass of the N(CH3)3 moiety in the head group; the hydrophobic thickness (dhc) was calculated using the carbon situated at the branch point of the hydrocarbon tails. To calculate the absolute distance between the termini of the hydrophobic groups (dCH3), the average position of the CH3 groups from both sn1 and sn2 hydrocarbon tails was used.
Molecular graphics images of the bilayer were produced using the UCSF Chimera package from the Resource for Biocomputing, Visualization, and Informatics at the University of California, San Francisco (supported by NIH P41 RR-01081) [33].
3. Results and discussion
3.1 New atom types
The extension of GLYCAM06 to lipids and glycolipids required the introduction of only three lipid-specific carbon atom types. Two of the new atom types (CJ and CK) were introduced to accommodate unsaturated and polyunsaturated hydrocarbon chains and their vdW terms were transferred directly from the unsaturated carbon, CA, atom type in AMBER. Although atom types exist in AMBER to model sp2 carbon atoms, some lipids have alternating single and double bonds, which results in ambiguity regarding the placement of the double bond. To relieve the ambiguity, new atom types, CK and CJ, were added. These atom types allow the definition of a C-C single bond between two adjacent double bonded carbons (CK=CK-CJ=CJ) as in the molecule butadiene, which is a common motif in lipid tails. Notably, by dividing the rotational contribution among the constituent linkages associated with the CK-CJ bond the planarity of the sp2 center was maintained without the need to introduce out-of-plane or improper torsion terms.
The third atom type, CP, was created to describe sp3 carbon atoms attached to the oxygen atom of a phosphate group and its vdW terms were transferred directly from the saturated tetrahedral carbon, CT, atom type in AMBER. The AMBER force field (PARM94– PARM99) contains parameters for this linkage [34], employing the sp3 carbon atom type CT, however, the performance of those parameters in our test cases was not optimal. The current AMBER parameters significantly overestimated the methyl rotational barrier in methylphosphates (see Figure 2M & 2P). While this rotation has little significance for the overall 3D structure directly, it was important to ensure that the H- CH2-O-P rotational contribution was correctly reproduced in order to employ this term in larger structures. It should be noted that unlike AMBER, or earlier versions of GLYCAM, all of the constituent torsion terms are explicitly defined in GLYCAM06. Thus, an error in the H-CH2-O-P contribution would propagate throughout the subsequent lipid components (R-CH2-O-P etc). The vdW terms for the new atom types, as well as for all other atom types employed in this extension of GLYCAM06, were transferred from the standard AMBER values and are presented in Table 1 together with the valence bond lengths, angles, and associated quantum-derived force constants.
Figure 2.

Torsion rotation curves for phosphate and nitrogen (amine and cation) containing species. Those used in the developmental training set are indicated with a “D”, otherwise they represent test cases. Legend: QM B3LYP/6-31++G(2d,2p) data (▲), GLYCAM06 (lipid extension) (●), AMBER PARM94 (○).
3.1.1 Valence Properties
To assess the effect of zwitterionic head group moieties, such as phosphoethanolamine, on bond lengths and angles, a truncated phospholipid was built and energy minimised. This model was selected because of its similarity to phosphatidylcholine, for which experimental crystallographic values [35] were available for comparison (Figure 3). Included in Figure 3 are the pertinent valence geometries for a truncated model of the sphingolipid glucosylceramide, which has also been compared to experimental crystallographic data [36] for the intact glycolipid. The atom types employed in lipids and glycolipids are indicated in Figure 3. The average error in the bond lengths was 0.01 ± 0.01 Å and in the bond angles 1.3 ± 1.1°. It may be observed that the values for the CG-CP and CP-OS bond lengths and CG-OS-CJ and P-OS-CP valence angles deviate somewhat from the experimental data. Alteration of equilibrium bond lengths and angles containing CP terms may be considered after a more thorough survey of relevant structures has been performed.
Figure 3.

GLYCAM06 energy minimized and related crystallographic values for bond lengths and angles in: A) glucosylceramide, experimental data from [36]; B) a representative phospholipid head group, experimental data from [35]. Experimentally determined values are shown in parentheses where available. Bold and italic values come from PDB id 2HG9 [42].
Although the CG-OS-CJ angle was correctly reproduced in the training structure methoxyethene (experimental value: 118.3°, GLYCAM06 value: minimized value 118.3°) [38], it was overestimated by 3.7° in the experimental structure of 1,3-bis(vinyloxy)-2,2-bis(vinyloxymethyl)propane (experimental value: 115.8°) [37]. This discrepancy is notable and may reflect the complex hyperconjugation present in 1,3-bis(vinyloxy)-2,2-bis(vinyloxymethyl)propane.
Several x-ray structures of proteins containing lipids were considered for test structures, including PDB IDs: 1LN1 [39], 1T27 [40], 2A1L [41], 2HG9 [42], 1BP1[43], and 1POB [44]. However, the B-factors for the ligands in these structures were often large (greater than 50 Å2) and direct comparisons with theoretical values may suffer accordingly. For example, several ligands displayed unrealistically large C-OS bond lengths averaging 1.494 Å in all but 2HG9 (1.374 Å in 2HG9 and 1.360 Å in methoxyethene [38]). The best resolved values for the glyceryl and carbonyl portions of the head group are shown in bold and italics in Figure 3 from PDB id 2HG9. B-factors in ligand PC7 ranged from 24.61 Å 2 to 69.48 Å 2. Figure 3 indicates poor agreement with 2HG9 for the angles CG-OS-C and OS-C-CG, however, the average GLYCAM06 values where found to be within the range (112.6–128.1° and 112.6–121.0° respectively) provided by the collection of experimental structures. It should be noted that no hydrogen containing valence terms were tested due to the lack of experimental structures with well-resolved hydrogens.
The torsion terms and partial charges are of profound significance to the 3D geometry and dynamics of biomolecules. The polar character of lipid head groups presents a potential for tight coupling between bond rotational properties and 1–4 electrostatic interactions. This might be expected to be a significant complication, since GLYCAM06 does not employ any 1–4 scaling to dampen such interactions. However, the quality of the fits to the QM torsion data suggests that internal electrostatic scaling is not required. It is noteworthy that a common set of torsion terms could be employed for both neutral and protonated amino groups. For example, when torsion terms were derived for neutral amine functionalities and subsequently applied with protonated ammonium species, the resulting agreement with the QM rotational energy data was reasonable (Figure 2A-L). The average error in the neutral amino training set was 0.20 kcal/mol, while that for the charged ammonium test set was only 0.57 kcal/mol. Errors in the training set were not specifically localised, but were generally distributed over the entire curve. In contrast, a large portion of the test set error was evident primarily at rotational energy barriers. Four phosphate-containing torsion terms were examined, with an average error in the training set of 0.17 kcal/mol (Figure 2M-P).
In order to accommodate a variety of lipid tail groups, the torsion parameterisation focused on combinations of double-bonded carbon terms with adjacent double bonds, ether, alcohol, or amide functionalities. The average error in the fit to the QM torsion curves for the tail group training set was 0.18 kcal/mol (Table 1). Rotational energy curves for GLYCAM06 and QM data are presented in Figure 4. While the overall agreement was generally good (the average error in the test set was 0.51 kcal/mol), modeling rotational energies associated with C(sp2) atoms proved challenging. When both a hydrogen atom and an sp3 carbon atom are attached to an sp2 carbon, the individual contribution from the hydrogen to the rotational energy profile for the C(sp2) –C(sp3) bond is difficult to isolate. For such sequences, both the carbon (CK-CG-CK-CK) and hydrogen (HA-CK-CG-CK) torsion terms were fit concurrently, giving equal priority to adequately reproduce the C(sp2)–C(sp3) rotational energy profile, while maintaining the planarity of sp2 center. This approach resulted in good agreement with the QM data, as seen in the test structure, 3-methyl-1,4-heptadiene, which displayed an average error of only 0.14 kcal/mol (Figure 4H). The C-C single bond rotation in butadiene (CK-CJ) was similarly parameterised using a simultaneous and equally weighted division between the sp2 substituents (coupled fitting), and resulted in good agreement with the QM data. While some deviation was seen between the QM and GLYCAM06 rotational energies for the test structure, 2,5-dimethyl-2,4-heptadiene, the errors were primarily in the high energy eclipsed rotamers. To maintain sp2 planarity and methyl rotamer preferences, parameterisation of the CG-CG-CK-CG sequence present in 2-methylbut-1-ene (Figure 4U) also required coupled fitting with HC-CG-CK-CG term. C=C bonds are common in lipid tails and apolar molecules, such as cholesterol, which is an important component of eukaryotic cell membranes. The C=C torsion parameters for substituted double bonds were all derived using coupled fitting to ensure both reasonable barrier heights and planarity of the sp2 atoms, without the need for improper torsion terms. Torsion parameters for the double bonds are presented in Table 1, while the rotational energy curves are provided in Figure 5.
Figure 4.


Torsion rotation curves for lipid tail groups. Those used in the developmental training set are indicated with a “D”, otherwise they represent test cases. Legend: QM B3LYP/6-31++G(2d,2p) data (▲), GLYCAM06 (lipid extension) (●).
Figure 5.

Torsion rotation curves for C=C double bonds. Those used in the developmental training set are indicated with a “D”, otherwise they represent test cases. Legend: QM B3LYP/6-31++G(2d,2p) data (▲), GLYCAM06 (lipid extension) (●).
Additional errors in the torsions were related to the priority given to accurately fitting dependent torsion terms. For example, in the case of 3-butenol (Figures 4L & 4X), there are two related torsion terms: H1-CG-CG-CK and OH-CG-CG-CK. Correcting the H-containing torsion term (H1-CG-CG-CK) negatively impacted the accuracy of the heavy-atom torsion term (OH-CG-CG-CK); increasing the MM H-containing torsion barrier increased the heavy-atom torsion barrier above the QM barrier. Since accuracy of these related torsion terms was inversely related, the accuracy of the heavy-atom torsion was prioritized.
3.1.2 Partial atomic charges
Charge standardization among similar classes of lipids, i.e. phospholipids, has been examined using the ensemble average charge method [27]. The three lipid systems examined, DMPC, SDPC, and POPE all contain similar phosphate groups and glycerol linkages to the fatty acid tails. The key differences between their head groups are in the presence of positively charged choline, in DMPC and SDPC, or of the ethanolamine found in POPE. The three structures also have different degrees of unsaturation in one of each of their tails, as seen in Figure 6. Charges for these molecules (Figure 6) were divided into the head and tail regions to determine if there was sufficient similarity to facilitate charge standardization among different functional regions of the phospholipids. The average head and tail group charges were similar, within a standard deviation, for each lipid type. The average charge on the phosphate head group was 0.668 a.u., while the charges for the sn1 and sn2 tail groups averaged −0.314 and −0.353 a.u., respectively. Subdividing phospholipids into functional regions and developing independent charge sets for these regions, allowed for the development of lipid bilayers from constitutive fragments with defined charges based on attachment. A similar trend was also observed for the atomic charges of the phosphate, choline, and carbonyl groups.
Figure 6.

Ensemble-averaged RESP charges for A) DMPC, B) SDPC, and C) POPE. Aliphatic protons carry zero net charge in GLYCAM06 [14]. Average charges for the head (PC and PE) and tail (sn1 and sn2) groups are presented with standard deviations.
Two main atomic charge differences emerged from this study related to the head group. The difference in the choline (Figure 6A & 6B) and ethanolamine (Figure 6C) head group charges is apparent as the nitrogen has a moderate negative charge on the ethanolamine while the choline nitrogen has a slight positive charge. This difference was a result of the positive charges fit to the hydrogens in the ethanolamine model, while the same positive charge was distributed over the carbon atoms in the choline models. The standard deviation on the ethanolamine nitrogen, 0.36 a.u., indicates a large degree of charge variability in contrast the nitrogen on the choline models indicates relatively consistent charges with a standard deviation of 0.05 a.u. The other significant atomic charge difference can be seen on the glyceryl carbon connecting to the oxygen atom in the phosphate (Figure 6). The average charge of this carbon atom (over the three molecules) was 0.288 ± 0.06. All other corresponding atoms within the head group were within a standard deviation of each other.
As for the lipid tails, future development will focus on the addition of fatty acid tails with alkyne, aldehyde and ketone functional groups.
3.2 Bilayer simulation
In the initial bilayer configuration the DMPC and water molecules were highly ordered requiring several equilibration stages, consisting of alternating rounds of energy minimisation and MD (described in 2.2). The iterative combination of NPT and NVT ensembles employed during the equilibration steps led to a decrease in the area per DMPC molecule and in the thickness of the membrane, from 78.4 Å2 and 41.9 Å in the initial structure to 67.1 Å 2 and 36.4 Å in the post-equilibration structure (the 0 ns production MD structure). Experimental values for the area per DMPC molecule and the thickness of the membrane, measured for lamellar lattices of DMPC in excess water at 300 K, are 61.7 Å 2 and 35.7 Å, respectively [45]. The iterative approach maintained system integrity while facilitating the equilibration of both lipid and water molecules and permitted the related adjustment in the periodic box size (Figure 1).
A 15 ns NVT simulation of the bilayer was then performed, using the 0 ns equilibrated configuration as a starting structure. The overall bilayer thickness (dl), the hydrophobic thickness (dhc) and the distance between the tail methyl groups from the hydrocarbon tails of the opposing leaflets (dCH3) were monitored over time to assess the stability of the membrane (Figure 7). The extensive pre-equilibration procedure notwithstanding, over the first 1 ns of the 15 ns trajectory further equilibration occurred, indicated by a slight compression of dl and expansion of dCH3. Over the 1–15 ns period, the DMPC molecules formed a fluid, but stable bilayer (Figure 8). The average thickness values over the last 14 ns of simulation were dl = 33.1 ± 0.5 Å, dhc = 23.9 ± 0.2 Å and dCH3 = 19.1 ± 0.2 Å. These values are in good agreement with experimental parameters from lamellar DMPC lattices in excess water which give dl = 35.7 Å and dhc = 22.3 Å (error values were not reported) [45]. Although there is no experimental value for dCH3, it was calculated from the MD simulation in order to monitor fluctuations throughout the membrane. As with the measurements of dl and dhc, there was a short equilibration period during first ns of the simulation, during which dCH3 expanded slightly (Figure 7). Similar to a native state simulation of a protein [46], a portion of the initial production run is considered part of the equilibration phase. When comparing the head group atoms of the 0 ns structure to the other structures in Figure 8, the need for a longer (~1 ns) equilibration period is apparent as the head group atoms are more ordered in the 0 ns structure than the other structures. Once fully equilibrated, the membrane preserved its overall shape and structural characteristics.
Figure 7.
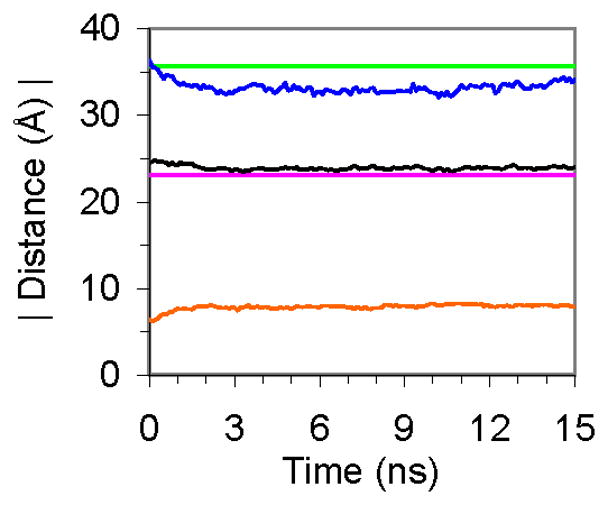
Bilayer thickness parameters calculated from MD simulations compared to experimental spacings. dl MD (
 ), dl exp. (
 ), dhc MD (—), dhc exp. (
 ), dCH3 MD (
 )
)
Figure 8.
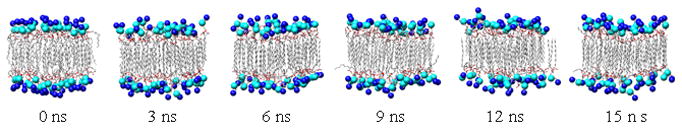
Snapshots from DMPC bilayer simulation. Coloured as in Figure 1.
To demonstrate the overall structural properties of the membrane an atom density profile of the bilayer system was calculated from the 15 ns structure (Figure 9). From the density profile, waters can be seen to penetrate the DMPC head group region (PO4 and N(CH3)3 groups), but not the hydrophobic tail region (CH2 and CH3 groups). To conform to the experimentally determined membrane thickness, the long hydrocarbon tails from opposing leaflets overlapped, yielding a high atomic density in the central region of the bilayer. In addition to the center of the membrane, the head group region displayed a high atomic density, as it was occupied by both lipid and water molecules; a trend observed in other membrane simulations [47–49].
Figure 9.
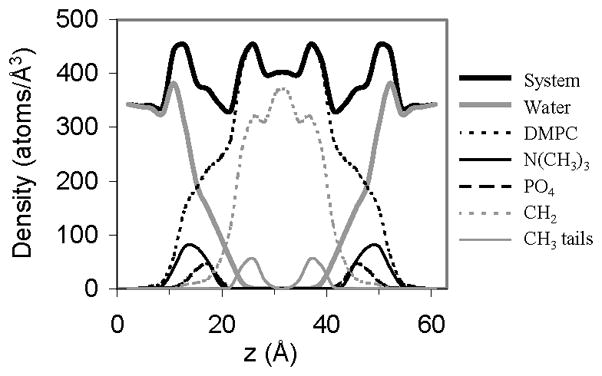
Atom density profiles for selected groups from the 15 ns snapshot of the DMPC bilayer simulation. Values are averaged over both leaflets.
4. Conclusions
A new parameter set for lipid simulations has been developed for use with the GLYCAM06 biomolecular force field. The parameters were designed to reproduce gas-phase QM bond rotational energies and employ ESP partial charges that are consistent with the AMBER protein parameters. The development of standardized charges for phospholipid fragments (polar head groups, and sn1 and sn2 tail groups) will allow for faster charge assignment and the potential for interchanging fatty acid tails. GLYCAM06 parameters were developed to facilitate the combination of a broad range of lipid head and tail moieties, including carbohydrate head groups and saturated or unsaturated hydrocarbon tails. The parameters described above expand GLYCAM06 to include a large variety of lipids including triacylglycerols; sphingolipids including cerebrosides, gangliosides, and sphingomyelin; some steroids including cholesterol; and most glycerophospholipids including those incorporating cholines, ethanolamines, glycerols, inositols, and phosphatidylglycerol (Figure 10). With these parameters it is now possible to simulate heterogeneous lipid bilayers, as well as to examine the properties of glycolipids embedded in membranes. When augmented by the AMBER parameters for proteins, it is also possible, in principle, to study protein-membrane complexes. A preliminary 15 ns NVT MD simulation of a DMPC bilayer, using the presented GLYCAM06 parameters, was in good agreement with experimental data. While achieving equilibration of lipid bilayers for MD simulations can be challenging, modification of the pressure scaling options in AMBER would facilitate this process. However, the GLYCAM06 parameters are self-contained and may be employed in a variety of software packages. The parameters and relevant structure files are available from the GLYCAM website (www.glycam.com).
Figure 10.

Examples of lipid structures accommodated in the extended GLYCAM06 parameters: A) Phosphatidylethanolamine, B) Phosphatidylglycerol, C) Phosphatidyl-choline, D) Phosphatidylinositol, E) Dipbosphatidylglycerol, F) Sphingosine, G) Glucosylceramide, H) Cholesterol.
Acknowledgments
The authors thank the National Institutes of Health (RR05357 and GM55230) for funding.
References
- 1.Spector AA, Yorek MA. Membrane Lipid-Composition and Cellular Function. Journal of Lipid Research. 1985;26:1015–1035. [PubMed] [Google Scholar]
- 2.Hakomori S. Structure, organization, and function of glycosphingolipids in membrane. Current Opinion in Hematology. 2003;10:16–24. doi: 10.1097/00062752-200301000-00004. [DOI] [PubMed] [Google Scholar]
- 3.Evans SV, Mackenzie CR. Characterization of Protein-Glycolipid Recognition at the Membrane Bilayer. J Mol Recognit. 1999;12:155–168. doi: 10.1002/(SICI)1099-1352(199905/06)12:3<155::AID-JMR456>3.0.CO;2-S. [DOI] [PubMed] [Google Scholar]
- 4.Nagle JF, Tristram-Nagle S. Structure of Lipid Bilayers. Biochim Biophys Acta. 2000;1469:159–195. doi: 10.1016/s0304-4157(00)00016-2. [DOI] [PMC free article] [PubMed] [Google Scholar]
- 5.Hare BJ, Howard KP, Prestegard JH. Torsion Angle Analysis of Glycolipid Order at Membrane Surfaces. Biophysical Journal. 1993;64:392–398. doi: 10.1016/S0006-3495(93)81380-8. [DOI] [PMC free article] [PubMed] [Google Scholar]
- 6.Kishore AI, Prestegard JH. Molecular Orientation and Conformation of Phospatidylinositides in Membrane Mimetics Using Variable Angle Sample Spinning (VASS) NMR. Biophys J. 2003;85:3848–3857. doi: 10.1016/S0006-3495(03)74799-7. [DOI] [PMC free article] [PubMed] [Google Scholar]
- 7.Tieleman DP, Marrink SJ, Berendsen HJ. A computer perspective of membranes: molecular dynamics studies of lipid bilayer systems. Biochim Biophys Acta. 1997;1331:235–70. doi: 10.1016/s0304-4157(97)00008-7. [DOI] [PubMed] [Google Scholar]
- 8.Lague P, Roux B, Pastor RW. Molecular Dynamics Simulations of the Influenza Hemagglutinin Fusion Peptide in Micelles and Bilayers: Conformational Analysis of Peptide and Lipids. Journal of Molecular Biology. 2005;354:1129–1141. doi: 10.1016/j.jmb.2005.10.038. [DOI] [PubMed] [Google Scholar]
- 9.Noskov SY, Roux B. Importance of Hydration and Dynamics on the Selectivity of the KcsA and NaK Channels. 2007 doi: 10.1085/jgp.200609633. p.jgp.200609633. [DOI] [PMC free article] [PubMed] [Google Scholar]
- 10.La Rocca P, Biggin PC, Tieleman DP, Sansom MSP. Simulation studies of the interaction of antimicrobial peptides and lipid bilayers. Biochimica et Biophysica Acta (BBA) - Biomembranes. 1999;1462:185–200. doi: 10.1016/s0005-2736(99)00206-0. [DOI] [PubMed] [Google Scholar]
- 11.de Groot BL, Grubmuller H. Water Permeation Across Biological Membranes: Mechanism and Dynamics of Aquaporin-1 and GlpF. 2001:2353–2357. doi: 10.1126/science.1066115. [DOI] [PubMed] [Google Scholar]
- 12.Zhu F, Tajkhorshid E, Schulten K. Molecular dynamics study of aquaporin-1 water channel in a lipid bilayer. FEBS Letters. 2001;504:212–218. doi: 10.1016/s0014-5793(01)02749-1. [DOI] [PubMed] [Google Scholar]
- 13.Edidin M. The state of lipid rafts: from model membranes to cells. Annu Rev Biophys Biomol Struct. 2003;32:257–83. doi: 10.1146/annurev.biophys.32.110601.142439. [DOI] [PubMed] [Google Scholar]
- 14.Kirschner KN, Yongye AB, Tschampel SM, Daniels CR, Foley BL, Woods RJ. GLYCAM06: A Generalizable Biomolecular Force Field. Carbohydrates. J Comput Chem. 2007 doi: 10.1002/jcc.20820. In Press. [DOI] [PMC free article] [PubMed] [Google Scholar]
- 15.Kirschner KN, Woods RJ. Quantum Mechanical Study of the Nonbonded Forces in Water-Methanol Complexes. J Phys Chem, A. 2001;105:4150–4155. doi: 10.1021/jp004413y. [DOI] [PMC free article] [PubMed] [Google Scholar]
- 16.Frisch MJ, Trucks GW, Schlegel HB, Scuseria GE, Robb MA, Cheeseman JR, Zakrzewski VG, Montgomery JA, Stratmann RE, Burant JCDS, Millam JM, Daniels AD, Kudin KN, Strain MC, Farkas O, Tomasi J, Barone V, Cossi M, Cammi R, Mennucci B, Pomelli CS, Adamo C, Clifford S, Ochterski J, Petersson GA, Ayala PY, Cui Q, Morokuma K, Malick DK, Rabuck AD, Raghavachari K, Foresman BG, Al-Laham MA, Cioslowski J, Ortiz JV, Stefanov B, Liu G, Liashenko A, Piskorz P, Komaromi I, Gomperts R, Martin RL, Fox DJ, Keith T, Al-Laham MA, Peng CY, Nanayakkara A, Gonzalez C, Challacombe M, Gill PMW, Johnson BG, Chen W, Wong MW, Andres JL, Head-Gordon M, Replogle ES, Pople JA. Gaussian 98. Gaussian, Inc; Pittsburg: 1998. [Google Scholar]
- 17.Case DA, Darden TA, Cheatham TE, III, Simmerling CL, Wang J, Duke RE, Luo R, Merz KM, Wang B, Pearlman DA, Crowley M, Brozell S, Tsui V, Gohlke H, Mongan J, Hornak V, Cui G, Beroza P, Schafmeister C, Caldwell JW, Ross WS, Kollman PA. AMBER 8. University of California; San Francisco: 2004. [Google Scholar]
- 18.Kirschner KN, Woods RJ. Solvent Interactions Determine Carbohydrate Conformation. Proc Natl Acad Sci USA. 2001;98:10541–10545. doi: 10.1073/pnas.191362798. [DOI] [PMC free article] [PubMed] [Google Scholar]
- 19.Case DA, Cheatham TE, III, Darden TA, Gohlke H, Luo R, Merz KM, Onufriev A, Simmerling CL, Wang B, Woods RJ. The AMBER Biomolecular Simulation Programs. J Comput Chem. 2005;26:1668–1688. doi: 10.1002/jcc.20290. [DOI] [PMC free article] [PubMed] [Google Scholar]
- 20.Allen FH. The Cambridge Structural Database: a quarter of a million crystal structures and rising. Acta Crystallogr. 2002;B58:380–388. doi: 10.1107/s0108768102003890. [DOI] [PubMed] [Google Scholar]
- 21.Bruno IJ, Cole JC, Edgington PR, Kessler M, Macrae CF, McCabe P, Pearson J, Taylor R. New software for searching the Cambridge Structural Database and visualizing crystal structures. Acta Crystallogr. 2002;B58:389–397. doi: 10.1107/s0108768102003324. [DOI] [PubMed] [Google Scholar]
- 22.Breneman CM, Wiberg KB. Determining Atom-Centered Monopoles from Molecular Electrostatic Potentials. The Need for High Sampling Density in Formamide Conformational Analysis. J Comput Chem. 1990;11:361–373. [Google Scholar]
- 23.Cieplak P, Caldwell JW, Kollman PA. Molecular Mechanical Models for Organic and Biological Systems Going Beyond the Atom Centered Two Body Additive Approximation: Aqueous Solution Free Energies of Methanol and N-Methyl Acetamide, Nucleic Acid Base, and Amide Hydrogen Bonding and Chloroform/Water Partition Coefficients of the Nucleic Acid Bases. J Comp Chem. 2001;22:1048–1057. [Google Scholar]
- 24.Cornell WD, Cieplak P, Bayly CI, Kollman PA. Application of RESP Charges to Calculate Conformational Energies, Hydrogen Bond Energies, and Free Energies of Solvation. J Am Chem Soc. 1993;115:9620–9631. [Google Scholar]
- 25.Woods RJ, Dwek RA, Edge CJ, Fraser-Reid B. Molecular Mechanical and Molecular Dynamical Simulations of Glycoproteins and Oligosaccharides. 1. GLYCAM_93 Parameter Development. J Phys Chem. 1995;99:3832–3846. [Google Scholar]
- 26.Woods RJ, Chappelle R. Restrained Electrostatic Potential Atomic Charges for Condensed Phase Simulations of Carbohydrates. J Mol Struct (Theochem) 2000;527:149–156. doi: 10.1016/S0166-1280(00)00487-5. [DOI] [PMC free article] [PubMed] [Google Scholar]
- 27.Basma M, Sundara S, Calgan D, Vernali T, Woods RJ. Solvated Ensemble Averaging in the Calculation of Partial Atomic Charges. J Comput Chem. 2001;22:1125–1137. doi: 10.1002/jcc.1072. [DOI] [PMC free article] [PubMed] [Google Scholar]
- 28.Feller SE, Gawrisch K, Mackerell ADJ. Polyunsaturated Fatty Acids in Lipid Bilayers: Intrinsic and Environmental Contributions to Their Unique Physical Properties. J Am Chem Soc. 2002;124:318–326. doi: 10.1021/ja0118340. [DOI] [PubMed] [Google Scholar]
- 29.Humphrey W, Dalke A, Schulten K. VMD - Visual Molecular Dynamics. J Molec Graphics. 1996;14:33–38. doi: 10.1016/0263-7855(96)00018-5. [DOI] [PubMed] [Google Scholar]
- 30.Heller H, Schaefer M, Schulten K. Molecular dynamics simulation of a bilayer of 200 lipids in the gel and in the liquid crystal phase. 1993;97:8343–8360. [Google Scholar]
- 31.Ryckaert J-P, Ciccotti G, Berendsen HJ. Numerical Integration of the Cartesian Equations of Motion of a System with Constraints: Molecular Dynamics of n-Alkanes. J Comput Phys. 1977;23:327–341. [Google Scholar]
- 32.Darden TA, York D, Pedersen L. Particle Mesh Ewald: An N Log(N) Method for Ewald Sums in Large Systems. J Chem Phys. 1993;98:10089. [Google Scholar]
- 33.Pettersen EF, Goddard TD, Huang CC, Couch GS, Greenblatt DM, Meng EC, Ferrin TE. UCSF Chimera - A Visualization System for Exploratory Research and Analysis. J Comput Chem. 2004;25:1605–1612. doi: 10.1002/jcc.20084. [DOI] [PubMed] [Google Scholar]
- 34.Weiner SJ, Kollman PA, Nguyen DT, Case DA. An All Atom Force Field for Simulations of Proteins and Nucleic Acids. J Comput Chem. 1986;7:230–252. doi: 10.1002/jcc.540070216. [DOI] [PubMed] [Google Scholar]
- 35.Pascher I, Sundell S, Eibl H, Harlos K. The single crystal structure of octadecyl-2-methyl-glycero-phosphocholine monohydrate. A multilamellar structure with interdigitating head groups and hydrocarbon chains. Chemistry and Physics of Lipids. 1986;39:53–64. [Google Scholar]
- 36.Gadola SD, Zaccai NR, Harlos K, Shepherd D, Castro-Palomino JC, Ritter G, Schmidt RR, Jones EY, Cerundolo V. Structure of human CD1b with bound ligands at 2.3 Å, a maze for alkyl chains. Nature Immunology. 2002;3:721–726. doi: 10.1038/ni821. [DOI] [PubMed] [Google Scholar]
- 37.Irngartinger H, Herpich R, Huber-Patz U, Trofimov BA, Malysheva SF. CSD id IPUMAH. Organisch-Chemisches Institut der Universitat; Heidelberg, Germany: 2003. [Google Scholar]
- 38.Samdal S, Seip HM. Potential for Rotation About C(sp*)-O and C(sp*)-S Bonds: Electron Diffraction Results for CH2=CH-OCH3 and CH2=CH-SCH3 and AB Initio Calculations ON CH,=CH-OH and CH,XH-SH. J Molecular Structure. 1975;28:193–203. [Google Scholar]
- 39.Roderick SL, Chan WW, Agate DS, Olsen LR, Vetting MW, Rajashankar KR, Cohen DE. Structure of human phosphatidylcholine transfer protein in complex with its ligand. Nat Struct Biol. 2002;9:507–511. doi: 10.1038/nsb812. [DOI] [PubMed] [Google Scholar]
- 40.Yoder MD, Thomas LM, Tremblay JM, Oliver RL, Yarbrough LR, Helmkamp GM., Jr Structure of a multifunctional protein. Mammalian phosphatidylinositol transfer protein complexed with phosphatidylcholine. J Biol Chem. 2001;276:9246–9252. doi: 10.1074/jbc.M010131200. [DOI] [PubMed] [Google Scholar]
- 41.Vordtriede PB, Doan CN, Tremblay JM, Helmkamp GM, Yoder MD. Structure of PITPbeta in complex with phosphatidylcholine: Comparison of structure and lipid transfer to other PITP isoforms. Biochemistry. 2005;44:14760–14771. doi: 10.1021/bi051191r. [DOI] [PubMed] [Google Scholar]
- 42.Roszak AW, Gardiner AT, Isaacs NW, Cogdell RJ. Brominated lipids identify lipid binding sites on the surface of the reaction center from Rhodobacter sphaeroides. Biochemistry. 2007;46:2909–2916. doi: 10.1021/bi062154i. [DOI] [PubMed] [Google Scholar]
- 43.Beamer LJ, Carroll SF, Eisenberg D. Crystal Structure of Human BPI and Two Bound Phospholipids at 2.4 Angstrom Resolution. Science. 1997;276:1862–1864. doi: 10.1126/science.276.5320.1861. [DOI] [PubMed] [Google Scholar]
- 44.White SP, Scott DL, Otwinowski Z, Gelb MH, Sigler PB. Crystal structure of cobra-venom phospholipase A2 in a complex with a transition-state analogue. Science. 1990;250:1560–1563. doi: 10.1126/science.2274787. [DOI] [PubMed] [Google Scholar]
- 45.Rand RP, Parsegian VA. Hydration forces between phospholipid bilayers. Biochimica et Biophysica Acta. 1989;988:351–376. [Google Scholar]
- 46.DeMarco ML, Alonso DOV, Daggett V. Diffusing and Colliding: The Atomic Level Folding/Unfolding Pathway of a Small Helical Protein. Journal of Molecular Biology. 2004;341:1109–1124. doi: 10.1016/j.jmb.2004.06.074. [DOI] [PubMed] [Google Scholar]
- 47.Tieleman DP, Berendsen HJC. Molecular dynamics simulations of a fully hydrated dipalmitoylphosphatidylcholine bilayer with different macroscopic boundary conditions and parameters. The Journal of Chemical Physics. 1996;105:4871–4880. [Google Scholar]
- 48.Bassolino-Klimas D, Alper HE, Stouch TR. Mechanism of Solute Diffusion through Lipid Bilayer Membranes by Molecular Dynamics Simulation. J Am Chem Soc. 1995;117:4118–4129. [Google Scholar]
- 49.Marrink SJ, Sok RM, Berendsen HJC. Free volume properties of a simulated lipid membrane. The Journal of Chemical Physics. 1996;104:9090–9099. [Google Scholar]