

Abstract
The Prevotella ruminicola 23 genome encodes three different glutamine synthetase (GS) enzymes: glutamine synthetase I (GSI) (ORF02151), GSIII-1 (ORF01459), and GSIII-2 (ORF02034). GSI, GSIII-1, and GSIII-2 have each been heterologously expressed in and purified from Escherichia coli. The subunit molecular mass of GSI was 56 kDa, while GSIII-1 and GSIII-2 were both 83 kDa. Optimal conditions for γ-glutamyl transferase activity were found to be 35°C at pH 5.6 with 0.25 mM Mn2+ ions (GSI) or 37°C at pH 6.0 (GSIII-1 and GSIII-2) with 0.50 to 1.00 mM Mn2+ ions. GSIII biosynthetic activity was found to be optimal at 50 to 60°C and pH 6.8 to 7.0 with 10 mM Mn2+ ions, while GSI displayed no GS biosynthetic activity. Kinetic analysis revealed Km values for glutamate and ammonium as well as for hydrolysis of ATP to be 8.58, 0.48, and 1.91 mM, respectively, for GSIII-1 and 1.72, 0.43, and 2.65 mM, respectively, for GSIII-2. A quantitative reverse transcriptase PCR assay (qRT-PCR) revealed GSIII-2 to be significantly induced by high concentrations of ammonia, and this corresponded with increases in measured GS activity. Collectively, these results show that both GSIII enzymes in P. ruminicola 23 are functional and indicate that GSIII-2, flanked by GOGAT (gltB and gltD genes), plays an important role in the acquisition and metabolism of ammonia, particularly under nonlimiting ammonia growth conditions.
INTRODUCTION
Prevotella ruminicola is one of the most commonly isolated species from the rumen (7, 42) and cecum (36) of pigs. P. ruminicola is metabolically versatile and ferments a wide variety of sugars. Fermentation of starch, dextrin, pectin, and xylan are also common traits for most strains (13, 14). Besides contributing significantly to degradation of plant polysaccharides, P. ruminicola is one of the main proteolytic species in the rumen and can hydrolyze a variety of proteins and peptides (24, 38, 45). Prevotella ruminicola preferentially utilizes ammonia as a nitrogen source, but little is known about ammonia assimilation and its regulation within these bacteria.
Glutamine synthetase (GS) plays a particularly important role in nitrogen metabolism and is the principal source of N for protein and nucleic acid synthesis. GS catalyzes the formation of glutamine from glutamate and ammonia in an energy-dependent reaction followed by conversion of glutamine to glutamate by glutamate synthase (GOGAT) when cells are ammonia limited (18, 31). In enteric bacteria that have been extensively studied, such as Escherichia coli and salmonellae, GS is usually most active under ammonia-limiting growth conditions (5, 17). In these organisms, GS activity is ATP dependent and is highly regulated by changes in ammonia concentration and inhibited by the cumulative feedback of alanine, glycine, serine, AMP, carbamoyl phosphate, CTP, glucosamine-6-phosphate, histidine, and tryptophan (16). GS enzymes are divided into three families based on the different molecular masses of their subunits and structure (GSI, GSII, and GSIII). GSI, encoded by glnA, is a dodecameric enzyme composed of identical subunits (Mr, ca. 55,000) and is found exclusively in bacteria and archaea (6, 47). The regulation and structure of typical GSI in enterobacteria have been well studied (1, 16, 29). GSII, encoded by glnII, is commonly isolated from plant symbiotic bacteria such as Rhizobium japonicum, Frankia sp., Agrobacterium, and Streptomyces hygroscopicus (8, 12, 19, 28, 37). GSII is an octameric enzyme with identical subunits (Mr, ca. 36,000). Sequence analysis of GSII shows that it is highly homologous to eukaryotic GS, and this GSII represents lateral gene transfer from plants to bacteria (8). GSIII was first described in Bacteroides fragilis (25) and also assembles as a homododecamer, comprising larger subunits (Mr, ca. 75,000) than those of GSI or GSII (2, 40, 44). GSIII have been identified in Butyrivibrio fibrisolvens, Ruminococcus albus 8, and some cyanobacteria (2, 11, 22, 35). Five conserved regions have been identified from GSI, GSII, and GSIII proteins. Additionally, four typical conserved regions have been identified in GSIII proteins (11). Recently, the first crystal structure of a GSIII enzyme, from B. fragilis, has been presented (44).
Interestingly, as more genomes are being sequenced, it is clear that many organisms possess multiple enzymes of each type. Based on bioinformatic analysis, three genes encoding glutamine synthetase (one GSI with an Mr of ca. 56,000 and two GSIII enzymes with Mrs of ca. 83,000) were identified in the genome of P. ruminicola 23. Here we describe the biochemical characterization and transcriptional expression of all three glutamine synthetases and interpret their roles in ammonia assimilation and nitrogen metabolism. Ammonia nitrogen exists in aqueous solution as either NH4+ or NH3 depending on pH, with a pKa of 9.25 (25°C). Thus, at ruminal pH and under buffer conditions for optimal activity, the bulk of ammonia is in the ionized form (NH4+) and in this paper we simply use the term ammonia for the sum of ionized and un-ionized forms unless specified.
MATERIALS AND METHODS
Organism and culture conditions.
Prevotella ruminicola strain 23 was kindly provided by M. A. Cotta, USDA-ARS, Peoria, IL, and stored on maintenance slants in the vapor phase of liquid nitrogen in our laboratory culture collection. The bacterial cultures were grown anaerobically at 37°C in the modified medium 2 of Hobson (26) containing 30% rumen fluid and 0.2% glucose, 0.2% cellobiose, and 0.2% maltose under CO2:H2 (95:5, vol/vol) gas phase. This maintenance medium contains 6.8 mM (NH4)2SO4.
Continuous culture.
Continuous culture of P. ruminicola 23 was carried out with glucose (5 g/liter) and nitrogen-free defined medium (33) with the addition of 10 mM (NH4)2SO4 to provide excess-ammonia growth conditions or 0.7 mM (NH4)2SO4 to provide ammonia-limiting conditions. Residual ammonia concentrations in effluent were 3.66 mM and 0.025 mM, respectively. Continuous cultivation was conducted using a Biostat B fermentor (B. Braun Biotech Inc., Allentown, PA) with a 1-liter working volume. The continuous culture was maintained at 38.7°C ± 0.4°C and pH 6.7 ± 0.01. The culture was constantly agitated using a turbine impeller at 300 rpm. Anaerobicity was maintained with a continuous flow of O2-free CO2, which passed through a sterilized 0.22-μm-pore-size inline air filter. Growth was initiated by growth in batch culture for 12 h with 10 mM (NH4)2SO4 added. After batch growth to a high optical density (OD), continuous culture was initiated using a dilution rate of 0.17 h−1. After steady-state conditions were obtained, independent samples were taken in triplicate from both excess ammonia and limiting ammonia growth conditions at 24-h intervals, allowing a 4-volume (94%) turnover of medium between each sampling.
Genomic DNA isolation.
Genomic DNA was isolated from an overnight culture of P. ruminicola 23 using a previously described method (46). The genomic DNA was stored at −20°C. The concentration of the DNA was determined by NanoDrop (NanoDrop Technologies, Wilmington, DE).
PCR amplification.
Primers were designed to include a 5′ NdeI site in the forward primers and a 5′ XhoI (GSI & GSIII-2) or BsaBI (GSIII-1) site in the reverse primers (listed in Table 1). These primers were used to amplify the GSI, GSIII-1, and GSIII-2 genes from genomic DNA isolated from P. ruminicola 23. PCR amplification was performed with the PFU DNA polymerase (Takara Bio Inc., Madison, WI) according to the manufacturer's instructions. Samples were amplified using the following program: hot start at 94°C for 2 min, preheating at 94°C for 30 s, 30 cycles for denaturation at 94°C for 10 s, annealing temperature of 55°C for 30 s, extension at 72°C for 45 s, and final extension at 72°C for 7 min for GSI and preheating at 94°C for 30 s, 30 cycles for denaturation at 94°C for 10 s, annealing temperature of 55°C for 30 s, extension at 72°C for 65 s, and final extension at 72°C for 7 min for GSIII-1 and -2. The purity and integrity of the amplified products were determined by visual inspection following separation on a 1% agarose gel. The amplified GSI, GSIII-1, and GSIII-2 were gel purified and isolated using the gel extraction kit (Qiagen).
Table 1.
Primers used for cloning and qRT-PCR
| Primer | Sequence |
|---|---|
| Cloning | |
| GSI-F | 5′-catATGAACAACGACAAGCTGATGTTGAAT-3′ |
| GSI-R | 5′-ctcgagTCAGCCACAATGGAAGTACTTGGT-3′ |
| GSIII-1 F | 5′-catATGTCAAATCAACTTAGATTCCAGGTT-3′ |
| GSIII-1 R | 5′-gatttTTATCTGATAAACAACAACTCACGG-3′ |
| GSIII-2 F | 5′-catATGGAAGCATTAAGATTTCAGGTTGTC-3′ |
| GSIII-2 R | 5′-ctcgagTTATCGGATGAACAGCAGTTCTCT-3′ |
| qRT-PCR | |
| PrGSI-F | 5′-AGGCGCCCACTAATGTTTGT-3′ |
| PrGSI-R | 5′-TTCGCAGCATGACACATATCC-3′ |
| PrGSIII-1F | 5′-CACATCGCCATTTGCCTTTA-3′ |
| PrGSIII-1R | 5′-CACAGCCGAGTTAAGTGCAATC-3′ |
| PrGSIII-2F | 5′-CGGATGGGAACAGGAGTACTTC-3′ |
| PrGSIII-2R | 5′-GGCACTATCGTGTCCCATCAG-3′ |
| atpD-F | 5′-TGGGTATCTATCCCGCTGTTG-3′ |
| atpD-R | 5′-TTGACACGCTGGGCACAAT-3′ |
| infB-F | 5′-TCAGAGCTGGCCACCATGA-3′ |
| infB-R | 5′-CAGCATCCAGACGCTGGTT-3′ |
| rpoB-F | 5′-GAAGACCTTGCTGAGTGGACTGA-3′ |
| rpoB-R | 5′-TAGCAGGCTGGTCGAAACG-3′ |
The purified genes were cloned into pGEM-T cloning vectors (pGEM-T Easy Vector System I; Promega, WI). The clones with DNA inserts were identified by colony PCR using primers pUC/M13-F and pUC/M13-R (W. M. Keck Center for Comparative and Functional Genomics at the University of Illinois at Urbana-Champaign) and purified using a QIA spin miniprep kit (Qiagen). The GS genes in purified plasmid DNAs were excised from the pGEM-T vectors using NdeI and XhoI (or BsaBI for GSIII-1) restriction enzymes and ligated into a modified pET28a expression vector.
Protein purification.
Epicurian E. coli BL21 CodonPlus (DE3) RIL competent cells (Stratagene, La Jolla, CA) were transformed using 100 ng of plasmid DNA by heat shock at 42°C for 30 s. The cells were then spread on LB plates, with ampicillin (100 μg/ml) and chloramphenicol (50 μg/ml) for GSI and GSIII-2 and chloramphenicol (50 μg/ml) and kanamycin (30 μg/ml) for GSIII-1, and incubated overnight at 37°C. Since the competent cells carry the gene resistant to chloramphenicol, a single colony was picked and incubated in 500 μl LB medium supplemented with ampicillin and chloramphenicol, or chloramphenicol and kanamycin, using the same concentrations as mentioned before. The cells were cultured at 37°C on a rotary shaker until an OD600 of 0.3 was reached, at which time isopropyl-β-d-thiogalactopyranoside (IPTG) was added at 1 mM to induce gene expression and protein production. The cells were then further incubated for 16 h at 16°C on a rotary shaker. The cells were harvested and then resuspended in lysis buffer (50 mM Na phosphate, pH 7.0, and 300 mM NaCl), and lysed using a French pressure cell (American Instrument Co., Silver Spring, MD). The cell debris was removed by centrifugation. The histidine-tagged recombinant protein was purified using a cobalt-charged affinity resin and eluted into an elution buffer comprising 50 mM Na phosphate, pH 7.0, 300 mM NaCl, and 150 mM imidazole. The GS fractions were then dialyzed against buffer A (50 mM Tris, pH 8.0, 50 mM NaCl, 0.1 mM EDTA, 0.5 mM dithiothreitol [DTT], and 10% glycerol), as previously described (2).
Cytoplasmic proteins for analysis of GS activity from continuous culture were isolated as previously described (15). The cells were harvested by centrifugation, washed, and disrupted by sonication. Briefly, cells were resuspended in 10 ml of lysis buffer (20 mM Tris-HCl, 1 mM DTT, and 1 mM phenylmethylsulfonyl fluoride [PMSF]) and sonicated on ice in three cycles of 30 s at 80 W using a VC130PB (Sonics & Materials Inc., Newtown, CT). Unbroken cells and cell debris were removed by centrifugation at 12,000 × g for 5 min at 4°C. Supernatants were then ultracentrifuged in a fixed angle rotor at 105,000 × g at 4°C, giving a membrane-free cytoplasmic protein fraction.
Size exclusion chromatography.
The purified GSI, GSIII-1, and GSIII-2 proteins were dialyzed against a buffer composed of 50 mM Na phosphate (pH 7.0) and 150 mM NaCl and injected into a Superose 12 HR 10/30 gel filtration column (Amersham Biosciences, Piscataway, NJ) already equilibrated with the same buffer at a flow rate of 0.4 ml/min. Fractions were collected with an automated fraction collector, and aliquots were analyzed by SDS-PAGE.
Enzymatic characterization of the GS proteins.
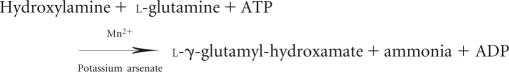
Enzyme characterization was carried out by the γ-transferase (3) and biosynthetic assays (9, 20, 21) as previously described. The γ-transferase assay is used to measure the total amount of GS present. The assay mixture and glutamine solutions were prepared immediately prior to use to avoid the breakdown and release of ammonia in the growth media. The assay mixture contained 135 mM imidazole-HCl (pH 6.0), 18 mM hydroxylamine-HCl, 25 mM K-arsenate, 1 mM MnCl2, 0.36 mM Na-ADP, and 10 μg GSI, GSIII-1, or GSIII-2. The mixture was equilibrated at 37°C for 5 min, and the reaction was initiated by adding 50 μl of 200 mM l-glutamine (final concentration of 20 mM), giving a final assay volume of 500 μl. The reaction was stopped following a 10-min incubation with 1 ml of stop mix (5.5% FeCl3 · 6H2O [wt/vol], 2% trichloroacetic acid [wt/vol], and 2.1% concentrated HCl) and then centrifuged for 5 min at 10,000 × g to remove precipitates. The product (formation of γ-glutamyl-hydroxamate) was measured spectrophotometrically by absorbance at 540 nm where 1 μmol of γ-glutamyl-hydroxamate had an absorbance of 0.278. A reaction mixture without GS enzyme served as the blank. The reaction is shown as follows.
 |
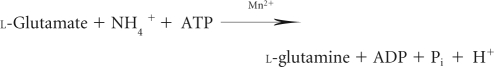
The assay mixture for the biosynthetic reaction (measures the ability of the GS to form glutamine through the Pi released from ATP) consisted of 100 mM MOPS (morpholinepropanesulfonic acid) (pH 7.5), 50 mM MgCl2 · 6H2O, 250 mM l-glutamate, and 50 mM NH4Cl to which approximately 10 μg of GSI, GSIII-1, or GSIII-2 was added. The 90 μl of mixture was equilibrated at 37°C for 5 min, and the reaction was initiated by adding 10 μl of 0.1 M ATP (final concentration of 10 mM) in a total volume of 100 μl. The 25 μl of reaction was transferred after 5 min to a microtiter plate, and 75 μl of solution D [2:1 mixture of 12% l-ascorbic acids in 1 N HCl and 2% (NH4)2MoO4 · 4H2O] was added. The reaction was stopped after 5 min of incubation by the addition of 75 μl of stop color development solution F (2% sodium citrate tribasic dihydrate, 2% acetic acid, and 2% sodium arsenite). The solution was then incubated for 15 min at 37°C to enable the color to fully develop. The inorganic phosphate product was measured spectrophotometrically at 850 nm as for the biosynthetic assay. GS specific activity is expressed as nmol Pi/μg/min. The reaction is shown as follows.
 |
Kinetic characterization.
The concentration of the substrate for which the affinity was to be calculated was changed while maintaining the concentration of the other substrates in excess. Km was determined by γ-transferase, varying the concentration of glutamine from 1.0 to 40 mM, that of ADP from 0.1 to 2.0 mM, and that of hydroxylamine-HCl from 0.5 to 20 mM. Km was also analyzed for all the three substrates, glutamate, ATP, and ammonia by biosynthetic assay. Glutamate from 0.5 to 300 mM, ATP from 0.1 to 20 mM, and ammonia from 0.5 to 25 mM were used. A double reciprocal Lineweaver-Burk plot was applied to calculate the Km values for the reactions.
ATPase activity.
ATP hydrolysis was assayed using 10 μM nonradioactive ATP and 170 nM [γ-32P]ATP. The mixture was equilibrated at 37°C for 5 min, and then the reaction was initiated by the addition of 0.5, 1, and 2.0 μg GSI or 25, 50, and 100 ng GSIII-1 or GSIII-2 protein, respectively. The reaction mixture was incubated at 37°C for 10 min, and then the reaction was terminated by the addition of 2 μl of 0.5 M EDTA (pH 7.5). An aliquot (1 μl) of the reaction mixture was spotted on a polyethyleneimine-cellulose thin-layer plate (Merck, Darmstadt, Germany) and subjected to thin-layer chromatography with 1 M LiCl and 0.5 M formic acid buffer. The plate was exposed to a phosphorimaging plate and scanned using a phosphorimager (BAS-1800 II; Fuji). Polyethyleneimine (PEI) assays were repeated (n = 4 to 5) to obtain the histograms (see Fig. 3; see Fig. S3 in the supplemental material).
Fig 3.

Size exclusion chromatography (A and B) and ATPase assay (C and D) of the P. ruminicola 23 GSIII-1 and -2. (A and B) The chromatograph represents 100 μl (7.5 mg/ml) of purified recombinant P. ruminicola 23 GSIII-1 (A) and -2 (B) dialyzed against 50 mM imidazole-HCl (pH 6.5)–50 mM NaCl–50 mM MgCl2, injected into a Superdex 200 HR 10/30 gel filtration column (Amersham Biosciences, NJ), and eluted at a rate of 0.5 ml/min. Elution volumes of the standards are represented by arrows 1 to 5: 1, thyroglobulin (670 kDa); 2, γ-globulin (158 kDa); 3, ovalbumin (44 kDa); 4, myoglobin (17 kDa); 5, vitamin B12 (1.3 kDa). SDS-PAGE analyses of 15-μl aliquots of fractions collected during size exclusion chromatography analysis are presented below the chromatography panel. All bands correspond in size to the P. ruminicola 23 GSIII-1 and GSIII-2 monomeric subunit (83 kDa). (C and D) Histogram showing ATP hydrolysis expressed as pmol ATP hydrolyzed/mg/min determined using the PEI plate assay. Lanes 1, 1 μg positive control (MacHjm of Methanosarcina acetivorans); lanes 2, negative control (no protein); lanes 3, 25 ng GS III-1 and -2; lanes 4, 50 ng GS III-1 and -2; lanes 5, 100 ng GS III-1 and -2.
ATPase kinetic analysis.
ATP hydrolysis was monitored spectrophotometrically by coupling ATP hydrolysis to NADH oxidation using a Cary 300 Bio UV-visible spectrophotometer (27). Briefly, the ATPase activity was coupled with oxidation of NADH to NAD+, which can be monitored by changes in absorbance at 340 nm. Assay mixtures contained 100 mM MOPS (pH 7.5), 250 mM sodium glutamate, 10 mM MnCl2, 50 mM NH4Cl, 6 mM MgCl2, 2 mM phosphoenolpyruvate (PEP), 0.2 μg/μl NADH, pyruvate kinase/lactic dehydrogenase (PK/LDH) (30 units/ml) (Sigma-Aldrich, St. Louis, MO), 0.1 mg/ml bovine serum albumin, and the concentrations of ATP determined in the procedure described above. The reaction was initiated by the addition of 25 nM GSIII-1 or 50 nM GSIII-2 after preincubation of all other components at 37°C for 5 min. The rate of ATP hydrolysis was calculated from the rate of change in absorbance at 340 nm over 90 min.
RNA extraction and purification.
Total RNAs were isolated from P. ruminicola 23 cells grown on excess (10 mM) or limiting (0.7 mM) concentrations of ammonia. Cell pellets were frozen under liquid N2 and ground using a prechilled (−20°C) mortar and pestle. TRIzol (Invitrogen Corp., Carlsbad, CA) was added to the ground cell pellets. Protein was removed by precipitation with chloroform, and total RNAs were subsequently precipitated with isopropanol and resuspended with diethyl pyrocarbonate (DEPC)-treated water. The RNA was purified with a Qiagen RNeasy cleanup kit (Qiagen) by following the manufacturer's protocol. RNA concentrations and quality were determined by measuring the absorbance ratio A260/A280 with NanoDrop (NanoDrop Technologies) and an RNA 6000 NANO assay using an Agilent 2100 bioanalyzer (Agilent Technologies, Palo Alto, CA). RNA with an A260/A280 ratio of >1.9 and an RNA integrity number (RIN) of >9.0 was used for cDNA synthesis.
qRT-PCR.
For quantitative reverse transcriptase PCR (qRT-PCR), cDNA was generated using the Superscript III first-strand synthesis system (Invitrogen) with random hexamers. Each cDNA was synthesized from 100 ng of total RNA following the manufacturer's protocol. The cDNA was then diluted 1:4 with DNase- and RNase-free water. The qRT-PCR was performed using SYBR green I (Applied Biosystems, Foster City, CA) with an ABI Prism 7900 high-throughput sequence detection system. cDNA (4 μl) was mixed with 5 μl SYBR green master mix (Applied Biosystems, Foster City, CA), 0.4 μl of each 10 μM forward and reverse primer (Table 1), and 0.2 μl of DNase- and RNase-free water. Each sample was run in triplicate along a six-point relative standard curve of internal control or constitutive genes (atpD, ORFB01230; infB, ORFB02450; and rpoB, ORFB02217) determined from cDNA microarray plus nontemplate control (NTC). The qRT-PCRs were performed with the following conditions: 50°C for 2 min, 95°C for 10 min, and 40 cycles of 95°C for 15 s and 60°C for 1 min. In addition, to verify the presence of a single PCR product, a dissociation protocol using incremental temperatures to 95°C for 15 s plus 65°C for 15 s was performed. Data were analyzed using the SDS software version 2.2.1. (Applied Biosystems) using the six-point standard curve. A mixed model with repeated measures (release 9.0; SAS Institute, Cary, NC) using spatial power as the covariate structure was used for all analyses (normalized gene expression). The model included fixed effects of time and treatment. A replicate was considered a random effect. Statistical significance was declared at P ≤ 0.05.
Phylogenetic analysis.
All of the protein sequences were retrieved from GenBank, and GS sequences of P. ruminicola 23 were obtained from P. ruminicola 23 genome databases (accession number CP002006; http://jcvi.org/rumenomics/). Protein sequences were aligned using ClustalX (version 1.83), and the program generated an unrooted neighbor-joining tree (43). The phylogenetic tree was manipulated by using TreeView (version 1.4) (http://taxonomy.zoology.gla.ac.uk/rod/rod.html).
RESULTS
Amino acid sequence alignment.
Three GS-encoding genes (GSI, 501 amino acids [aa]; GSIII-1, 730 aa; and GSIII-2, 737 aa) were identified bioinformatically in the P. ruminicola 23 genome and were aligned with other characterized GSI and GSIII proteins. The alignments among GS proteins showed that GSI is divergent from GSIII proteins while GSIII-1 and GSIII-2 showed high similarity (GSI versus GSIII-1, 6%; GSI versus GSIII-2, 5%; and GSIII-1 versus GSIII-2, 79%). The alignments and phylogenetic tree were consistent with 16S rRNA organismal phylogeny, with the P. ruminicola 23 GSI being most similar to a GS type I from B. fragilis YCH46 (BF2249, accession no. YP_099530; 77% identity) (Fig. 1 and 2). Likewise, GSIII-1 and GSIII-2 of P. ruminicola 23 aligned best with the GSIII from P. bryantii B14 (accession no. AAL87245; 81% and 77% identical, respectively) but less well with those found in Ruminococcus albus 8, Ruminococcus flavefaciens FD-1, Synechococcus sp., and Psychromonas ingrahamii 37 (Fig. 2).
Fig 1.

Amino acid sequence alignment of biochemically characterized GSIII proteins. Motifs I, II, III, IV, and V are conserved throughout the GS proteins (types I, II, and III). Motifs A, B, C, and D are identical as signature motifs that are unique to GS type III proteins. Motif I, II, III, IV, and V conserved sites represent β-sheets of the active site α/β-barrel: I, latch [PYF]-D-[GA]-S-S; II, G-X(8)-E-[VD]-X (3,4)-Q-X-[EF]; III, ATP binding site K-P-[LIVMFYA]-X(3,5)-[NPAT]-G-[GSTAN]-G-X-H-X(3)-S; IV, glutamate binding site [ND]-R-X(3)-[IV]-R-[IV]; and V, [ILF]-E-[FDV]-R-X(6)-[NDPS]. Motif A, B, C, and D conserved regions are signature sequences AEKHDxFI (A), GEALD (B), EQEYFLxD (C), and HRLGxNEAPPAI (D) (11, 44). Amino acid sequences that are conserved are boxed in black, and those that are similar are gray. P. ruminicola 23-1 and P. ruminicola 23-2 indicate GS type III-1 (ORFB01459) and GS type III-2 (ORFB02034), respectively. Superscripts a, b, and c denote GSIII proteins that have been biochemically characterized, partially characterized proteins, and hypothetical GSIII proteins, respectively.
Fig 2.

Unrooted phylogenetic tree of GS type I, II, and III proteins based on ClustalX. Alignments were constructed using ClustalX, and the phylogenetic tree was built using a neighbor-joining plot (ClustalX version 1.82) (43).
Alignment of GSI of P. ruminicola 23 allowed for the identification of all five conserved regions common to GS families (1, 44) (motifs I, II, III, IV, and V; see Fig. S1 in the supplemental material). Alignment of GSI with characterized orthologs from Mycobacterium tuberculosis, E. coli, Salmonella enterica serovar Typhimurium, and Synechocystis sp. PCC 6803 revealed 10 insertions in motif II and substitutions in the ATP binding site (motif III). In contrast, alignment of GSIII-1 and GSIII-2 with GSIII family enzymes of R. albus 8 and Synechococcus sp. PCC 7942 revealed strong sequence conservation through all motifs (Fig. 1).
Expression and purification of recombinant proteins.
GSI, GSIII-1, and GSIII-2 from P. ruminicola 23 were heterologously expressed and purified in E. coli (see Fig. S2 in the supplemental material). P. ruminicola 23 GS proteins were purified using anion exchange followed by a cobalt affinity column. SDS-PAGE showed expression of protein with a molecular size consistent with that expected for GS proteins of P. ruminicola 23 (GSI, 56.0 kDa; GSIII-1 and -2, 83.0 kDa).
Subunit organization of recombinant GS of P. ruminicola 23.
The subunit organization of the purified GSIII-1 and -2 proteins was estimated using gel filtration and SDS-PAGE analysis. Two peaks were observed for GSIII-1, and one peak was observed for GSIII-2 (Fig. 3). The estimated sizes of the peaks observed for GSIII-1 were 1,339.0 ± 5.0 kDa and 133.0 ± 2.0 kDa, while that observed for GSIII-2 was estimated to be 230.0 ± 33.2 kDa. GSIII-1 and -2 monomers were both predicted to be ∼83 kDa, suggesting that GSIII-1 aggregates in solution as dodecamers and dimers, while GSIII-2 likely aggregates as a trimer.
Characteristics of GS activities.
Optimal GS protein conditions for P. ruminicola 23 are shown in Table S1 in the supplemental material. GSI displayed optimal γ-transferase activity at 35°C, while GSIII-1 and -2 γ-transferase activities were both optimal at 37°C. In all cases, activity was drastically decreased above 50°C. The optimum pH of GSI was determined to be pH 5.6, with little activity observed below pH 5.2 and above pH 5.6. Conversely, GSIII-1 and -2 were most active between pH 5.6 and 7.2, both having a pH optima of 6.0. γ-Transferase activity of all three enzymes (GSI, GSIII-1, and GSIII-2) was observed only in the presence of Mn2+ ions and was not detected in the presence of Mg2+, Cu2+, Co2+, or Ca2+. The optimal concentrations of Mn2+ ions for GSI, GSIII-1, and GSIII-2 γ-transferase activities were 0.25, 0.5, and 1 mM, respectively, with concentrations below 0.25 mM failing to elicit activity.
No biosynthetic activity for GSI was detected with any cation, and optimization of GSI biosynthetic activity for cation concentration, temperature, and pH could not be determined. The biosynthetic activity of GSIII-2 was dependent on the presence of Mn2+, Fe2+, Co2+, or Mg2+, with maximum activity observed in the presence of Mn2+. Biosynthetic activity of GSIII-1 was stimulated by Mn2+ and to lesser extents by Fe2+, Co2+, Mg2+, and Ca2+ (see Table S1 in the supplemental material). The optimal concentrations of Mn2+ for the biosynthetic activities of GSIII-1 and -2 were both 10 mM, with no biosynthetic activity observed below 5 mM (see Table S1). The optimum temperatures for biosynthetic activity of GSIII-1 and -2 were both 50°C, although both enzymes appeared stable up to 70°C. The biosynthetic activity of GSIII-1 had a pH optimum of pH 7.0, while that of GSIII-2 was shown to be pH 6.8. Biosynthetic activity of both GSIII enzymes was stable between pH 5.2 and 8.0 (see Table S1).
Kinetic properties.
For the γ-transferase assay of GSI, the calculated apparent Km for ADP, hydroxylamine-HCl, and l-glutamine is reported in Table 2. However, apparent Km values for the substrates in the biosynthetic assay were not detectable. For the γ-transferase assay of GSIII-1 and GSIII-2, the calculated apparent Km values were 0.06 and 0.62 mM for ADP, 2.04 and 0.07 mM for hydroxylamine-HCl, and 1.30 and 1.92 mM for l-glutamine, respectively. The apparent Km values of GSIII-1 and GSIII-2 for the substrates in the biosynthetic assay were 8.58 and 1.72 mM for glutamate, 1.91 and 2.65 mM for ATP, and 0.48 and 0.43 mM for ammonia, respectively (Table 2).
Table 2.
Apparent Km for different substrates of P. ruminicola 23 GSI and GSIII
| GS type | Apparent Km (mM) |
|||||
|---|---|---|---|---|---|---|
| Transferase assay |
Biosynthetic assay |
|||||
| Glutamine | ADP | Hydroxylamine-HCl | Glutamate | ATP | NH4+ | |
| GSI | 1.93 | 0.45 | 2.70 | NMa | NM | NM |
| GSIII-1 | 1.30 | 0.06 | 2.04 | 8.58 | 1.91 | 0.48 |
| GSIII-2 | 0.62 | 0.07 | 1.92 | 1.72 | 2.65 | 0.43 |
NM, no activity for these substrates was obtained using the biosynthetic assay.
ATPase activity.
We tested GSI, GSIII-1, and GSIII-2 from P. ruminicola for their abilities to hydrolyze ATP (Fig. 3; see Fig. S3 in the supplemental material). GSIII-1 and -2 gave the highest ATP hydrolysis activities. Increasing GSI did not increase ATP hydrolysis. However, increasing the GSIII-1 and GSIII-2 concentration increased ATP hydrolysis in a concentration-dependent manner (Fig. 3). GSI had ca. 100-fold lower ATPase activity (7 pmol ATP hydrolyzed/mg/min) (see Fig. S3) compared to ATPase activities of GSIII-1 and -2 (70 to 190 pmol ATP hydrolyzed/mg/min) (Fig. 3).
Transcriptional regulation and GS enzyme activities in continuous culture.
Transcription levels of the three different GS-encoding genes were analyzed by qRT-PCR from a continuous culture of P. ruminicola 23 before and after a shift in ammonia concentration from excess (10 mM) to limiting (0.7 mM). On high concentrations of ammonia, GSIII-2 (ORFB02034) increased 71.3-fold (Table 3). On the other hand, GSI and GSIII-1 were not significantly increased on high concentrations of ammonia (GSI, 1.9-fold; GSIII-1, 1.7-fold).
Table 3.
Relative expression levels of glutamine synthetase enzymes in P. ruminicola 23 on high ammonia as determined by qRT-PCR analyses
| ORF | Gene | Common name | EC no. | Fold change in qRT-PCRa |
|---|---|---|---|---|
| ORFB02151 | Glutamine synthetase, type I (GSI) | 6.3.1.2 | 1.9 | |
| ORFB01459 | glnA | Glutamine synthetase, type III (GSIII-1) | 6.3.1.2 | 1.7 |
| ORFB02034 | glnA | Glutamine synthetase, type III (GSIII-2) | 6.3.1.2 | 71.3 |
Fold change in qRT-PCR during growth on high (nonlimiting) ammonia versus low (growth-limiting) ammonia concentrations.
The biosynthetic activity of GS was around 2-fold higher during growth of P. ruminicola 23 on a nonlimiting concentration of ammonia than on a limiting ammonia concentration (19.4 ± 2.0 nmol Pi/μg/min on nonlimiting versus 8.8 ± 2.6 nmol Pi/μg/min on limiting ammonia). No GSI biosynthetic activity was detected during this study; thus, activity likely represents GS type III enzyme activity. Interestingly, this study revealed upregulation when P. ruminicola 23 was grown on nonlimiting ammonia. Specifically, GSIII-2 showed 71.3-fold upregulation. These results suggest that GSIII-2 plays an important role in ammonia assimilation under nonlimiting ammonia growth conditions.
DISCUSSION
The well-studied nitrogen metabolic circuit in enteric bacteria consists of three enzymes: glutamine synthetase (GS), glutamate synthase (GOGAT), and glutamate dehydrogenase (GDH). Glutamine synthetase, encoded by glnA, catalyzes the only pathway for the synthesis of glutamine. Glutamate can be synthesized by two pathways: through the combined activity of GS and glutamate synthase, encoded by gltBD, that constitute the GS-GOGAT pathway and through the activity of glutamate dehydrogenase, encoded by gdhA (34). In enteric bacteria, the GS-GOGAT enzyme system has a high affinity for NH4+ (Km, <0.2 mM for GS) whereas GDH has a low affinity (Km, >1 mM) (32, 39). The two central intermediates in nitrogen metabolism, glutamine and glutamate, provide N for the synthesis of all other N-containing cell components. While understanding of nitrogen metabolism and regulation are well understood in enteric bacteria, studies on predominant anaerobic rumen and human colonic bacteria are sparse and lag far behind research on model organisms such as E. coli and Salmonella.
Closed genome sequence for P. ruminicola 23 enabled a functional genomics approach to analyze enzymatic mechanisms involved in ammonia assimilation. As a first step, we carried out a bioinformatic analysis and identified three genes encoding glutamine synthetase in the genome of P. ruminicola 23. The predicted GS amino acid sequences were compared with those of biochemically validated and putative GS type I and type III proteins in the available databases and support a vertical path of descent for these enzymes (Fig. 2). However, amino acid sequence alignment of GSI revealed insertions in motifs II (an active β-barrel site) and III (the ATP-binding site) compared to characterized GSI proteins (see Fig. S2 in the supplemental material). In addition, GSIII-1 and GSIII-2 displayed strong conservation of all five GS conserved regions and four GS type III-specific conserved regions (11, 44). Furthermore, key conserved amino acid residues essential for function of the GSIII protein in signature motifs I to IV and motif C in R. albus 8 were all highly conserved within the P. ruminicola 23 GSIII amino acid sequence (2). These alignments, supported by GS biosynthetic activity of the two GSIII proteins but not GSI, suggest important roles of P. ruminicola 23 GSIII proteins in nitrogen metabolism and that GSI is no longer essential to ammonia assimilation and possibly no longer functions as a GS enzyme. Interestingly, despite GSI having no biosynthetic activity, it still has low ATPase activity as well as glutamyl transferase activity and may function as an amino acid transferase, although this has not been tested. It is possible that this indicates a recent loss of GS function for GSI potentially mediated by reduced selective pressure by the duplication of GSIII compared to P. bryantii, a close ruminal and phylogenetic relative, which has a single GSIII and GSI present in the genome. Furthermore, glnA (ORFB02034) encoding GSIII-2 is adjacent to gltD and gltB encoding GOGAT (Fig. 4; see Table S2 in the supplemental material). This gene cluster containing GS adjacent to GOGAT supports the possible function of GSIII-2 in the ammonia assimilation pathway as part of a functional GS-GOGAT-linked enzyme system. The 7-amino acid insertion (or deletion) observed in motif II of the P. ruminicola GSI is also observed in two homologs found in B. fragilis and Bacteroides thetaiotaomicron. This insertion, although potentially contributing to the lack of biosynthetic activity observed in the P. ruminicola GSI, is unlikely to be the entire contributing factor, since the R. albus 8 homolog, which lacks this feature, is also inactive for biosynthetic activity (2). Amino acid residues that may be of significance and are conserved in the functional homologs (M. tuberculosis, E. coli K-12, S. Typhimurium, and the Synechocystis sp. homologs) but have been replaced with nonconservative residues in the two nonfunctional homologs (R. albus 8 and P. ruminicola 23 homologs) are the aspartate/asparagine in motif III. We predict that the Bacteroides sp. homologs are also nonfunctional. Mutational analysis will, however, be required to unravel the contributions of the different mutations, insertions, or deletions to the lack of biosynthetic activity observed in some GSI homologs.
Fig 4.

Gene map of GS type I and two GS type III proteins in P. ruminicola 23. Annotation based on P. ruminicola 23 genome database (http://jcvi.org/rumenomics/). Total size of each genome fragment is approximately 30 kb (15 kb downstream and upstream from GS gene). Gene annotation information is included in Table S2 in the supplemental material.
Enzymatic characterization of the three GS enzymes of P. ruminicola 23 was carried out to define the optimal conditions for the enzymatic activity. The GSIII proteins showed a low Km value for ammonia (0.48 mM for GSIII-1 and 0.43 mM for GSIII-2) similar to that of the GS of E. coli (Km 0.6 mM) (30). These kinetic values suggest that both GSIII enzymes are functional and play a glutamine biosynthetic role in vivo based on their affinity for glutamate and ammonia. Ammonia levels in the rumen vary considerably depending on diet and time postfeeding but are in the general range of 2 to 38 mM (4, 23); however, on poor-quality, low-protein forages they fall below 1 mM. Further support for their role in ammonia assimilation was shown by analysis of transcript level using qRT-PCR and enzyme activities of GSI and two GSIII proteins during chemostat culture of P. ruminicola 23 with nonlimiting (residual NH3 3.66 mM) and limiting (residual NH3 0.025 mM) concentrations of ammonia (Table 3). Our results for glnA expression and GS activity in P. ruminicola 23 by ammonia concentration are divergent from that described for GSIII proteins in B. fragilis Bf-1, Butyrivibrio fibrisolvens, R. albus 8, Pseudanabaena sp. PCC 6903, Synechocystis sp. PCC 6803, and Synechococcus sp. PCC 7942, which all showed higher enzymatic activities and high expression levels for cells grown under ammonia limitation (2, 10, 11, 22, 35, 41). The reason for this discrepancy is not obvious, but previously normalization was based on 16S rRNA gene level whereas this comparison is related to constitutively expressed genes. Importantly, cells used for measuring transcript levels and enzyme activity in the present study were prepared in chemostat- and not batch-grown cells and thus steady-state residual concentrations of ammonia could be established for each condition before sampling.
In conclusion, the present study is the first to biochemically characterize multiple GS proteins encoded within a single genome and to establish their kinetic properties. The two GSIII genes are paralogs (79% amino acid similarity) resulting from gene duplication that presumably provides functional divergence and the ability to adapt to various environmental conditions and to expand the growth phenotype that Prevotella ruminicola expresses. Based on its enzyme activity and expression levels, we show that GSIII-2 is responsive to external ammonia concentrations and is likely involved in ammonia assimilation with higher expression levels on nonlimiting than on limiting growth concentrations of ammonia. The genomic context of GSIII-2, together with the large and small subunits (gltB and gltD) of GOGAT, also provides additional support for this hypothesis. We propose that GSIII-1 plays a related, rather than entirely new, function and is involved in recycling of ammonia, maintenance of the intracellular glutamate pool, and supply of amine groups for biosynthesis of other N-containing cell components such as amino acids, purines, pyrimidines, and polyamines. Neither GSIII-1 nor GSI have other genes involved in amino acid biosynthesis in contiguous genomic sequence 15 kb upstream or downstream of their respective ORFs. The role for GSI is unknown, since the recombinant enzyme lacked biosynthetic activity although it exhibited both glutamyl transferase and ATPase activity and was functional. We suggest that in vivo this enzyme no longer functions in the synthesis of glutamine from glutamate and ammonia but may play a role in aminotransferase activity and still participate in intracellular nitrogen metabolism, although this remains to be determined.
Supplementary Material
ACKNOWLEDGMENTS
This project was supported by National Research Initiative Competitive Grant no. 2008-35206-18784 from the USDA National Institute of Food and Agriculture (R.I.M. and I.K.O.C.). Partial support was also provided by the USDA Cooperative State Research, Education and Extension Service, Hatch project ILLU 538-364 (to I.K.O.C.).
Footnotes
Published ahead of print 21 October 2011
Supplemental material for this article may be found at http://jb.asm.org/.
REFERENCES
- 1. Almassy RJ, Janson CA, Hamlin R, Xuong NH, Eisenberg D. 1986. Novel subunit-subunit interactions in the structure of glutamine synthetase. Nature 323:304–309 [DOI] [PubMed] [Google Scholar]
- 2. Amaya KR, Kocherginskaya SA, Mackie RI, Cann IK. 2005. Biochemical and mutational analysis of glutamine synthetase type III from the rumen anaerobe Ruminococcus albus 8. J. Bacteriol. 187:7481–7491 [DOI] [PMC free article] [PubMed] [Google Scholar]
- 3. Bender RA, et al. 1977. Biochemical parameters of glutamine synthetase from Klebsiella aerogenes. J. Bacteriol. 129:1001–1009 [DOI] [PMC free article] [PubMed] [Google Scholar]
- 4. Broderick GA, Wallace RJ. 1988. Effects of dietary nitrogen source on concentrations of ammonia, free amino acids and fluorescamine-reactive peptides in the sheep rumen. J. Anim. Sci. 66:2233–2238 [Google Scholar]
- 5. Brown CM, Mcdonald-Brown DS, Meers JL. 1974. Physiological aspects of microbial inorganic nitrogen metabolism. Adv. Microbiol. Physiol. 11:1–52 [Google Scholar]
- 6. Brown JR, Masuchi Y, Robb FT, Doolittle WF. 1994. Evolutionary relationships of bacterial and archaeal glutamine synthetase genes. J. Mol. Evol. 38:566–576 [DOI] [PubMed] [Google Scholar]
- 7. Bryant MP, Small N, Bouma C, Chu H. 1958. Bacteroides ruminicola n. sp. and Succinimonas amylolytica; the new genus and species; species of succinic acid-producing anaerobic bacteria of the bovine rumen. J. Bacteriol. 76:15–23 [DOI] [PMC free article] [PubMed] [Google Scholar]
- 8. Carlson TA, Chelm BK. 1986. Apparent eukaryotic origin of glutamine synthetase II from the bacterium Bradyrhizobium japonicum. Nature 322:568–570 [Google Scholar]
- 9. Chifflet S, Torriglia A, Chiesa R, Tolosa S. 1988. A method for the determination of inorganic phosphate in the presence of labile organic phosphate and high concentrations of protein: application to lens ATPases. Anal. Biochem. 168:1–4 [DOI] [PubMed] [Google Scholar]
- 10. Cohen-Kupiec R, Gurevitz M, Zilberstein A. 1993. Expression of glnA in the cyanobacterium Synechococcus sp. strain PCC 7942 is initiated from a single nif-like promoter under various nitrogen conditions. J. Bacteriol. 175:7727–7731 [DOI] [PMC free article] [PubMed] [Google Scholar]
- 11. Crespo JL, Garcia-Dominguez M, Florencio FJ. 1998. Nitrogen control of the glnN gene that codes for GS type III, the only glutamine synthetase in the cyanobacterium Pseudanabaena sp. PCC 6903. Mol. Microbiol. 30:1101–1112 [DOI] [PubMed] [Google Scholar]
- 12. Darrow RA, Knotts RR. 1977. Two forms of glutamine synthetase in free-living root-nodule bacteria. Biochem. Biophys. Res. Commun. 78:554–559 [DOI] [PubMed] [Google Scholar]
- 13. Dehority BA. 1966. Characterization of several bovine rumen bacteria isolated with a xylan medium. J. Bacteriol. 91:1724–1729 [DOI] [PMC free article] [PubMed] [Google Scholar]
- 14. Dehority BA. 1969. Pectin-fermenting bacteria isolated from the bovine rumen. J. Bacteriol. 99:189–196 [DOI] [PMC free article] [PubMed] [Google Scholar]
- 15. Duncan PA, White BA, Mackie RI. 1992. Purification and properties of NADP-dependent glutamate dehydrogenase from Ruminococcus flavefaciens FD-1. Appl. Environ. Microbiol. 58:4032–4037 [DOI] [PMC free article] [PubMed] [Google Scholar]
- 16. Eisenberg D, Gill HS, Pfluegl GM, Rotstein SH. 2000. Structure-function relationships of glutamine synthetases. Biochim. Biophys. Acta 1477:122–145 [DOI] [PubMed] [Google Scholar]
- 17. Erfle JD, Sauer FS, Mahadevan S. 1977. Effect of ammonia concentration on activity of enzymes of ammonia assimilation and on synthesis of amino acids by mixed rumen bacteria in continuous culture. J. Dairy Sci. 60:1064–1072 [DOI] [PubMed] [Google Scholar]
- 18. Fisher SH. 1999. Regulation of nitrogen metabolism in Bacillus subtilis: vive la difference! Mol. Microbiol. 32:223–232 [DOI] [PubMed] [Google Scholar]
- 19. Fuchs RL, Keister DL. 1980. Identification of two glutamine synthetases in Agrobacterium. J. Bacteriol. 141:996–998 [DOI] [PMC free article] [PubMed] [Google Scholar]
- 20. Gawronski JD, Benson DR. 2004. Microtiter assay for glutamine synthetase biosynthetic activity using inorganic phosphate detection. Anal. Biochem. 327:114–118 [DOI] [PubMed] [Google Scholar]
- 21. Gonzalez-Romo P, Sanchez-Nieto S, Gavilanes-Ruiz M. 1992. A modified colorimetric method for the determination of orthophosphate in the presence of high ATP concentrations. Anal. Biochem. 200:235–238 [DOI] [PubMed] [Google Scholar]
- 22. Goodman HJ, Woods DR. 1993. Cloning and nucleotide sequence of the Butyrivibrio fibrisolvens gene encoding a type III glutamine synthetase. J. Gen. Microbiol. 139:1487–1493 [DOI] [PubMed] [Google Scholar]
- 23. Grigsby KN, Kerley MS, Paterson JA, Weigel JC. 1993. Combinations of starch and digestible fiber in supplements for steers consuming a low-quality bromegrass hay diet. J. Anim. Sci. 71:1057–1064 [DOI] [PubMed] [Google Scholar]
- 24. Hazlewood GP, Edwards R. 1981. Proteolytic activities of a rumen bacterium, Bacteroides ruminicola R8/4. J. Gen. Microbiol. 125:11–15 [DOI] [PubMed] [Google Scholar]
- 25. Hill RT, Parker JR, Goodman HJK, Jones DT, Woods DR. 1989. Molecular analysis of a novel glutamine synthetase of anaerobe Bacteroides fragilis. J. Gen. Microbiol. 135:3271–3279 [DOI] [PubMed] [Google Scholar]
- 26. Hobson PN. 1969. Rumen bacteria. Methods Microbiol. 3B:133–149 [Google Scholar]
- 27. Kowalczykowski SC, Krupp RA. 1987. Effects of Escherichia coli SSB protein on the single-stranded DNA-dependent ATPase activity of Escherichia coli RecA protein. Evidence that SSB protein facilitates the binding of RecA protein to regions of secondary structure within single-stranded DNA. J. Mol. Biol. 193:97–113 [DOI] [PubMed] [Google Scholar]
- 28. Kumada Y, Takano E, Nagaoka K, Thompson CJ. 1990. Streptomyces hygroscopicus has two glutamine synthetase genes. J. Bacteriol. 172:5343–5351 [DOI] [PMC free article] [PubMed] [Google Scholar]
- 29. Leigh JA, Dodsworth JA. 2007. Nitrogen regulation in bacteria and archaea. Annu. Rev. Microbiol. 61:349–377 [DOI] [PubMed] [Google Scholar]
- 30. Meek TD, Villafranca JJ. 1980. Kinetic mechanism of Escherichia coli glutamine synthetase. Biochemistry 19:5513–5519 [DOI] [PubMed] [Google Scholar]
- 31. Merrick MJ, Edwards RA. 1995. Nitrogen control in bacteria. Microbiol. Rev. 59:604–622 [DOI] [PMC free article] [PubMed] [Google Scholar]
- 32. Miller RE, Stadtman ER. 1972. Glutamate synthase from Escherichia coli: an iron-sulfide flavoprotein. J. Biol. Chem. 247:7407–7419 [PubMed] [Google Scholar]
- 33. Pittman KA, Bryant MP. 1964. Peptides and other nitrogen sources for growth of Bacteroides ruminicola. J. Bacteriol. 88:401–410 [DOI] [PMC free article] [PubMed] [Google Scholar]
- 34. Reitzer L. 2003. Nitrogen assimilation and global regulation in Escherichia coli. Annu. Rev. Microbiol. 57:155–176 [DOI] [PubMed] [Google Scholar]
- 35. Reyes JC, Florencio FJ. 1994. A new type of glutamine synthetase in cyanobacteria: the protein encoded by the glnN gene supports nitrogen assimilation in Synechocystis sp. strain PCC 6803. J. Bacteriol. 176:1260–1267 [DOI] [PMC free article] [PubMed] [Google Scholar]
- 36. Robinson IM, Allison MJ, Bucklin JA. 1981. Characterization of the cecal bacteria of normal pigs. Appl. Environ. Microbiol. 41:950–955 [DOI] [PMC free article] [PubMed] [Google Scholar]
- 37. Rochefort DA, Benson DR. 1990. Molecular cloning, sequencing, and expression of the glutamine synthetase II (glnII) gene from the actinomycete root nodule symbiont Frankia sp. strain CpI1. J. Bacteriol. 172:5335–5342 [DOI] [PMC free article] [PubMed] [Google Scholar]
- 38. Russell JB. 1983. Fermentation of peptides by Bacteroides ruminicola B14. Appl. Environ. Microbiol. 45:1566–1574 [DOI] [PMC free article] [PubMed] [Google Scholar]
- 39. Sakamoto N, Kotre AM, Savageau MA. 1975. Glutamate dehydrogenase from Escherichia coli: purification and properties. J. Bacteriol. 124:775–783 [DOI] [PMC free article] [PubMed] [Google Scholar]
- 40. Shapiro BM, Stadtman ER. 1970. Glutamine synthetase (Escherichia coli). Methods Enzymol. 17a:910–922 [Google Scholar]
- 41. Southern JA, Parker JR, Woods DR. 1987. Novel structure, properties and inactivation of glutamine synthetase cloned from Bacteroides fragilis. J. Gen. Microbiol. 133:2437–2446 [DOI] [PubMed] [Google Scholar]
- 42. Stevenson DM, Weimer PJ. 2007. Dominance of Prevotella and low abundance of classical ruminal bacterial species in the bovine rumen revealed by relative quantification real-time PCR. Appl. Microbiol. Biotechnol. 75:165–174 [DOI] [PubMed] [Google Scholar]
- 43. Thompson JD, Gibson TJ, Plewniak F, Jeanmougin F, Higgins DG. 1997. The CLUSTAL_X Windows interface: flexible strategies for multiple sequence alignment aided by quality analysis tools. Nucleic Acids Res. 25:4876–4882 [DOI] [PMC free article] [PubMed] [Google Scholar]
- 44. Van Rooyen JM, Abratt VR, Belrhali H, Sewell BT. 2011. Crystal structure of type III glutamine synthetase: surprising reversal of the inter-ring interface. Structure 19:471–483 [DOI] [PubMed] [Google Scholar]
- 45. Wallace RJ, Onodera R, Cotta MA. 1997. Metabolism of nitrogen-containing compounds, p. 283–328 In Hobson PN, Stewart CS. (ed), The rumen microbial ecosystem. Chapman & Hall, London, United Kingdom [Google Scholar]
- 46. Wilson K. 1997. Preparation of genomic DNA from bacteria, p 2.4.1–2.4.5 In Ausubel FM, et al.(ed), Current protocols in molecular biology. John Wiley & Sons, New York, NY: [DOI] [PubMed] [Google Scholar]
- 47. Yamashita MM, Almassy RJ, Janson CA, Cascio D, Eisenberg D. 1989. Refined atomic model of glutamine synthetase at 3.5 A resolution. J. Biol. Chem. 264:17681–17690 [DOI] [PubMed] [Google Scholar]
Associated Data
This section collects any data citations, data availability statements, or supplementary materials included in this article.