

Abstract
Cell wall damage in Staphylococcus aureus induces a rapid genome-wide response, referred to as the cell wall stress stimulon. This response is mediated by a two-component system, the vancomycin resistance-associated sensor/regulator (VraSR). The response regulator protein VraR is a transcription factor. Here, we demonstrate that two VraR binding sites in the vraSR operon control region are involved in the regulation of the vraSR operon. The sites are centered at the −60 and −35 nucleotide positions and are referred to as R1 and R2, respectively. DNase I footprinting and lux operon reporter vector studies showed that both of these sites communicate intimately with each other to fine-tune the activity of the vraSR operon. Mutagenesis of the VraR binding sites showed that dimerization of unphosphorylated VraR at R1 is driven by a hierarchy in VraR binding and by the proximity of the two tandem VraR binding sequences at this site. On the other hand, these studies show that the lack of sequence conservation and the distance between the VraR binding sequences in R2 ensure that VraR is recruited to this site only when phosphorylated (hence, under stress conditions). Furthermore, we demonstrate that sigma A (SigA) factor is involved in the regulation of the vraSR operon. Our study shows that sigma A factor does not bind to the vraSR operon control region in the absence of VraR, suggesting that VraR may interact directly with this factor.
INTRODUCTION
The two-component vancomycin resistance-associated sensor/regulator (VraSR) signal transduction system of Staphylococcus aureus coordinates the bacterial response to cell wall damage and the disruption of cell wall synthesis (7, 21, 22) caused by a broad class of antimicrobial agents (cell wall active inactivators). Inactivation of vraSR both decreases the resistance of different S. aureus strains to β-lactams and vancomycin and converts the homogeneous oxacillin resistance phenotype into a highly heterogeneous resistance phenotype (15, 25). In contrast, a constitutively active vraSR operon, caused by a single-point mutation in vraS, leads to increased teicoplanin resistance of clinical glycopeptide-intermediate S. aureus strains (19). These findings corroborate the proposed role of VraSR as a sentinel of cell wall integrity (15).
VraSR is a typical two-component system (TCS) composed of a histidine kinase (HK) and a response regulator (RR) that can rapidly sense and transduce cell wall stress (1, 22, 25). VraS is suggested to be the only biologically relevant kinase of the RR protein VraR, and hence, the VraSR system may be the main pathway through which the signal to cell wall stress response is transduced (1). A recent study by Galbusera et al. showed that the removal of the phosphorylation site from vraS prevents the emergence of glycopeptide resistance in several S. aureus strains (13).
Sequence alignments of VraR with other response regulators indicate that this protein belongs to the NarL/FixJ subfamily of proteins (1). These proteins use helix-turn-helix motifs to bind to DNA (14). Although the members of this subfamily have high sequence similarity at the C terminus (DNA-binding domain), each member recognizes unique DNA sequences and utilizes different regulatory strategies. This is likely due to subtle differences in the primary structure of the helix-turn-helix motif (32) and/or the tertiary structure of the active state of the response regulators (14). Such diversity in regulatory schemes makes it challenging to predict the general gene regulation mechanism used in this protein family.
Recently, we showed that VraR binds to the vraSR operon control region at three possible sites (Fig. 1), referred to as the R1, R2, and R3 sites (2). VraR binding sites centered at positions −60 and −35 were analyzed independently, and in vitro studies showed binding of VraR to R1 was not affected by phosphorylation of VraR, while unphosphorylated VraR did not bind to R2. Background expression of the vraSR operon is required for proper synthesis of bacterial cell wall peptidoglycan. However, it is not known how the basal expression level is achieved. In addition, the sigma factor or factors involved in the VraSR-mediated cell wall stimulon have not been identified.
Fig 1.

VraR binding sites on PvraSR. The VraR binding sequences are underlined, and the nucleotides proposed to be essential for VraR recognition and binding are shown in boldface. The transcription starting point is denoted by an asterisk, and the −10 box sequence is double underlined.
In this study, we investigated the binding mode of VraR to the vraSR operon control region. We examined the role of DNA sequence in the regulation scheme of vraSR operon expression and in distinguishing between normal and stress conditions. Further, our analysis of the vraSR promoter suggests involvement of an Escherichia coli σ70-like factor in the transcriptional regulation of the vraSR operon. Herein, we present our investigation into the role of the S. aureus sigma A (SigA) factor in vraSR operon expression.
MATERIALS AND METHODS
Growth media and chemicals.
Chemicals were purchased from Sigma-Aldrich or Fisher Scientific, unless otherwise stated. The Escherichia coli Nova Blue strain and the pSTBlue cloning vector were purchased from Novagen. Restriction enzymes were obtained from either New England BioLabs or Stratagene. The [γ-32P]ATP (3,000 Ci/mmol) and [α-32P]UTP (3,000 Ci/mmol) were purchased from PerkinElmer. The E. coli RNA polymerase (RNAP) holoenzyme and the ATP, GTP, CTP, and UTP solutions were obtained from Epicenter Biotechnologies. The murine RNase inhibitor (40 U/μl) was purchased from New England BioLabs.
Phosphorylation of VraR by acetyl phosphate.
Full-length VraR was expressed in E. coli strain BL21(DE3) and purified as previously described (1). The phosphorylation of VraR by inorganic phosphate was carried out as described previously (1). Briefly, 50 μM VraR was equilibrated in buffer containing 50 mM Tris at pH 7.4, 50 mM KCl, and 5 mM MgCl2 (phosphorylation buffer [PB]). Lithium potassium acetyl phosphate was added to a final concentration of 50 mM, and the reaction mixture was incubated for 60 min at 37°C. The extent of VraR phosphorylation was estimated by high-pressure liquid chromatography (HPLC) (Varian Inc.) using a ProSphere HP C4 reverse-phase column (5 μm, 300 Å, 4.6 × 250 mm). Elution of the proteins was carried out on a 40-to-48% linear gradient of acetonitrile and 0.1% trifluoroacetic acid (TFA) over 40 min at a flow rate of 1 ml/min. The extent of VraR phosphorylation was estimated by assessment of the surface areas under the respective peaks. Under these phosphorylation conditions, 46% VraR was phosphorylated. Here, we refer to this protein mixture as VraR-P (mixture of phosphorylated and unphosphorylated VraR in which the phosphorylated species typically comprised 46% of the total VraR protein).
Mutagenesis of the vraSR operon control region.
A DNA sequence derived from the vraSR operon control region, which includes nucleotides −121 to +26, was amplified by PCR using the genomic DNA of S. aureus Mu50 as a template and the primers Dir_PvraSR, 5′-AGGAATTCGGTCCATTTTAACGACAAAAATTG-3′, and Rev_PvraSR, 5′-CGGGATCCTGAAATGACGCATTGATTGTGTTC-3′, which introduced restriction sites for EcoRI and BamHI (italicized in the sequences). The PvraSR promoter was subsequently ligated into the blunt-end vector pSTBlue-1. The ligation mixtures were introduced into E. coli DH5α by heat shock, and the cells were subsequently plated onto Luria Bertani (LB) agar plates supplemented with 50 μg/ml kanamycin, 0.1 M IPTG (isopropyl-β-d-thiogalactopyranoside), and 20 μg/ml X-Gal (5-bromo-4-chloro-3-indolyl-β-d-galactopyranoside) for white and blue screening. The putative-positive transformants were confirmed by sequencing the plasmid for the presence of the insertion. The pSTblue-1::PvraSR plasmid was used as a template to generate various PvraSR mutants carrying one or two mutations in the essential binding elements from the R1, R2, and R3 binding sites. A QuikChange mutagenesis kit obtained from Stratagene was used for the mutagenesis. The mutagenic primers used in this study are shown in Table S1 in the supplemental material. For cases in which two nucleotides were substituted, the target mutations were carried out in two steps. The replaced nucleotides are underlined and highlighted in Table S1.
Cloning, isolation, and purification of S. aureus SigA.
The sigA gene sequence was amplified from S. aureus RN4220 genomic DNA by PCR using the following primers: Dir-SigA, 5′-ACGCCATGGCTATGTCTGATAACACAGTT-3′, and Rev-SigA, 5′-ACGAAGCTTTTAATCCATAAAGTCTTTCA-3′. The sigA amplicon was double digested with NcoI and HindIII and ligated into the pET24d(+) vector. The sequence of sigA was confirmed by DNA sequencing. The vector pET24a::sigA was subsequently introduced to E. coli BL21(DE3). Expression of the sigma A factor was induced with 1 mM IPTG when the culture reached an optical density (OD) of 0.8. Cells were then shaken for 16 h at 25°C.
Purification of SigA was carried out in two steps. In the first step, SigA was purified on a DEAE-Sepharose column and eluted using a 0-to-100% linear gradient of buffer B (20 mM Tris, 0.1 mM EDTA, 0.1 mM dithiothreitol [DTT], and 1.0 M NaCl, pH 7.9). The second purification was done on a heparin-Sepharose column. Coomassie blue staining of SDS-PAGE indicated that the isolated protein was 90% pure. Protein concentration was determined by the Bradford assay.
Electromobility shift assays.
The pSTblue-1::PvraSR plasmid carrying the vraSR operon control region (nucleotides −121 to +26) or the mutated sequence (see above) was amplified by PCR using the above-mentioned primers. The DNA-binding activities of VraR and VraR-P used to target DNA sequences were analyzed with electromobility shift assays (EMSAs). The double-stranded DNA sequences were labeled with T4 polynucleotide kinase using [γ-32P]ATP (3,000 Ci/mmol). Binding reaction mixtures (20 μl) were prepared in binding buffer (10 mM Tris at pH 7.5, 50 mM KCl, 1 mM DTT) supplemented with 5 mM MgCl2, 0.05% NP-40, 200 ng/μl poly(dI-dC), and 2.5% glycerol. Target DNA (2 ng) was mixed with protein concentrations ranging from 1 to 20 μM. The reaction mixtures were incubated at 25°C for 30 min and loaded into a 10% native polyacrylamide gel. Dried gels were exposed to a phosphor screen and analyzed with a Typhoon Trio+ variable-mode imager (GE HealthCare). The incubation time was experimentally determined as the time required for equilibrium to be reached at the smallest VraR (VraR-P) concentration used in these assays. Each EMSA was repeated at least three times. The dissociation constants (Kd) were determined from nonlinear regression analysis of the experimental data using the following binding equation, where n is the Hill coefficient, Cap is the maximum binding capacity (the maximum number of bound species formed between the DNA and the protein at the end of the titration assay), obtained from the nonlinear fitting of the data, and [P] is the protein concentration used in the assay: percentage of DNA bound = Cap × [P]n/(Kdn + [P]n).
DNase I footprinting assay.
The DNA sequence encompassing nucleotides −121 to +26 (with respect to the transcription start site) of the vraSR operon control region (PvraSR) was amplified using the following PCR primers: Dir, 5′-ACGAAGCTTGGTCCGATTTTAACGACAAAAATTG-3′, and Rev, 5′-TGAAATGACGCATT GATTGTGTTC-3′. For DNase I footprinting, the primer of interest (forward or reverse) was 5′ end labeled with T4 polynucleotide kinase in the presence of [γ-32P]ATP (3,000 Ci/mmol) and was used to amplify PvraSR. Binding reaction mixtures (20 μl) were prepared in binding buffer (100 mM Tris at pH 7.5, 500 mM KCl, 10 mM DTT) supplemented with 5 mM MgCl2, 0.05% NP-40, 200 ng/μl poly(dI-dC), and 2.5% glycerol. The 32P-end-labeled PvraSR (10 ng) was mixed with VraR or VraR-P at concentrations ranging from 2 to 5 μM. Of note, the VraR-P represented a mixture of phosphorylated and unphosphorylated VraR in which the phosphorylated species typically comprised 46% of the total VraR protein. Binding reactions were carried out at 25°C for 30 min and subsequently subjected to DNase I (2 U) at 25°C for 2 min. The digestion reactions were stopped by addition of 50 μl DNase I stop solution (1% SDS, 0.2 M NaCl, 20 mM EDTA at pH 8.0, and 0.25 mg/ml tRNA). Digested DNA samples were isolated by phenol-chloroform extraction and ethanol precipitation. Pellets containing DNA were air dried and then resuspended in formamide containing loading dye. The samples were heated at 95°C for 3 min and loaded into an 8% polyacrylamide gel containing 7 M urea. The dried gels were exposed to a phosphor screen and scanned using a Typhoon Trio+ variable-mode imager. The C and G sequencing reactions for these experiments were carried out with the same end-labeled oligonucleotide using terminator DNA polymerase and acyclic nucleotides GTP and CTP (acyGTP and acyCTP) (16).
KMnO4 footprinting assay.
A DNA sequence spanning between nucleotides −126 and +10 of the vraSR promoter region was amplified from genomic DNA of S. aureus RN4220 using PFU DNA polymerase and the following primers: DIR, 5′-AGGAATTCGGTCCGATTTTAACGACAAAAATTG, and REV, 5′-GATGATATGTTTGCTTAAAAACTACTT. Binding reaction mixtures containing 10 ng of end-labeled PvraSR, VraR (2 and 5 μM), or VraR-P (2 and 5 μM) and E. coli RNAP at a final concentration of 40 nM were prepared in 10 mM Tris at pH 7.5, 50 mM KCl, 5 mM MgCl2, 0.05% NP-40, 200 ng/μl poly(dI-dC), and 2.5% glycerol. The complexes were incubated at 30°C for 20 min. The samples were treated with heparin (50 μg/ml) at 30°C for 10 min. Subsequently, a 3-μl KMnO4 solution (20 mM) was added to the complexes for 30 s, after which the reaction was stopped with 3 μl DTT (200 mM), 0.4 M sodium acetate at pH 8.0, 2.5 mM EDTA, and 60 μg/ml herring sperm DNA. The reaction mixtures were immediately placed on ice for 5 min. The proteins were removed by phenol-chloroform extraction, and the DNA was precipitated in 100% ice-cold ethanol at −70°C for 1 h. The DNA pellets were washed once with 70% ethanol. The dried DNA pellets were resuspended in 100 μl piperidine (1 M) and heated at 90°C for 30 min. The piperidine solution was completely evaporated, and each DNA sample was dissolved in 20 μl water. The samples were vortexed, allowed to dry, and subsequently washed twice with 20 μl water. Finally, the samples were dissolved in formamide containing loading dye, heated at 95°C for 3 min, and immediately loaded into an 8% polyacrylamide gel containing 7 M urea. The dried gels were exposed to a phosphor screen and scanned using a Typhoon Trio+ variable-mode imager.
Runoff in vitro transcription assay.
Single-round transcription by E. coli RNAP was performed using a 612-bp fragment of the vraSR promoter region (PvraSRL) as a template in the presence or absence of VraR-P. The PvraSRL, which spans the region between nucleotides −426 to +150 of the vraSR promoter region, was amplified by PFU Turbo DNA polymerase and the following primers: Dir_PvraSRL, 5′-AGGAATTCATGGCATTTGAGAATGCA-3′, and Rev_PvraSRL, 5′-CGGGATCCACGTTCAACATAGTTCATAAC-3′ (EcoRI and BamHI sites are italicized in the sequences). To make the PvraSRL R1DM3 and PvraSRL R2SM1 mutants, we used the same mutagenic primers used for the R1DM3 and R2SM1 PvraSR mutants (see Table S1 in the supplemental material). The in vitro transcription reactions were performed as previously described, with some modifications (10). The DNA template (5 nM) was incubated with VraR or VraR-P (5 μM) in transcription buffer (40 mM Tris at pH 7.5, 150 mM KCl, 10 mM MgCl2, 2 mM DTT, 100 μg/ml bovine serum albumin [BSA], and 0.05% Triton X-100) at 30°C for 20 min. One unit of E. coli RNAP (1 μg) was added to the mixture, and the reaction mixtures were incubated for another 20 min at 30°C. A control reaction mixture containing only RNAP (without the VraR proteins) was prepared similarly. Transcription was initiated by addition of a 3-μl nucleoside triphosphate (NTP) mix containing 1 mM ATP, 1 mM CTP, 1 mM GTP, 100 μM UTP, 2 μCi [α-32P]UTP, 600 μg/μl heparin, and murine RNase inhibitor (40 U/μl). The reaction mixtures were placed at 30°C for 20 min and then terminated by addition of 5 μl transcription stop buffer (20 mM EDTA, 1% SDS, 1 mg bromophenol blue, 1 mg xylene cyanol, and 90% formamide). The samples were heated at 90°C for 5 min and immediately loaded into an 8% polyacrylamide gel containing 7 M urea. The φX174 DNA/HinfI-dephosphorylated DNA fragments (Promega) labeled with [γ-32P]ATP (3,000 Ci/mmol) were used as molecular weight markers. The gels were dried, exposed on a phosphor screen, and visualized with a Typhoon Trio+ variable-mode imager. The intensity of the resulting transcripts was measured using ImageJ software (National Institutes of Health).
To investigate whether S. aureus SigA activates transcription specifically from the vraSR promoter, we performed in vitro runoff transcription assays. In these experiments, the surrogate RNAP haloenzyme is formed between S. aureus SigA and the E. coli RNAP core enzyme using excess SigA (10, 20, and 25 molar excess). The reaction mixtures were prepared as follows. The DNA template (5 nM) was incubated with SigA at different concentrations (2 μM, 4 μM, and 8 μM) and VraR (5 μM) in the transcription buffer (40 mM Tris at pH 7.5, 150 mM KCl, 10 mM MgCl2, 2 mM DTT, 100 μg/ml BSA, and 0.05% Triton X-100) for 5 min at 30°C. One unit of E. coli core polymerase, which lacks the E. coli sigma subunit, was added (0.2 μM), and the reaction mixture (10 μl) was incubated for an additional 20 min at 30°C. Control reaction mixtures containing core polymerase but not SigA and VraR were prepared in a similar way.
Determination of the VraR concentration in S. aureus RN4220.
Whole-cell extracts were prepared as follows. An overnight seed culture of S. aureus strain RN4220 was prepared in 5 ml tryptic soy broth (TSB) medium. A 1-ml aliquot of the seed culture was inoculated in 100 ml TSB medium, and the cells were grown at 37°C to an OD at 600 nm (OD600) of 0.8 and then harvested by low-speed centrifugation (2,500 × g, 10 min). The weight of the resulting pellet was measured, and the cells were resuspended in 3 ml of 50 mM Tris, pH 7.0, and 5 mM MgCl2. The cells were lysed by incubation with 8 μg/ml lysostaphin for 30 min at 37°C. Subsequently, DNase I (1 U/ml) was added, and the cells were incubated for another 10 min at 37°C. The cell content was liberated by sonication. A cocktail of protease inhibitors (Roche) was added, and the cell lysates were stored at −80°C. Preparation of cell extracts from oxacillin-induced cells was carried out by a similar procedure. At an OD600 of 0.8, the cells were incubated with 20 μg/ml oxacillin for 20 or 40 min at 37°C, after which the cells were harvested and cell lysates obtained, as described above. The protein concentrations in the isolated total cell lysates from uninduced and oxacillin-induced cells were estimated by the Bradford assay (3).
Cell counts in the uninduced and oxacillin-induced cell cultures were determined by plating serial dilutions of cells on TSB/agar plates. The plates were incubated for 12 h at 37°C, and the number of resulting colonies was counted.
VraR was detected using a monoclonal antibody, referred to as anti-VraR (GenScript), by Western blotting. Samples of total cell lysates (1.6 mg) from uninduced or oxacillin-induced cells were prepared in a total volume of 15 μl. In addition, samples of purified VraR at five different concentrations ranging from 1 to 5 μg were prepared at a final volume of 15 μl. All samples were mixed with 5 μl 5× SDS loading dye and loaded onto 15% SDS-polyacrylamide gels. The proteins then were electrotransferred onto Hybond-P polyvinylidene difluoride (PVDF) membranes (GE Healthcare) at 48 mA for 45 min at 4°C. The proteins were detected by immunoblotting with anti-VraR (dilution of 1:10,000), followed by anti-rabbit IgG antibody conjugated to horseradish peroxidase (1:2,500). Proteins were visualized by addition of a 3,3′,5,5′-tetramethylbenzidine (TMB) liquid substrate system (Sigma-Aldrich). Band intensities for VraR standards and the VraR proteins from cell lysates were measured by ImageJ software. Subsequently, a standard curve of VraR concentrations was generated by plotting the intensity of the VraR bands against the VraR concentration. The concentration of VraR in the cell lysates was determined from the standard curve.
Construction of luxABCDE fusion vectors from variants of the vraSR operon control region.
The DNA sequence derived from the vraSR operon control region, which encompasses nucleotides −121 to +26, was amplified by PCR using the genomic DNA of S. aureus RN4220 as a template and was cloned in the blunt-end vector pSTBlue-1 as previously described (2). The resulting plasmid was named pSTblue-1::PvraSR. The pSTblue-1:PvraSR plasmid was used as a template in the construction of the PvraSR mutants using the QuikChange mutagenesis kit (Stratagene). The sequences of the mutagenic primers used are provided in Table S1 in the supplemental material.
After mutagenesis, the DNA fragments were excised from the pSTBlue-1 fusion plasmids with the restriction enzymes EcoRI and BamHI. These amplicons are here referred to as PvraSRR1C67T, PvraSRR1G62T, PvraSRR1C67T/G62T, PvraSRR1G58T, PvraSRR1G52T, PvraSRR1G58T/C52T, PvraSRR1+1A, PvraSRR1+2A, and PvraSRR2C43A, PvraSRR2C31A, PvraSRR2G25A, PvraSRR2C43A/G38A, PvraSRR2G38A, PvraSRR2C31A/G25A, PvraSRR3G85T/C79T, and PvraSRR3C73T/G69. The fragments were gel purified and cloned in the pXEN1 vector (12). The putative positive clones were confirmed to harbor the insertions by sequencing the plasmid with a reverse primer, 5′-GTAAGCAAAAGTTTCCAAATTTCAT-3′, derived from the luxA sequence, and the forward primer was used to amplify the insertion. The pXEN1 plasmid carrying PvraSR is referred to as the lux fusion plasmid (PvraSRR1C67T::lux, PvraSRR1G62T::lux, PvraSRR1G58T::lux, PvraSRR1G52T::lux, PvraSRR1G58T/C52T::lux, PvraSRR1+1A::lux, PvraSRR1+2A::lux, PvraSRR2C43A::lux, PvraSRR2C31A::lux, PvraSRR2G25A::lux, PvraSRR2C43A/G38A::lux, PvraSRR2G38A::lux, PvraSRR2C31A/G25A::lux, PvraSRR3G85T/C79T::lux, and PvraSRR3C73T/G69::lux). Each lux fusion plasmid was introduced into restriction-deficient S. aureus strain RN4220 by electroporation (29). The transformants were plated on TSB/agar plates supplemented with 5 μg/ml chloramphenicol. The putative positive colonies were confirmed by sequencing using the primers listed above. The S. aureus RN4220 strain carrying a lux fusion plasmid is referred to as the lux fusion strain, as follows: RN(PvraSR R1C67T::lux), PvraSRR1G62T::lux), RN(PvraSRR1G58T::lux), RN(PvraSRR1G52T::lux), RN(PvraSRR1G58T/C52T::lux), RN(PvraSRR1+1A::lux), RN(PvraSRR1+2A::lux), RN(PvraSRR2C43A::lux), RN(PvraSRR2C31A::lux), RN(PvraSRR2G25A::lux), RN(PvraSRR2C43A/G38A::lux), RN(PvraSRR2C31A/G25A::lux), RN(PvraSRR3G85T/C79T::lux), and RN(PvraSRR3C73T/G69::lux).
The effect that each lux fusion plasmid had on the growth of S. aureus was investigated by monitoring the bacterial growth profiles for all the strains. Briefly, lux fusion strains and RN(::lux) were inoculated into TSB and grown overnight with 5 μg/ml chloramphenicol at 37°C. Next, 1% culture was inoculated in fresh TSB supplemented with 5 μg/ml chloramphenicol. The OD620 of all cultures was measured at 1-h intervals for the next 5 h.
Measurement of bioluminescence from S. aureus strains.
After overnight growth, the wild-type strain RN(PvraSR::lux) and the strains harboring the lux fusion plasmids were diluted into fresh TSB and cultured at 37°C with shaking at 200 rpm. The strains were grown to an OD620 of ∼0.4 and were subsequently subjected to oxacillin at 10 μg/ml for 1 h. The OD620 value was recorded for all samples. The cell cultures with higher OD620 values were diluted to achieve the same cell density in each cell culture. A 300-μl aliquot from each sample (in triplicate) was transferred to an opaque 96-well Optiplate and analyzed by Fluoroskan Ascent FL 2.5 (Thermo LabSystems). Bioluminescence was measured immediately after dispensing the samples into the plates. The signal was measured for 1 min over a period of 10 min, with integral measurement for 100 ms at a 1-mm luminescence height. The data points collected over 10 min were averaged for each strain, and the oxacillin concentration and the standard deviations were determined for each sample from three independent measurements. For statistical evaluation, data obtained from three experiments were pooled and analyzed using Student's t tests. P values of less than 0.05 were regarded as significant.
Viability testing of the cultures.
Overnight seed cultures of the wild-type strain, lux fusion strains, and RN(::lux) were inoculated in TSB (at 1%) containing 5 μg/ml chloramphenicol. When the OD620 of the cell cultures reached ∼0.4, oxacillin was added to each culture to a final concentration of 10 μg/ml, and the cell cultures were grown for an additional 1 h. The OD620 value of each culture was normalized to those of the samples with the lowest density. A 5-μl aliquot from each induced and uninduced cell culture was diluted 50,000-fold in TSB to remove the antibiotic. Subsequently, a 25-μl aliquot from each diluted cell culture sample was plated on a TSB/agar plate without antibiotics. Cells were allowed to grow at 37°C. These experiments were repeated three times.
RESULTS
Binding of VraR and VraR-P to the target DNA, as assessed by EMSA.
The binding curves obtained from the EMSA data were fitted using the equation shown above. The determined dissociation constants represent the apparent values as we are investigating the VraR binding to the vraSR promoter region, which has been proposed (2) to harbor more than one binding site (Table 1). The Hill coefficient was determined from the experimental data fitting to the equation shown above. For all the DNA sequences analyzed, the calculated Hill coefficient was bigger than 1, with an average value of 2.2 ± 0.5, indicating cooperativity between the putative binding sites. The binding capacity of the DNA (“Cap” in equation shown above) depended on the mutation of the DNA and the phosphorylation state of VraR. Overall, mutation of the R1 site not only had an effect on the binding affinity of the VraR to DNA but also decreased the binding capacity for unphosphorylated VraR to 60 and 70%. Similar observations on the mutations in the R2 and R3 sites were made, whereby the binding capacity was decreased to 80%. In contrast, mutation of the target DNA did not affect the binding capacity for phosphorylated VraR (see Fig. S1 to S5 in the supplemental material).
Table 1.
Apparent dissociation constants of VraR and VraR-P, with PvraSR variants determined from the EMSA experimentsa
| Variant | Apparent Kd (μM) |
|
|---|---|---|
| VraR | VraR-Pb | |
| Wild type | 4.1 ± 0.5 | 1.7 ± 0.1 |
| PvraSRR1C67T | 7.1 ± 0.5 | 2.2 ± 0.4 |
| PvraSRR1C67T/G62T (R1DM3) | 9.0 ± 0.4 | 5.9 ± 0.5 |
| PvraSRR1G58T | 3.9 ± 0.5 | 3.6 ± 0.1 |
| PvraSRR1C52T | 6.1 ± 0.4 | 4.4 ± 0.3 |
| PvraSRR1G58T/C52T (R1DM4) | 7.5 ± 0.4 | 5.0 ± 0.3 |
| PvraSRR1+1A | 8.8 ± 0.4 | 4.2 ± 0.4 |
| PvraSRR1+2A | 11 ± 1.1 | 4.8 ± 0.4 |
| PvraSRR1+3A | 12.0 ± 0.6 | 5.4 ± 0.2 |
| PvraSRR2G38A (R2SM1) | 4.2 ± 0.2 | 2.8 ± 0.3 |
| PvraSRR2C43A | 5.4 ± 0.3 | 4.9 ± 0.1 |
| PvraSRR2C43A/G38A | 5.2 ± 0.3 | 4.8 ± 0.5 |
| PvraSRR2C31A | 4.2 ± 0.2 | 3.0 ± 0.1 |
| PvraSRR2G25A | 4.4 ± 0.2 | 4.0 ± 0.3 |
| PvraSRR2C31A/G25A | 5.4 ± 0.3 | 4.3 ± 0.6 |
| PvraSRR3G85T/C79T | 3.8 ± 0.3 | 2.1 ± 0.4 |
| PvraSRR3C73T/G69T | 5.4 ± 0.3 | 3.9 ± 0.6 |
The Hill coefficient was determined to be >1 in all the cases.
The phosphorylation level of VraR is 46% in these experiments.
Mutation of the R1 site at position C67 or C52 affected the binding of VraR and VraR-P to PvraSR the most, while mutation of the G62 or G58 position at this site had little to no effect on the binding of unphosphorylated and phosphorylated VraR to PvraSR. The double mutations carried out on the R1a and R1b sites confirm the significance of the C67 and C52 positions in binding of VraR and VraR-P to PvraSR. Separation of the R1a and R1b sites by insertion of one to three base pairs decreased the binding affinities of VraR and Vra-P to PvraSR by 2.5 to 3-fold (Table 1).
Mutation of the R2 site had the largest effect on the binding of VraR-P to PVraSR. This was expected, as we showed earlier that unphosphorylated VraR does not bind to the R2 site (2). In particular, mutation of the R2a site at the C43 position decreased binding affinity of phosphorylated VraR by ∼3-fold. Addition of a second mutation at this site (from G38 to A) did not reduce the binding affinity further. Mutation of the R2b site had slightly less of an effect on the binding of VraR-P to PvraSR; mutations of C31 and G25 decreased the binding affinity of VraR-P by 1.8- and 2.4-fold, respectively. Double mutation at the R2a (C43A G38A) and R2b (C31A G25A) sites decreased the binding affinity of VraR-P to PvraSR by 2.8- and 2.5-fold, respectively. Mutation of the R3 site did not affect binding of VraR to PvraSR, with the exception of double mutations at the C73 and G69 positions, whereby the binding affinity was reduced by 2-fold.
DNase I footprinting experiments.
DNase I footprinting experiments provided a sensitive and direct means to explore further the binding mode of VraR and VraR-P to PvraSR. Mutation of the R1a site (C67T G62T) prevented binding of VraR-P not only to the R1 site but also to the R2 site (Fig. 2)—these experiments were not carried out with the unphosphorylated VraR protein, as under these conditions, VraR does not bind to the R2 site (2). Similar observations were also made with the PvraSR+1A, PvraSR+2A and PvraSR+3A mutants. Herein, we observed a progressive decrease in the binding affinity of VraR and VraR-P to the R1 site as the distance between the R1a and R1b sites increased from 1 to 3 extra base pairs. The decrease in the binding affinity of VraR-P for the R2 site parallels that for the R1 site. In contrast, mutation in the R2 site (R2SM1 mutant) affected to a greater degree the binding of VraR-P to the R2 site than to R1 (Fig. 2). Overall, these observations indicate that there is communication between these two VraR binding sites, with R1 being essential for binding of VraR to the R2 site but not vice versa. The effect that mutation of the R1 site has on the binding of VraR to this site as well to the R2 site is observed for both strands; the DNase I footprinting experiments with R1DM3 and R2SM1 were carried out by 32P end labeling of the top strand, and the experiments with PvraSR+1A, PvraSR+2A, and PvraSR+3A were carried out by 32P end labeling of the bottom strand (Fig. 2 and 3).
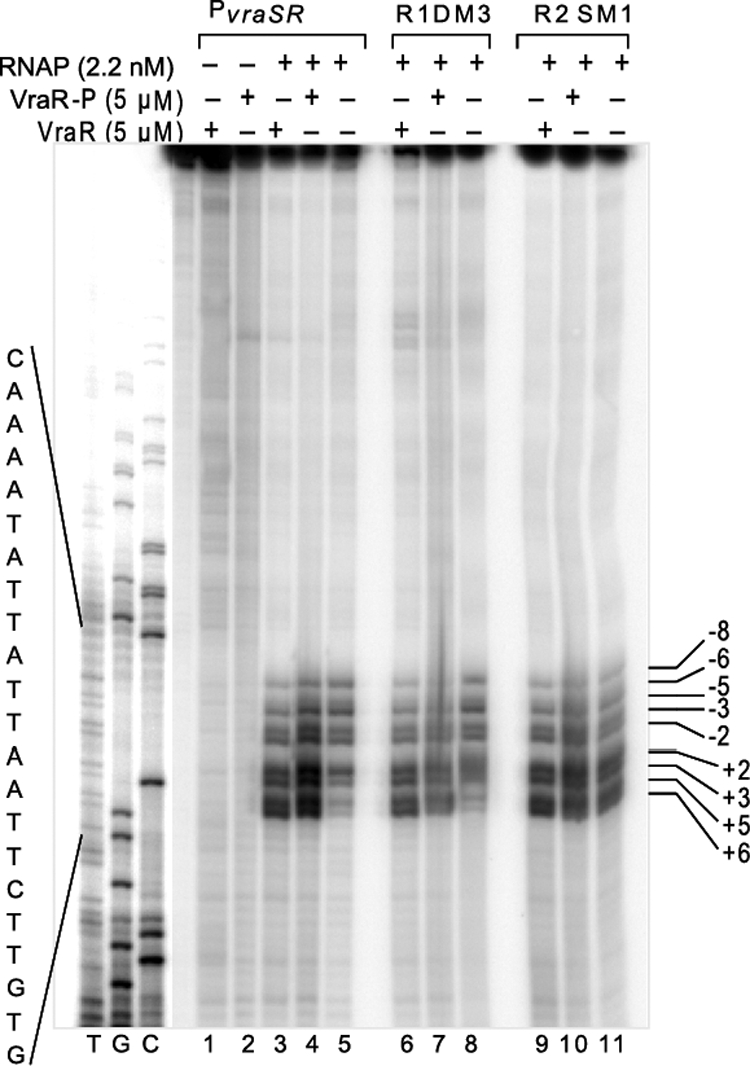
Fig 2.

DNase I footprint of VraR-P on the PvraSR R1DM3 and R2SM1 variants. The top strands of PvraSR, PvraSR R1DM3, and PvraSR R2SM1 were end labeled with [γ-32P]ATP. The binding reaction mixtures consisted of VraR-P and 10 ng DNA. After treatment with DNase I, the resulting DNA fragments were separated on an 8% polyacrylamide sequencing gel containing 7 M urea. The positions of the nucleotides, as indicated by the numbers, were calibrated with respect to the transcription start position. WT, wild type.
Fig 3.

DNase I footprints of VraR and VraR-P on the PvraSRR1+1A, -R1+2A, and -R1+3A variants. The bottom strand of each PvraSR variant was end labeled with [γ-32P]ATP and incubated with VraR or VraR-P at 2 or 5 μM. After treatment with DNase I, the resulting DNA fragments were separated on an 8% polyacrylamide sequencing gel containing 7 M urea. The C and G sequencing reactions were calibrated with respect to the transcription start point.
In vivo experiments using a lux reporter vector.
The effects that the mutations of the putative VraR binding sites had on the binding affinity of VraR for the PvraSR were investigated in vivo using a lux reporter vector under stress conditions induced by 10 μg/μl oxacillin. The lux reporter vector enables cloning of the target operon control region upstream of the lux operon by putting expression of the lux operon under the direct control of the target DNA sequence (12). Fusion of PvraSR upstream of the lux operon resulted in the increase of the luminescent signal of S. aureus RN4220 by ∼200-fold in the presence of 10 μg/ml oxacillin (see Fig. S7 in the supplemental material). The effects that mutations on the R1 and R2 sites had on the luminescence signal of S. aureus RN4220 mirrored those observed by EMSA and DNase I footprinting (Fig. 4).
Fig 4.

In vivo investigation of the role of R1 and R2 in the transcriptional mechanism of VraR. The bioluminescence signals obtained from S. aureus strains in the presence of 10 μg/ml oxacillin are depicted. Each strain is represented by the name of the promoter fused upstream of the lux operon in the pXEN1 plasmid. Standard deviations were calculated from three independent experiments. The viability experiments showed that the effect of oxacillin on the bacterial growth (number of CFU) was the same for all examined strains (data not shown). RLU, relative light units.
Double mutation of the R1a site (C67T G62T) decreased the lux expression by 9-fold, compared to a 1.4-fold decrease observed for the double mutation of the R1b site. A similar effect from the mutation of the R2 site was measured, whereby we observed a 15-fold decrease in the luminescence signal as a result of the double mutation of the R2a site compared to a 1.2-fold decrease caused by the mutation of the R2b site. Furthermore, the increase of the distance between the R1a and R1b sites had the highest effect on the lux operon expression; we measured a 72-fold decrease in the luminescence signal for the PvraSR+1A mutant and 102-fold decrease for the PvraSR+2A mutant. In fact, expression of the lux operon measured for these mutants was below the expression levels measured in the case of intact PvraSR and in the absence of oxacillin (see Fig. S7 in the supplemental material).
In vitro transcription experiments.
We used the vraSR operon control region stretching from nucleotides −462 to +150, referred to as PvraSRL in the in vitro transcription experiments. In addition, taking advantage of the conserved nature of the RNA polymerase (RNAP) among Gram-negative and -positive organisms, we used the RNAP from E. coli as a substitute for the RNAP of S. aureus.
Runoff in vitro transcription assays revealed that the E. coli RNAP-σ70 complex, referred to as RNAP holoenzyme (RNAPEh), was capable of initiating transcription from PvraSRL (Fig. 5A). The detected transcript product was identified as a 160-nucleotide fragment, which is the expected size because the transcription start position is located 160 bp from the 3′ end of the linear template DNA used. The same experiments were carried out with the S. aureus SigA factor and E. coli RNAP core enzyme (RNAPEc), and the results were indistinguishable from those of the experiments with the RNAPEh (Fig. 5B). In these experiments, the amount of transcript increased with the increase of the SigA concentration in the assay, and removal of the SigA factor or VraR-P from the reaction mixture produced no transcript. Isolation of the SigA factor was challenging. Hence, we used σ70 of E. coli as a substitute for SigA of S. aureus to investigate VraR interaction with the transcription machinery.
Fig 5.

Runoff in vitro transcription assays with E. coli RNAP holoenzyme, using PvraSRL as a template (A), and E. coli RNAP haloenzyme, E. coli RNAP core enzyme, and S. aureus SigA in the presence of VraR-P, using PvraSRL as a template (B). The SigA concentrations in lanes 2 to 5 are 2, 4, 8, and 8 μM, respectively. The sizes of the transcription products were determined using the molecular weight marker φX174DNA/HinfI and the 160-bp DNA fragment (lane 1).
The runoff in vitro transcription experiments with RNAPEh showed that the presence of VraR or VraR-P increased the amount of transcript by 2- and 4-fold, respectively (Fig. 6A). In addition, the in vitro transcription assays exhibited a dose-dependent response to the VraR-P concentration (Fig. 6B), which reached saturation at 6 μM VraR-P. We also investigated the effects of mutations in the R1 and R2 sites on the activity of the vraSR operon (Fig. 6C). These studies indicated a clear decrease in the transcription product when either site was mutated, which is in good agreement with the DNase I footprinting experiments (Fig. 2) and in vivo studies (Fig. 3).
Fig 6.

(A) Role of RNAP haloenzyme and phosphorylation of VraR in the transcription of the vraSR operon (the error bars represent the standard deviations calculated from three independent experiments). (B) Effect of VraR-P concentration on runoff in vitro transcription (error bars represent the standard deviations calculated from three independent experiments). (C) Role of intact R1 and R2 sites in transcription of the vraSR operon. The reactions were performed in the presence of VraR-P (6 μM) or VraR (6 μM). The sizes of the transcription products were determined using the φX174DNA/HinfI molecular weight marker.
Specific binding of RNAPEh to PvraSR was confirmed by DNase I footprinting experiments. These experiments show that RNAPEh alone binds weakly to PvraSR (Fig. 7). Binding of RNAPEh at the −57 to +15 nucleotide region of PvraSR was associated with the appearance of a hypersensitive site at −24 in both strands and −6 in the top strand. The presence of VraR-P enhanced the binding of the RNAPE holoenzyme to PvraSR by at least 5-fold, especially in the region from nucleotides −34 to −24 (Fig. 7A). In addition, the presence of VraR-P enhanced DNase I cleavage at the −24 site. Furthermore, we investigated binding of SigA to PvraSR by EMSA. These studies showed that SigA alone does not bind to the vraSR promoter region (Fig. 8A). However, in the presence of VraR and more so in the presence of VraR-P, the presence of SigA introduces a supershift in the EMSA experiments. This could be due to the binding of SigA to VraR (Fig. 8C).
Fig 7.

DNase I footprint of the RNAP holoenzyme on PvraSR in the presence or absence of VraR or VraR-P. Top strand (A) and bottom strand (B) of 32P-end-labeled PvraSR. The binding reaction mixtures included 10 ng DNA and proteins at the indicated concentrations. The regions protected by VraR-P are indicated with solid lines. The regions protected by RNAP are indicated with dashed lines. The region of DNA protected by RNAP in the presence of VraR-P is marked with a double line. The hypersensitive regions induced by RNAP are indicated by gray arrowheads, and the hypersensitive regions caused by VraR-P are indicated by black arrowheads.
Fig 8.

Investigation of SigA binding to PvraSR in the absence of VraR (A), the presence of unphosphorylated VraR (B), and the presence of phosphorylated VraR (C).
We performed KMnO4 footprinting experiments to determine the mechanism by which binding of VraR to PvraSR will benefit the transcription process. This assay enables investigation of promoter melting at the onset of transcription initiation. Potassium permanganate reacts specifically with thymine residues in single-stranded DNA regions formed during the formation of the RNAP-open promoter complex (28). We observed that RNAPEh alone is able to form an open promoter complex at PvraSR (Fig. 9; see also Fig. S8 in the supplemental material). The transition of RNAPEh-PvraSR from a closed promoter complex to an open promoter complex was stimulated in the presence of VraR and even more so by VraR-P, in agreement with the in vitro transcription assay results. Mutation of the R1 or R2 site decreased the extent of the promoter melting (Fig. S8).
Fig 9.
Investigation of the VraR transcriptional activation mechanism by KMnO4 footprinting assays. (A) Formation of the open promoter complex on the PvraSR, PvraSR R1DM3, and PvraSR R2SM1 sequences in the presence or absence of VraR or VraR-P. Briefly, each 32P-end-labeled DNA sequence was incubated with the proteins, and the formed complexes were treated with 20 mM KMnO4 for 30 s, after which the modified thymine residues were cleaved by 1 M piperidine at 90°C for 30 min. The samples were loaded onto an 8% sequencing gel.
Determination of the VraR concentration in S. aureus RN4220.
Using a monoclonal antibody against VraR, we determined the VraR concentration in S. aureus RN4220 in the absence or presence of 20 μg/ml oxacillin after 20 and 40 min. These experiments showed that concentration of VraR increased from 2,830 ± 637 molecules (2.3 μM) to 7,265 ± 989 molecules (6 μM) and 12,368 ± 1097 molecules (10 μM) when exposed to oxacillin for 20 and 40 min, respectively. The concentration of VraR in the absence of stress is in agreement with those determined for OmpR (3,500 molecules) (9) and CheY (6,000 molecules) (17). The increase in the VraR concentration in our study is in agreement with the maximum increase in the in vitro transcription product observed at 6 μM VraR-P and the reported 3.8-fold increase in the β-galactosidase activity of the PvraSR::lacZ reporter vector when S. aureus was subjected to 1.2 μg/ml oxacillin for 30 min (31).
DISCUSSION
VraR mode of binding to the vraSR operon control region.
Recently, we showed that VraR binds to its promoter (Fig. 1) (2). Two nucleotides in particular, C and G, were observed to be 4 or 5 residues apart in each VraR binding site. We proposed the putative VraR binding sequence to be ACT(X)nAGT, where n is 2 or 3 (2). Each site has two copies of this sequence arranged in tandem. Hence, it was proposed that VraR binds as a dimer to these sites. In this study, we investigated the mode of VraR binding to PvraSR by mutating the C or G residues in these sites to T or A singly or in combination and increasing the distance between the two tandem VraR binding sequences by 1, 2, or 3 bp. The mutations were carried out in the context of full-length PvraSR (nucleotides −126 to +10).
Mutation of C or G at either R1 or R2, but not R3, affected binding of VraR to DNA either in vitro or in vivo (Table 1 and Fig. 2 and 3; see also Fig. S1 to S4 in the supplemental material). These observations demonstrate that the R1 and R2 sites are the VraR binding sites in PvraSR. Further, the mutagenesis studies showed that mutation of C67 (R1a) or C52 (R1b) had the strongest effect on the binding of VraR and VraR-P to PvraSR compared to that of G62 (R1a) and G58 (R1b). These results suggest that C67 and C52 are important for VraR binding to each subsite in R1. They also indicate that there is directionality in VraR binding to R1, whereby VraR binds to DNA in a C-to-G direction (Fig. 1).
Double mutations of C and G in each subsite of R1 affected VraR binding differently, with C67T G62T mutation causing the highest decrease in the VraR and VraR-P binding affinities to PvraSR (Table 1). This observation suggests that a hierarchy exists in VraR binding within the R1 site itself, whereby VraR binds first to the R1a site. The in vitro findings are corroborated by in vivo studies (Fig. 4), which showed that mutation in the R1a site had a greater effect on lux expression (9-fold decrease) than mutation in the R1b site (1.4-fold decrease). Hierarchical binding was also observed in the R2 site. A single point mutation in the R2a site, C43A, decreased lux expression by 15-fold, as opposed to the 1.2-fold decrease measured with other mutants in this site (Fig. 4). As determined by looking carefully at the R1 and R2 sites, the C and G are separated by 4 bp in the R1a and R2a subsites versus 5 bp in the R1b and R2b subsites. It is possible that the difference in distance between C and G in each subsite could be the determining factor for the observed difference in the binding affinity to VraR.
The observed hierarchy in VraR binding to PvraSR suggests that occupation of each VraR binding site in PvraSR could be a two-step event (i.e., one molecule of VraR binds first to the Ra subsite, and then a second molecule of VraR binds to the Rb subsite). The advantage of this binding model becomes apparent when considering the close proximity of R1a to R1b (they are separated by a single base pair) and the directionality in binding imposed by cytosines. Both of these factors could drive the dimerization of VraR without the need for phosphorylation in the R1 site, which is in agreement with the earlier observations that phosphorylation of VraR did not have a significant effect on the binding of VraR to the R1 site alone [Kd(VraR)R1 = 4.0 ± 0.4 μM; Kd(VraR-P)R1 = 2.7 ± 0.9 μM] (2). This in turn suggests that unphosphorylated VraR binds to its promoter and mediates its expression in the absence of cell wall stress. Our hypothesis is in agreement with the measured vraSR background expression in the absence of stress (22).
To test the hypothesis that VraR binding to R1 is phosphorylation independent (i.e., dimerization is driven by close proximity of R1a and R1b), we generated PvraSR mutants in which the distance between the R1a and R1b subsites was increased by insertion of 1, 2, or 3 bp (e.g., ACTAAAGTaaaTGAACATCA; lowercase letters indicate the inserted nucleotides, and boldface letters indicate the nucleotides involved in binding VraR) and R2 was left intact. The in vivo studies (Fig. 4) indicated that 1- and 2-bp insertions between the R1a and R1b subsites had a dramatic effect on lux expression. We measured 72- and 102-fold decreases in bioluminescence for PvraSRR1+1A and PvraSRR1+2A, respectively. In addition, the background expression level (uninduced strain) was affected by these mutations (see Fig. S7 in the supplemental material). Interestingly, phosphorylation rescued the binding of VraR to the R1 site by 50% in the case of a single-base-pair insertion (Fig. 3) but not in the case of 2- and 3-bp insertions. This observation suggests that a preformed VraR dimer (through phosphorylation) is able to overcome the increased distance between R1a and R1b. In addition, it supports our hypothesis that the close proximity of these two subsites induces dimerization of unphosphorylated VraR to R1.
Investigation of PvraSR mutants by DNase I footprinting (Fig. 2 and 3) consistently showed that mutation of the R1 site had a greater effect on the binding of VraR to the R2 site than mutation of the R2 site on VraR binding to the R1 site. These observations indicate that there is strong communication between the R1 and R2 sites in PvraSR and that an intact R1 site is essential for binding of VraR to the R2 site but not vice versa.
Overall, our investigation of the PvraSR mutants showed that the VraR binding site is composed of two tandem arrayed sequences. In the R1 site, the orientation and distance of these two sequences mediates VraR dimerization in a phosphorylation-independent manner. The observed higher binding affinity of VraR for this site could also serve as a means of recruitment of VraR to the less conserved binding site, R2 (i.e., the presence of VraR bound to the R1 site could serve as a “flag” for the phosphorylated VraR to bind to a site that is less recognizable due to its lack of conserved sequence). The implication of these findings is as follows. In the absence of stress, the DNA sequence of the vraSR promoter region facilitates binding of unphosphorylated VraR to enable low-level expression of the vraSR operon. This event does not require phosphorylation, as dimerization is DNA assisted. In the presence of cell wall stress, the already bound VraR will serve as the recognition point for phosphorylated (and dimerized) VraR to bind to the less conserved R2 site of the promoter and mediate higher-level expression of the vraSR operon.
Bridge between VraR and the transcription machinery: role of the SigA factor.
It has been generally accepted that VraR regulates expression of its own operon. The in vitro transcription studies were used to explore the mechanism through which VraR affects the transcription machinery and identify the factor(s) involved in regulation of the vraSR operon.
We used the RNA polymerase (RNAP) from E. coli as a substitute for the RNAP of S. aureus, taking advantage of the conserved nature of the RNA polymerase among Gram-negative and -positive organisms. Several factors, listed below, suggest that the sigma factor required for the regulation of vraSR operon is similar to E. coli σ70. First, the −10 box in PvraSR (Fig. 1), represented by 5′-TTATAA-3′, is highly similar to the conserved −10 motif reported for E. coli σ70 (5′-TATAAT-3′) (8). Second, the putative −35 box (5′-TTCATA-3′) shares significant sequence similarities with the −35 motif recognized by E. coli σ70 (5′-TTGACA-3′) (8, 24). Third, the −10 and −35 boxes in PvraSR are separated by 17 nucleotides, a feature that is shared by the E. coli σ70-regulated promoters (33).
Investigation of the S. aureus genome indicated that this organism has three sigma factors, the primary sigma factor (SigA), the alternate sigma factor (SigB), and SigH, involved in the regulation of genetic competence genes (10, 20, 26, 34). Sequence alignments of SigA, E. coli σ70, and Bacillus subtilis SigA indicate that they share large sequence similarities, especially in the two regions implicated in anchoring the sigma factor to the DNA and docking it to the polymerase core-binding domain (see Fig. S6 in the supplemental material). Based on this evidence, we propose that SigA is involved in regulation of the vraSR operon. Additional evidence for this hypothesis comes from the work of Galbusera et al. and Boyle-Vavra et al., which showed that the inactivation of SigB does not affect the activity of the vraSR operon (6, 13).
The runoff in vitro transcription assays revealed that the E. coli RNAP holoenzyme (RNAPEh) was capable of initiating transcription from PvraSRL (Fig. 5A). Substitution of the SigA factor of S. aureus for the E. coli σ70 factor in the RNAP haloenzyme produced indistinguishable results (Fig. 5B). Furthermore, formation of the transcript product was sensitive to the presence of SigA and VraR-P and the SigA concentration; removal of the SigA factor or VraR-P from the reaction mixture produced no transcript. The formation of the transcript (in the presence of RNAPEh) also depended on the VraR and VraR-P concentrations, reaching a maximum at 6 μM VraR-P. Incidentally, the in vivo concentration of VraR in the presence of cell wall stress is 6 μM. These results strongly indicate formation of a specific complex between the surrogate RNAP haloenzyme (RNAPEc-SigA) and the PvraSR promoter in the presence of VraR; hence, SigA is likely to be involved in regulation of the vraSR operon. This also serves as evidence that SigA and E. coli σ70 are functionally indistinguishable; hence, the RNAP haloenzyme from E. coli (in complex with σ70) is a good substitute for the S. aureus RNAP haloenzyme (in complex with SigA).
The specificity of the RNAPEh interaction with PvraSR was further corroborated by the DNase I footprinting experiments. RNAPEh alone bound weakly to PvraSR (Fig. 7); however, the presence of VraR-P enhanced the binding of RNAPEh to PvraSR by 5-fold, especially in the region encompassing nucleotides −34 to −24. The enhanced interaction of RNAPEh with PvraSR could result from a direct interaction of VraR-P with SigA. Investigation of the SigA binding to PvraSR in the presence and absence of VraR-P indicates that SigA may interact with VraR (Fig. 8). Furthermore, the KMnO4 footprinting experiments revealed that the transition of RNAPEh-PvraSR from a closed promoter complex to an open promoter complex was stimulated in the presence of VraR, and even more so by VraR-P, in agreement with the in vitro transcription assay results. This stimulation could happen as a result of the establishment of additional contacts for the RNAP holoenzyme on the promoter through the interaction of VraR-P with SigA. A similar role has been suggested for BvgA polymerase binding to ptx and fha promoters in Bordetella pertussis (4).
Transcription factors are known to interact with RNAP holoenzyme (18). Based on the type of interactions in which they are involved, these factors are divided into two classes. Class I factors, such as BvgA (5), Sp0A (30), and OmpR (27), interact with the C-terminal domain of the α subunit of RNAP (αCTD). Class II factors, such as PhoB (23) and VanRB (11), have been shown to interact with the σ subunit of RNAP. In this context, it is possible that VraR is a class II factor. The overlap between the VraR and SigA binding sites in the vraSR operon control region certainly supports this hypothesis. Nevertheless, an interaction with the other parts of RNAP (e.g., αCTD) cannot be excluded.
In conclusion, our study demonstrates that VraR binds to two regions centered at nucleotides −60 (R1) and −35 (R2) in the vraSR operon control region. There is a hierarchy in VraR binding to these sites. Specifically, the high-affinity and phosphorylation-independent binding site R1 serves to recruit VraR to the vraSR operon control region under normal growth conditions to mediate basal expression of the operon. On the other hand, cell wall antibiotic stress drives binding of phosphorylated VraR to the low-affinity and phosphorylation-dependent binding site R2, which results in upregulation of the vraSR operon. The phosphorylation independence of VraR binding to R1 is driven by the close proximity of two VraR binding sequences at this site, whereas the distance between the VraR binding sequences in R2 ensures that VraR binds to this site only under stress conditions.
The position of the R2 site is quite strategic in PvraSR, as it overlaps with that of the SigA factor. Our study reveals that VraR-P mediates tight binding of the RNAP holoenzyme to PvraSR and enhances the formation of the RNAP open promoter complex. It is likely that VraR interacts intimately with the RNAP holoenzyme to extend and stabilize the RNAP contacts with DNA and/or to induce topological changes (e.g., DNA bending) in the promoter region. Hence, the sequence and location of R2 enable S. aureus to fine-tune the vraSR operon activity under cell wall stress.
Supplementary Material
ACKNOWLEDGMENTS
We are in debt to David Heinrichs (Western University) for providing the pXEN1 plasmid.
This work was supported by a Discovery Grant to D.G.-K. from the Natural Sciences and Engineering Research Council of Canada and an Early Researcher Award from the Ontario Ministry of Research and Innovation.
Footnotes
Supplemental material for this article may be found at http://jb.asm.org/.
Published ahead of print 21 October 2011
REFERENCES
- 1. Belcheva A, Golemi-Kotra D. 2008. A close-up view of the VraSR two-component system. A mediator of Staphylococcus aureus response to cell wall damage. J. Biol. Chem. 283:12354–12364 [DOI] [PubMed] [Google Scholar]
- 2. Belcheva A, Verma V, Golemi-Kotra D. 2009. DNA-binding activity of the vancomycin resistance associated regulator protein VraR and the role of phosphorylation in transcriptional regulation of the vraSR operon. Biochemistry 48:5592–5601 [DOI] [PubMed] [Google Scholar]
- 3. Bradford MM. 1976. A rapid and sensitive method for the quantitation of microgram quantities of protein utilizing the principle of protein-dye binding. Anal. Biochem. 72:248–254 [DOI] [PubMed] [Google Scholar]
- 4. Boucher PE, Murakami K, Ishihama A, Stibitz S. 1997. Nature of DNA binding and RNA polymerase interaction of the Bordetella pertussis BvgA transcriptional activator at the fha promoter. J. Bacteriol. 179:1755–1763 [DOI] [PMC free article] [PubMed] [Google Scholar]
- 5. Boucher PE, Maris AE, Yang MS, Stibitz S. 2003. The response regulator BvgA and RNA polymerase alpha subunit C-terminal domain bind simultaneously to different faces of the same segment of promoter DNA. Mol. Cell 11:163–173 [DOI] [PubMed] [Google Scholar]
- 6. Boyle-Vavra S, Yin S, Challapalli M, Daum RS. 2003. Transcriptional induction of the penicillin-binding protein 2 gene in Staphylococcus aureus by cell wall-active antibiotics oxacillin and vancomycin. Antimicrob. Agents Chemother. 47:1028–1036 [DOI] [PMC free article] [PubMed] [Google Scholar]
- 7. Boyle-Vavra S, Yin S, Daum RS. 2006. The VraS/VraR two-component regulatory system required for oxacillin resistance in community-acquired methicillin-resistant Staphylococcus aureus. FEMS Microbiol. Lett. 262:163–171 [DOI] [PubMed] [Google Scholar]
- 8. Busby S, Ebright RH. 1994. Promoter structure, promoter recognition, and transcription activation in prokaryotes. Cell 79:743–746 [DOI] [PubMed] [Google Scholar]
- 9. Cai SJ, Inouye M. 2002. EnvZ-OmpR interaction and osmoregulation in Escherichia coli. J. Biol. Chem. 277:24155–24161 [DOI] [PubMed] [Google Scholar]
- 10. Deora R, Misra TK. 1996. Characterization of the primary sigma factor of Staphylococcus aureus. J. Biol. Chem. 271:21828–21834 [DOI] [PubMed] [Google Scholar]
- 11. Depardieu F, Courvalin P, Kolb A. 2005. Binding sites of VanRB and sigma70 RNA polymerase in the vanB vancomycin resistance operon of Enterococcus faecium BM4524. Mol. Microbiol. 57:550–564 [DOI] [PubMed] [Google Scholar]
- 12. Francis KP, et al. 2000. Monitoring bioluminescent Staphylococcus aureus infections in living mice using a novel luxABCDE construct. Infect. Immun. 68:3594–3600 [DOI] [PMC free article] [PubMed] [Google Scholar]
- 13. Galbusera E, et al. 2011. Site-specific mutation of Staphylococcus aureus VraS reveals a crucial role for the VraR-VraS sensor in the emergence of glycopeptide resistance. Antimicrob. Agents Chemother. 55:1008–1020 [DOI] [PMC free article] [PubMed] [Google Scholar]
- 14. Gao R, Mack TR, Stock AM. 2007. Bacterial response regulators: versatile regulatory strategies from common domains. Trends Biochem. Sci. 32:225–234 [DOI] [PMC free article] [PubMed] [Google Scholar]
- 15. Gardete S, Wu SW, Gill S, Tomasz A. 2006. Role of VraSR in antibiotic resistance and antibiotic-induced stress response in Staphylococcus aureus. Antimicrob. Agents Chemother. 50:3424–3434 [DOI] [PMC free article] [PubMed] [Google Scholar]
- 16. Gardner AF, Jack WE. 2002. Acyclic and dideoxy terminator preferences denote divergent sugar recognition by archaeon and Taq DNA polymerases. Nucleic Acids Res. 30:605–613 [DOI] [PMC free article] [PubMed] [Google Scholar]
- 17. Gegner JA, Graham DR, Roth AF, Dahlquist FW. 1992. Assembly of an MCP receptor, CheW, and kinase CheA complex in the bacterial chemotaxis signal transduction pathway. Cell 70:975–982 [DOI] [PubMed] [Google Scholar]
- 18. Ishihama A. 1993. Protein-protein communication within the transcription apparatus. J. Bacteriol. 175:2483–2489 [DOI] [PMC free article] [PubMed] [Google Scholar]
- 19. Kato Y, et al. 2008. Microbiological and clinical study of methicillin-resistant Staphylococcus aureus (MRSA) carrying VraS mutation: changes in susceptibility to glycopeptides and clinical significance. Int. J. Antimicrob. Agents 31:64–70 [DOI] [PubMed] [Google Scholar]
- 20. Kullik I, Giachino P. 1997. The alternative sigma factor sigmaB in Staphylococcus aureus: regulation of the sigB operon in response to growth phase and heat shock. Arch. Microbiol. 167:151–159 [DOI] [PubMed] [Google Scholar]
- 21. Kuroda M, Kuwahara-Arai K, Hiramatsu K. 2000. Identification of the up- and down-regulated genes in vancomycin-resistant Staphylococcus aureus strains Mu3 and Mu50 by cDNA differential hybridization method. Biochem. Biophys. Res. Commun. 269:485–490 [DOI] [PubMed] [Google Scholar]
- 22. Kuroda M, et al. 2003. Two-component system VraSR positively modulates the regulation of cell-wall biosynthesis pathway in Staphylococcus aureus. Mol. Microbiol. 49:807–821 [DOI] [PubMed] [Google Scholar]
- 23. Makino K, et al. 1988. Regulation of the phosphate regulon of Escherichia coli. Activation of pstS transcription by PhoB protein in vitro. J. Mol. Biol. 203:85–95 [DOI] [PubMed] [Google Scholar]
- 24. Marr MT, Roberts JW. 1997. Promoter recognition as measured by binding of polymerase to nontemplate strand oligonucleotide. Science 276:1258–1260 [DOI] [PubMed] [Google Scholar]
- 25. McCallum N, Stutzmann Meier P, Heusser R, Berger-Bachi B. 2011. Mutational analyses of ORFs within the vraSR operon and their roles in the cell wall stress response of Staphylococcus aureus. Antimicrob. Agents Chemother. 55:1391–1402 [DOI] [PMC free article] [PubMed] [Google Scholar]
- 26. Morikawa K, et al. 2003. A new staphylococcal sigma factor in the conserved gene cassette: functional significance and implication for the evolutionary processes. Genes Cells 8:699–712 [DOI] [PubMed] [Google Scholar]
- 27. Okamura H, Hanaoka S, Nagadoi A, Makino K, Nishimura Y. 2000. Structural comparison of the PhoB and OmpR DNA-binding/transactivation domains and the arrangement of PhoB molecules on the phosphate box. J. Mol. Biol. 295:1225–1236 [DOI] [PubMed] [Google Scholar]
- 28. Ross W, Gourse RL. 2009. Analysis of RNA polymerase-promoter complex formation. Methods 47:13–24 [DOI] [PMC free article] [PubMed] [Google Scholar]
- 29. Schenk S, Laddaga RA. 1992. Improved method for electroporation of Staphylococcus aureus. FEMS Microbiol. Lett. 73:133–138 [DOI] [PubMed] [Google Scholar]
- 30. Seredick SD, Spiegelman GB. 2007. Bacillus subtilis RNA polymerase recruits the transcription factor Spo0A approximately P to stabilize a closed complex during transcription initiation. J. Mol. Biol. 366:19–35 [DOI] [PubMed] [Google Scholar]
- 31. Steidl R, et al. 2008. Staphylococcus aureus cell wall stress stimulon gene-lacZ fusion strains: potential for use in screening for cell wall-active antimicrobials. Antimicrob. Agents Chemother. 52:2923–2925 [DOI] [PMC free article] [PubMed] [Google Scholar]
- 32. Tran VK, Oropeza R, Kenney LJ. 2000. A single amino acid substitution in the C terminus of OmpR alters DNA recognition and phosphorylation. J. Mol. Biol. 299:1257–1270 [DOI] [PubMed] [Google Scholar]
- 33. Voskuil MI, Chambliss GH. 1998. The −16 region of Bacillus subtilis and other gram-positive bacterial promoters. Nucleic Acids Res. 26:3584–3590 [DOI] [PMC free article] [PubMed] [Google Scholar]
- 34. Wu S, de Lencastre H, Tomasz A. 1996. Sigma-B, a putative operon encoding alternate sigma factor of Staphylococcus aureus RNA polymerase: molecular cloning and DNA sequencing. J. Bacteriol. 178:6036–6042 [DOI] [PMC free article] [PubMed] [Google Scholar]
Associated Data
This section collects any data citations, data availability statements, or supplementary materials included in this article.