

Abstract
Bacterial cell division relies on the formation and contraction of the Z ring, coordinated and regulated by a dynamic protein complex called the divisome. The cell division factor ZapA interacts directly with FtsZ and thereby increases FtsZ protofilament association and Z-ring stability. Here, we investigated ZapB interaction with ZapA and its effect on Z-ring formation and FtsZ protofilament bundling. The combination of the ftsZ84 allele that encodes an FtsZ variant that polymerizes inefficiently with a zapB null mutant resulted in a synthetic defective phenotype. Overproduction of ZapA led to the formation of aberrant FtsZ helical structures and delocalization of ZapB. The N-terminal end of ZapB was essential for ZapB-ZapA interaction, and amino acid changes close to the N terminus of ZapB exhibited reduced interaction with ZapA. Sedimentation assays showed that ZapB interacts strongly with ZapA and reduces ZapA's interaction with FtsZ in vitro. The morphology of the structures formed by ZapA and ZapB together was similar to the cables formed by ZapB in the presence of CaCl2, a known ZapB bundling agent. The in vivo and in vitro data support a model in which ZapA interacts strongly with ZapB and the ZapA-ZapB interaction is favored over ZapA-FtsZ.
INTRODUCTION
Bacterial cell division is a highly regulated process achieved by a macromolecular machinery, called the divisome, containing in Escherichia coli at least 12 proteins (2, 48). The tubulin homologue FtsZ is a self-activating GTPase (13, 34, 42) that forms a ring-like structure underneath the cytoplasmic membrane at the division site (5). In E. coli, FtsZ polymers are stabilized and tethered to the membrane by FtsA and ZipA (39). After the formation of the Z ring, the downstream proteins, involved in the dynamics and maturation of the Z ring, are recruited into the septal ring (1, 20).
In the presence of GTP, FtsZ monomers polymerize into single-stranded filaments in vitro (35, 36). GTP hydrolysis is not required for protofilament formation (9, 36) but instead promotes polymer disassembly and a constant exchange of FtsZ subunits (9): once a subunit in the protofilaments has hydrolyzed its GTP, it dissociates from the polymer and is rejuvenated in the cytoplasm to its active state by binding GTP. Two mechanisms have been suggested to be responsible for subunit exchange in polymers and contribute equally to the subunit turnover: one requires GTP hydrolysis and exchange of FtsZ-GDP subunits within the polymers with FtsZ-GTP subunits in the cytoplasm, and the other requires replacement of FtsZ-GTP monomers from the extremities of FtsZ protofilaments without GTP hydrolysis (17). Single-stranded protofilaments of purified E. coli FtsZ can associate laterally, forming bundles or sheets, and their assembly can be induced by Ca2+ (26, 31, 50) or molecular crowding agents (22, 40) or other cell division factors such as ZipA (41), ZapA (23, 30, 33, 45), and ZapC (15, 25).
In vivo the Z ring has been shown to consist of short overlapping FtsZ protofilaments whose interaction is modulated by cellular factors (18, 29). Such Z-ring positive and negative modulating factors that appear to be phylogenetically unrelated are present among bacterial phyla (25). In E. coli, ZapA and ZapC function as positive regulators of Z-ring assembly (11, 15, 23, 25, 30, 33, 45).
Interacting directly with FtsZ, ZapA is recruited early to the divisome (23), where it increases FtsZ protofilament association and Z-ring stability (11, 23, 30, 33, 45). The structure of ZapA from Pseudomonas aeruginosa has been solved: a ZapA monomer consists of an N-terminal globular domain and a long C-terminal coiled-coil domain; in solution it exists in a dimer/tetramer equilibrium, where higher ZapA concentrations shift the equilibrium toward the tetramer conformation. ZapA monomers dimerize, interacting between the N termini of the coiled-coil domains, and two dimers form an antiparallel tetramer, extensively associating along the coiled-coil protrusions. Its globular domain is postulated to mediate the interaction with FtsZ (30). Probably, in vivo, ZapA forms a dimer, but it is possible that the local concentration of ZapA at the division site, where it likely interacts stoichiometrically with FtsZ, may be sufficient to induce a tetrameric conformation (30).
Recently, we showed that ZapA recruits ZapB to the division site. FtsZ, ZapA, and ZapB form a high-molecular-weight complex in vitro in which ZapA acts as a bridge between FtsZ and ZapB (19). ZapB structure consists of a unique coiled-coil domain; it was suggested that ZapB could dimerize and polymerize through interactions between the coiled-coil end regions (16). ZapB is a relatively abundant protein, present in ∼13,000 copies per cell, an amount comparable to or higher than that of FtsZ, quantified to be between 3,200 and 15,000 molecules per cell in E. coli B/r cells (16, 32, 44). Mohammadi et al. (33) determined the amount of ZapA and FtsZ in E. coli cells grown under the same conditions and found ZapA and FtsZ to be present at ∼6,000 and ∼5,000 molecules per cell (33).
Here, we characterize the complex formed by ZapB and ZapA, identifying the N-terminal domain of ZapB and the coiled-coil domain of ZapA as the interacting regions of the two proteins. ZapA overproduction disperses ZapB away from the cell division site and induces the formation of aberrant helical FtsZ structures at midcell. In vitro, ZapA strongly interacts with ZapB, which in large amounts disrupts the interaction between FtsZ and ZapA.
MATERIALS AND METHODS
Bacterial strains and plasmids used and constructed in this study are listed in Table 1. Oligonucleotide are listed in Table S1 in the supplemental materials.
Table 1.
Strains and plasmids used and constructed
| Strain or plasmid | Relevant genotype or descriptiona | Resistanceb | Reference or source |
|---|---|---|---|
| Strains | |||
| AB1157Z84 | AB1157 carrying the ftsZ84 mutation | Tc | Gift from David J. Sherratt |
| BL21 A1 | Arabinose-inducible gene expression from T7 promoter | Invitrogen | |
| BTH101 ΔzapA ΔzapB | BTH101 in which the zapA and zapB genes are deleted | This work | |
| C41 | F−ompT hsdSB (rB− mB−) gal dcm | ||
| DH5α | λ− ϕ80dlacZΔM15 Δ(lacZYA-argF)U169 recA1 endA hsdR17(rK− mK−) supE44 thi-1 gyrA relA1 | Invitrogen | |
| MC1000 | Δ(ara-leu) Δlac rpsL150 | 8 | |
| MC1000 ΔzapC | MC1000 zapC::kan | Kan | This work |
| MG1655 | Laboratory collection | ||
| KG22 | C600 lacIqlacZΔM15 | Laboratory collection | |
| KG22Z84 | KG22 carrying the ftsZ84 mutation | Tc | This work |
| KG22Z84 ΔzapB | KG22 carrying the ftsZ84 mutation, in which the zapB gene is deleted | Tc | This work |
| KG22Z84 ΔzapA | KG22 carrying the ftsZ84 mutation, in which the zapA gene is deleted | Tc | This work |
| PS106 | W3110 ftsZ84 | 39 | |
| PS106 ΔzapA | PS106 zapA::kan | Kan | This work |
| PS106 ΔzapB | PS106 zapB::kan | Kan | This work |
| PS223 | W3110 zipA1 | 39 | |
| PS223 ΔzapA | PS223 zapA::kan | Kan | This work |
| PS223 ΔzapB | PS223 zapB::kan | Kan | This work |
| PS236 | W3110 ftsA12 leu::Tn10 | 39 | |
| PS236 ΔzapA | PS236 zapA::kan | Kan | This work |
| PS236 ΔzapB | PS236 zapB::kan | Kan | This work |
| PS413 | W3110 ftsI23 leu::Tn10 | 11 | |
| PS413 ΔzapA | PS413 zapA::kan | Kan | This work |
| PS413 ΔzapB | PS413 zapB::kan | Kan | This work |
| Plasmids | |||
| pBAD33 | Cloning vector containing the PBAD promoter | Cml | 24 |
| pEG3a | PBAD::zapB::gfp | Cml | 16 |
| pEG9 | PBAD::zapB::mCherry | Cml | 19 |
| pEG12 | Plac::ftsZ::gfp | Amp | 19 |
| pEG28 | PoxyTc::zapA | Amp | 19 |
| pEG37 | PT7::zapBΔ10::his6 | Amp | This work |
| pEG43 | Plac::his6::zapA | Amp | This work |
| pEG47 | Plac::his12::zapA | Amp | This work |
| pEG49 | PT7::zapB(S4A L5A)::his6 | Amp | This work |
| pEG58 | Plac::zapA | Amp | This work |
| pEG59 | PBAD::zapA | Cml | This work |
| pEG60 | Ptol::zapB::mCherry | Tc | This work |
| pEG67 | PBAD::zapC | Cml | This work |
| pHis17 | Cloning vector | Amp | 46 |
| pKT25 | T25 fusion vector | Kan | 27 |
| pKT25N | T25 fusion vector | Kan | 27 |
| pKT25N-ZapA-1 | Plac::zapA(aa 1-20)::T25 | Kan | This work |
| pKT25N-ZapA-2 | Plac::zapA(aa 1-47)::T25 | Kan | This work |
| pKT25-ZapA | Plac::T25::zapA | Kan | 19 |
| pKT25-ZapA-3 | Plac::T25::zapA(aa 21-109) | Kan | This work |
| pKT25-ZapA-4 | Plac::T25::zapA(aa 48-109) | Kan | This work |
| pKT25-ZapB | Plac::T25::zapB | Kan | 16 |
| pJB866 | Cloning vector | Tc | 6 |
| pMFV56 | Plac::ftsZ | Kan | 43 |
| pMG25 | Cloning vector | Amp | Laboratory collection |
| pNG53 | PTrc99a::yfp::zapA | Amp | 21 |
| pQE30 | Cloning vector | Amp | Qiagen |
| pUT18C | T18 fusion vector | Amp | 27 |
| pUT18C-ZapA | Plac::T18::zapA | Amp | 19 |
| pUT18C-ZapB-1 | Plac::T18::zapB(aa 11-81) | Amp | This work |
| pUT18C-ZapB-2 | Plac::T18::zapB(aa 21-81) | Amp | This work |
| pUT18C-ZapB-3 | Plac::T18::zapB(aa 31-81) | Amp | This work |
| pUT18C-ZapB-4 | Plac::T18::zapB(aa 41-81) | Amp | This work |
| pUT18C-ZapB-5 | Plac::T18::zapB(aa 1-70) | Amp | This work |
| pUT18C-ZapB-6 | Plac::T18::zapB(aa 1-60) | Amp | This work |
| pUT18C-ZapB-7 | Plac::T18::zapB(aa 1-50) | Amp | This work |
| pUT18C-ZapB-8 | Plac::T18::zapB(aa 1-40) | Amp | This work |
| pUT18C-ZapB(S4A L5A) | Plac::T18::zapB(S4A L5A) | Amp | This work |
| pUT18C-ZapB(E6A V7A) | Plac::T18::zapB(E6A V7A) | Amp | This work |
| pUT18C-ZapB(F8A E9A) | Plac::T18::zapB(F8A E9A) | Amp | This work |
| pUT18C-ZapB(K10A L11A) | Plac::T18::zapB(K10A L11A) | Amp | This work |
| pZapBHis | PT7::zapB::his6 | Amp | 16 |
Amino acid truncations are shown following the gene designation. For example, zapA(aa 1-20) represents the zapA gene harboring amino acids 1 to 20.
Tc, tetracycline; Kan, kanamycin; Cml, chloramphenicol; Amp, ampicillin.
Purification of FtsZ.
The protocol for the purification of FtsZ was adapted from Rivas et al. (43). FtsZ was overproduced in E. coli BL21(DE3) (Invitrogen) transformed with the plasmid pMFV56. The overnight culture was diluted 1:400 in 400 ml of LB medium and incubated with shaking at 37°C; when the optical density at 450 nm (OD450) reached ∼0.4, isopropyl-β-d-thiogalactopyranoside (IPTG) was added to a concentration of 1 mM, and cells were incubated for 3 h. Cells were then harvested by centrifugation at 4°C at 6,000 rpm for 15 min and stored at −80°C until purification was initiated. Harvested cells (200 ml) were resuspended in 4 ml of PEM buffer [50 mM piperazine-N,N′-bis(2-ethanesulfonic acid) (PIPES), pH 6.5, 5 mM MgCl2, 1 mM EDTA] and lysed by sonication on ice. The lysate was centrifuged for 40 min at 15,000 rpm at 4°C, and the supernatant was saved. Then, the first cycle of the purification procedure was initiated: 1 mM GTP and 20 mM CaCl2 were added to the supernatant; the sample was gently mixed, incubated for 15 min at 30°C, and then centrifuged for 15 min at 13,000 rpm. The pellet fraction was resuspended in 4 ml of PEM buffer, incubated for 15 min at 30°C, and centrifuged for 15 min at 13,000 rpm. The supernatant was saved, and the second cycle of the purification procedure was initiated and was an absolute repetition of cycle one. The final supernatant was loaded on an ion exchange column (1-ml HiTrap Q HP Column; Amersham) equilibrated in 10 ml of PEM buffer. Proteins were eluted by loading a salt gradient of PEM buffer containing NaCl from 0 to 1 M. Samples containing only FtsZ were pooled and dialyzed into FtsZ storage buffer (50 mM Tris [pH 7.5], 1 mM EDTA, 250 mM NaCl, 10% glycerol) and stored in small aliquots at −80°C.
Purification of ZapB-His.
ZapB-His6 was overproduced in E. coli BL21AI cells (Invitrogen) transformed with the plasmid pZapBHis. The overnight culture was diluted 1:400 in 500 ml of 2× tryptone-yeast extract (TY) medium supplemented with 0.2% glucose; at mid-exponential growth protein expression was induced by addition of 0.4% arabinose (Ara). After 6 h of induction, the cells were harvested, resuspended in buffer A (50 mM Tris-HCl [pH 7.0], 300 mM NaCl, 15 mM imidazole) containing 5 μg/ml DNase I and 1 mg/ml lysozyme and lysed by sonication. The lysate was cleared by centrifugation for 30 min at 20,000 rpm. The cleared lysate was then loaded on a 5-ml HisTrap column (GE Healthcare), and the protein was eluted with stepwise increments of buffer B (buffer A with 2 M imidazole). Purified ZapB-His6 was dialyzed into ZapB storage buffer (20 mM Tris-HCl [pH 7.0], 1 mM EDTA, 10% glycerol), concentrated, frozen in liquid nitrogen, and stored at −80°C. ZapB-His6 mutants were purified using the same protocol.
Purification of ZapA.
His12-ZapA (containing the Xa cleavage site between the His12 tag and ZapA) was overexpressed from plasmid pEG47 in E. coli C41 cells grown at 25°C in LB medium. At mid-exponential growth, protein expression was induced by addition of 1 mM IPTG. After 20 h of induction, cells were harvested, resuspended in buffer A (20 mM Tris-HCl [pH 8.0], 200 mM NaCl, 15 mM imidazole) containing 5 μg/ml DNase I and 1 mg/ml lysozyme, and lysed by sonication. The lysate was cleared by centrifugation for 30 min at 20,000 rpm. The cleared lysate was loaded onto a 1-ml HisTrap column (GE Healthcare), and the protein was eluted in a buffer B (buffer A with 1 M imidazole) gradient. Purified His12-ZapA was dialyzed into Xa reaction buffer (20 mM Tris-HCl [pH 8.0], 100 mM NaCl, 2 mM CaCl2) and incubated at room temperature with factor Xa for 20 h (10 μg of factor Xa for a reaction mixture containing 3 mg of purified protein). The complete cleavage was confirmed by SDS-PAGE. ZapA was then dialyzed into buffer C (20 mM Tris-HCl [pH 7.0] 10% glycerol) and concentrated by centrifugation through a 10-kDa-cutoff filter that removed the His tag. Aliquots were snap-frozen in liquid nitrogen and stored at −80°C. Xa cleavage resulted in a ZapA protein with no extra amino acids at its N terminus.
Ni2+-NTA-agarose affinity chromatography.
FtsZ and/or ZapA at 0.2 mg/ml was added to 100 μl of PEM buffer in the presence of either ZapB-His6 (0.1 mg/ml) or ZapB(S4A L5A)-His6 (0.1 mg/ml), and the reaction mixtures were incubated at room temperature for 15 min, with slow shaking. Twenty microliters of Ni2+-nitrilotriacetic acid (NTA)-agarose (equilibrated in PEM buffer) was then added to each tube, and the reaction mixtures were incubated at room temperature for 5 min to allow the binding of the His-tagged proteins to the agarose beads. The resin was separated from the reaction solution by centrifugation (2 min at 3,000 rpm) and washed twice in 100 μl of PEM buffer supplemented with 10 mM imidazole. The proteins bound to the resin were then eluted by washing the resin twice in 20 μl of PEM buffer supplemented with 500 mM imidazole. The final eluted fractions were 2.5 times more concentrated than the initial sample and the intermediate fractions. Equal volumes from each fraction were analyzed by immunoblotting.
Far-Western blotting.
Two micrograms of each protein was spotted on a Hybond-C membrane (Amersham Biosciences) and left to dry for 30 min at room temperature. The membrane was incubated with slow shaking in PEM buffer supplemented with 5% milk powder, and after 30 min 10 μg of the second protein (the probe) was added into the solution. After 1 h, the membrane was washed four times for 5 min in PEM buffer with 5% milk powder. Then, a standard Western blot protocol was followed, using an antibody against the probe protein as the primary one.
GTPase activity assay.
FtsZ GTPase activity was assayed using malachite green to quantify the released phosphate (28). Two different polymerization buffers were used: buffer 1 containing 50 mM piperazine-N,N′-bis(2-ethanesulfonic acid) (PIPES; pH 6.5), 50 mM KCl, and 10 mM MgCl2 and buffer 2 containing 50 mM HEPES (pH 7.5), 50 mM KCl, and 10 mM MgCl2. To the polymerization buffers were added 5 μM each FtsZ, ZapA, and ZapB-His and 1 mM GTP (the GTP stock solutions were buffered in the two different polymerization buffers) in a total volume of 100 μl. The reaction mixtures were incubated at 30°C, and 10-μl samples were withdrawn at different time points during a 30-min period. Standard curves with known concentrations of phosphate were used to determine the amount of phosphate released.
Light-scattering assay (90° angle).
Light-scattering experiments were performed using a Varian Cary Eclipse fluorescence spectrophotometer and a quartz cuvette maintained at 30°C, based on the method described by Mukherjee and Lutkenhaus (37). Excitation and emission wavelengths were set to 350 nm, with slit widths of 2.5 nm. Proteins (concentrations as indicated in the text) were incubated in 50 μl of polymerization buffer (buffer 1 and buffer 2 as described for the GTPase activity assay) in the cuvette, and, after a baseline was established for 5 min, polymerization was induced by addition of 0.5 or 1 mM GTP. The light scattering was recorded for a total of 15 or 30 min. Data in the graphs are reported in arbitrary units or the change in arbitrary units (AU or ΔAU, respectively) versus time, where the ΔAU was calculated by subtracting the baseline values from the AU registered by the machine after GTP addition.
Sedimentation assay.
Reaction mixtures containing FtsZ, ZapA, and ZapB-His (concentrations as indicated in the text) were incubated for 5 min at 30°C in polymerization buffer 1 (as described for the GTPase activity assay). GTP or GDP (0.5 or 1 mM) was then added to initiate FtsZ polymerization; the reaction was allowed to proceed for 5 min at 30°C before ultracentrifugation (80,000 rpm for 10 min at 25°C). The supernatants were removed, and the pellets were resuspended in an equal volume of SDS-PAGE sample buffer. Equal volumes from each fraction were loaded and analyzed by SDS-PAGE and Coomassie staining.
Negative-staining electron microscopy.
Polymerization reaction mixtures were prepared as done for the sedimentation assays. At 30 s after the addition of GTP, 5 μl of each polymerization reaction mixture was applied to a glow-discharged, carbon-coated, copper grid (Newcastle Biomedical EM Unit) and blotted dry. The grid was then stained with 100 μl of a 2% uranyl-acetate solution and again blotted dry. Grids were examined using a Philips CM100 Compustage transmission electron microscope ([TEM] FEI) with an AMT charge-coupled-device (CCD) camera (Deben).
BTH analysis.
Bacterial two-hybrid (BTH) analysis was performed as described by Karimova et al. (27). A 15-μl aliquot from each transformation reaction mixture was spotted onto nutrient agar plates containing 100 μg/ml ampicillin, 50 μg/ml kanamycin, 0.1 mM IPTG, and 0.004% 5-bromo-4-chloro-3-indolyl-β-d-galactopyranoside (X-Gal). The plates were incubated at 30°C, and pictures were taken after 48 h.
Microscopic imaging.
For phase-contrast and fluorescence microscopy 1 to 3 μl of a culture sample was placed on a microscope slide coated with a thin agarose (1%) layer and covered with a coverslip. For DNA staining a 10-μl culture sample was mixed with 1 μl of 4′,6′-diamidino-2-phenylindole ([DAPI] 1 μg/ml; Sigma) solution. Images were acquired with a Sony Cool-Snap HQ cooled CCD camera (Roper Scientific) attached to a Zeiss Axiovert 200 M microscope. The images were acquired and analyzed with Metamorph, version 6, software. Final image preparation was performed in Adobe Photoshop, version 6.0 (Adobe Systems, Inc.).
Fluorescent fusion protein expression and localization.
Cells were grown at 30°C or 37°C in M9 minimal medium supplemented with 0.1% Casamino Acids, 0.2% glucose, and specific antibiotics. For ZapB-green fluorescent protein (GFP) induction and localization from pEG3a, at an OD450 value of about 0.2, the cells were harvested by centrifugation and then resuspended in preheated medium without glucose. Arabinose (0.2%) was added in order to induce expression of ZapB-GFP. After 5 min, induction was stopped by the addition of 0.2% glucose. To express yellow fluorescent protein (YFP)-ZapA from pNG53, the leakiness of the promoter was sufficient for localization studies. To express FtsZ-GFP from pEG12, at an OD450 value of about 0.2 FtsZ-GFP was induced by 200 μM IPTG. To express ZapB-mCherry from pEG60, at an OD450 value of about 0.2 ZapB-mCherry was induced by 3 mM Tol. After induction, cells were allowed to grow for at least another 30 min before the samples were collected for microscopy. If not otherwise specified, all the localization analyses were performed using fusions expressed from a plasmid in addition to the native untagged copy on the chromosome.
ZapA, YFP-ZapA, and ZapC overproduction.
Cells of strain MC1000/pEG58 (Plac::zapA), MC1000/pEG59 (PBAD::zapA), and MC1000/pNG53 (Plac::yfp::zapA) were grown in M9 minimal medium supplemented with 10% glycerol and specific antibiotics at 30°C. At an OD450 value of about 0.2, they were induced, respectively, with 500 μM or 1 mM IPTG, 0.2% arabinose and 200 μM, 500 μM, or 1 mM IPTG. Cells of strains MC1000/pEG12 (Plac::ftsZ::gfp)/pEG59 (PBAD::zapA), MC1000/pEG3a (PBAD::zapB::gfp)/pEG58 (Plac::zapA), and DH5α/pEG12 (Plac::ftsZ::gfp)/pEG59 (PBAD::zapA)/pEG60 (Ptol::zapB::mCherry) were analyzed at the microscope 2 h after induction. Cells of strain DH5α/pEG12 (Plac::ftsZ::gfp)/pEG60 (Ptol::zapB::mCherry)/pEG67 (PBAD::zapC) were analyzed at the microscope 2 h after induction of pEG67 with 0.2% arabinose.
Construction of plasmids.
Purified MG1655 chromosomal DNA was used as a template for PCRs, if not otherwise specified. Plasmid pEG37 is a pHis17 derivative that carries zapBΔ10::his6 (where zapBΔ10 has a deletion of the first 10 N-terminal amino acids in zapB) downstream of the T7 inducible promoter. zapBΔ10 was amplified by PCR with primers ZapB-H17 and ZapB-H17R. The PCR product was cut with NdeI and BamHI and cloned into the same sites of pHis17. Plasmid pEG43 is a pQE30 derivative that carries his6::zapA downstream of the Plac promoter. his6::zapA was amplified by PCR with primers: Xa-zapA and zapA-4. The PCR product was cut with BamHI and HindIII and cloned into the same sites of pQE30. Plasmid pEG47 carries his12::zapA downstream of the IPTG-inducible Plac promoter of vector pMG25. his12::zapA was amplified from plasmid pEG43 by PCR with primers EG47-For and zapA-4. The PCR fragment was cut with restriction enzymes NcoI and HindIII and cloned into the corresponding sites of pMG25. Plasmid pEG49 is a pHis17 derivative that carries zapB(S4A L5A)::his6 downstream of the T7 inducible promoter. zapB(S4A L5A) was amplified by PCR with primers mut41 and ZapB-H17R. The PCR product was cut with NdeI and BamHI and cloned into the same sites of pHis17. Plasmid pEG58 is a pMG25 derivative that carries zapA downstream of the Plac inducible promoter. The BamHI-HindIII fragment carrying zapA from pEG28 was inserted into the BamHI-HindIII sites of pMG25. Plasmid pEG59 is a pBAD33 derivative that carries zapA downstream of the PBAD inducible promoter. The SacI-HindIII fragment carrying zapA from pEG28 was inserted into the SacI-HindIII sites of pBAD33. Plasmid pEG60 carries zapB::mCherry downstream of the m-toluic acid-inducible Ptol promoter of vector pJB866. The KpnI-HindIII fragment carrying zapB::mCherry from pEG9 was inserted into the corresponding sites of pJB866. Plasmid pEG67 is a pBAD33 derivative that carries zapC downstream of the PBAD inducible promoter. zapC was amplified by PCR with primers zapC-1 and zapC-2. The PCR product was cut with SacI and HindIII and cloned into the same sites of pBAD33. Plasmids used in the bacterial two-hybrid system expressed an in-frame fusion of zapA and zapB to the C termini (or N termini for ZapA-1 and ZapA-2) of the two complementary fragments T18 (vector pUT18C) and T25 (vector pKT25 or pKT25N) of the catalytic domain of the Bordetella pertussis adenylate cyclase. zapA and zapB were amplified by PCR with the following primers: for zapA, zapA-1 and zapA-2; zapA-1, zapA-N1 and zapA-N2; zapA-2, zapA-N1 and zapA-N3; zapA-3, zapA-12 and zapA-2; zapA-4, zapA-13 and zapA-2; zapB-1, zapB-61 and zapB-7; zapB-2, zapB-62 and zapB-7; zapB-3, zapB-63 and zapB-7; zapB-4, zapB-64 and zapB-7; zapB-5, zapB-6 and zapB-71; zapB-6, zapB-6 and zapB-72; zapB-7, zapB-6 and zapB-73; zapB-8, zapB-6 and zapB-74; zapB(S4A L5A), zapB-6b and zapB-7; zapB(E6A V7A), zapB-6c and zapB-7; zapB(F8A E9A), zapB-6d and zapB-7; zapB(K10A L11A), zapB-6e and zapB-7. The PCR fragments were cloned between the SalI and KpnI sites of pUT18C, between the BamHI and KpnI sites of pKT25, and between the sites HindIII and BamHI of pKT25N.
Construction of strains.
zapA::kan, zapB::kan, and zapC::kan were introduced into the receiver strains by P1 transduction. Colonies were tested for insertion of the resistance gene by using colony PCR with the primer pairs zapA-up and zapA-down, zapB-up and zapB-down, and zapC-up and zapC-down, respectively, for zapA, zapB, and zapC. The temperature-sensitive (TS) helper plasmid pCP20, encoding the FLP recombinase, was used to eliminate the resistance genes, as described by Datsenko and Wanner (12).
The ftsZ84 allele was introduced in KG22 by P1 phage transduction using AB1157Z84 as a donor. Transductants were selected on plates containing 10 μg/ml tetracycline, and subsequently ftsZ84 mutants were isolated by screening for transductants not able to grow at the nonpermissive temperature (42°C).
RESULTS
Overproduction of ZapA delocalizes ZapB.
Overproduction of ZapA in E. coli K-12 strain MC1000 resulted in the formation of elongated cells. Occasionally, such elongated cells appeared twisted, with bends at sites expected to have a predivisional constriction (Fig. 1A). Overproduction of ZapA did not affect the growth rate of the cultures (data not shown).
Fig 1.

ZapA overproduction delocalizes FtsZ and ZapB. Combined phase-contrast and fluorescence microscopy images showing the localization of ZapB and FtsZ when ZapA is overproduced. Cells were grown at 30°C in M9 minimal medium supplemented with glucose (0.2%) and Casamino Acids (0.1%). Expression of ZapB-GFP from plasmid pEG3a, ZapB-mCherry from plasmid pEG60, FtsZ-GFP from plasmid pEG12, and ZapA from plasmids pEG58 and pEG59 was induced as described in Materials and Methods. (A) Phase-contrast image of living cells of strain MC1000/pEG58 (Plac::zapA) (+IPTG) and MC1000/pEG59 (PBAD::zapA) (+Ara) over time. NI, no inducer. (B) Phase-contrast images (a, b, and c) and FtsZ-GFP localization (a′, b′, and c′) in living cells of strain MC1000/pEG59 (PBAD::zapA)/pEG12 (Plac::ftsZ::gfp) 2 h after ZapA induction with 0.2% Ara (b and c) or without the inducer (a). ZapA levels are 8-fold higher than under wt conditions. (C) Phase-contrast (a, b, and c) images and ZapB-GFP localization (a′, b′, and c′) in living cells of strain MC1000/pEG58 (Plac::zapA)/pEG3a (PBAD::zapB::gfp) 2 h after ZapA induction with 500 μM IPTG (b) or 1 mM IPTG (c) or without the inducer (a). ZapA levels are 7-fold (500 μM IPTG) and 12-fold (1 mM IPTG) higher than under wt conditions. (D) Phase-contrast images (a, b and c), FtsZ-GFP localization (a′, b′, and c′), and ZapB-mCherry localization (a″, b″, and c″) in living cells of strain DH5α/pEG59 (PBAD::zapA)/pEG12 (Plac::ftsZ::gfp)/pEG60 (Ptol::zapB::mCherry) 2 h after ZapA induction with 0.2% Ara (b and c) or without the inducer (a). ZapA levels are 8-fold higher than under wt conditions. (E) Localization of YFP-ZapA in living cells of strain MC1000/pNG53 (Plac::yfp::zapA) 2 h after induction with 200 μM IPTG (b), 500 μM IPTG (c), or 1 mM IPTG (d) or without the inducer (a). Scale bar, 2 μm.
We then investigated if elevated levels of ZapA affected the localizations of FtsZ and ZapB. In the absence of inducer, normal Z rings were formed, as expected (Fig. 1B). After induction of ZapA, FtsZ-GFP formed helical structures or spirals at the division site or along the undivided short cell filaments (Fig. 1B). Indeed, the formation of short cell filaments and what seemed to be cells with twisted septa was indicative of defects in the formation of a functional Z ring. During these experiments, ZapA was overproduced 7- to 12-fold as determined by Western blotting (data not shown).
Next, we inspected ZapB localization in the presence of an increased level of ZapA. In the absence of the inducer, ZapB-GFP localized at the division site as expected. Increasing amounts of IPTG reduced the septal ZapB-GFP signal (Fig. 1C).
To be able to visualize both ZapB and FtsZ while overproducing ZapA, we employed an expression system compatible with both the standard IPTG- and arabinose-regulated promoters. We decided to use an expression vector based on the RK2 replicon carrying a promoter that was inducible by toluic acid (TOL) (6). For reasons still unknown to us, the expression level from the Ptol promoter was very low in the MC1000 strain. However, in the DH5α background, it was possible to obtain sufficient expression of ZapA from a PBAD promoter and at the same time visualize FtsZ-GFP (under IPTG control) and ZapB-mCherry (under TOL control). In the absence of ZapA induction, ZapB-mCherry and FtsZ-GFP formed colocalizing bands at the division sites (Fig. 1D). In contrast, in the presence of elevated levels of ZapA, FtsZ-GFP formed aberrant structures, whereas ZapB-mCherry was diffuse in the cytoplasm (Fig. 1D).
We also overproduced YFP-ZapA. As expected, the YFP-ZapA signal became diffuse, and the YFP signal in the cytoplasm increased to such a high level that the YFP-ZapA bands at midcell became barely visible (Fig. 1E).
ZapC is not required for localization of ZapA or ZapB.
We investigated FtsZ, ZapA, and ZapB localization in cells lacking ZapC. Cells of a zapC deletion mutant were slightly elongated, but neither FtsZ, ZapA, nor ZapB showed significant localization defects (see Fig. S1A in the supplemental material). In the majority of the cells, FtsZ formed a proper band at the division site, and only in less than 5% of the cells were abnormal structures such as diffuse arcs, spirals, or doublets present (similar Z-ring morphological defects were described by Durandia-Heredia et al. [15]). In ΔzapC cells, the localization patterns of ZapA and ZapB resembled the pattern of FtsZ. Therefore, ZapC is not required for recruitment of ZapA and ZapB to the Z ring.
An increased level of ZapC in the cells has been reported to produce cell filamentation and formation of FtsZ aberrant structures (15, 25). ZapC overproduction did not change the ZapB-GFP pattern (see Fig. S1B).
Synthetic defective phenotype of ΔzapB and ftsZ84.
We previously reported that ZapB is recruited early to the Z ring by ZapA (19). To determine if ZapB has a biological function in the early and/or late stages of the division process, we combined a zapB deletion with strains carrying temperature-sensitive (TS) alleles in FtsZ, FtsA, ZipA, and FtsI in E. coli K-12 strain W3110. Note that FtsZ, FtsA, and ZipA are recruited early while FtsI is recruited late. The strains carrying ftsZ84 ΔzapA or ftsZ84 ΔzapB grew more slowly than the strain carrying ftsZ84, and the double mutant ftsZ84 ΔzapB strain showed growth defects more severe than the ftsZ84 ΔzapA mutant (Fig. 2). We then inspected the growth defects of strains carrying a zapB or zapA deletion combined with TS alleles of ftsA, zipA, and ftsI. The mass doubling times of these TS strains carrying a zapA or zapB deletion appeared to be only slightly reduced compared to the times of the corresponding TS strains (data not shown). Spots of serial dilutions of all the TS strains were incubated at 30°C, and the presence of a zapB deletion caused a severe plating defect only when it was combined with the ftsZ84 allele (Fig. 2).
Fig 2.
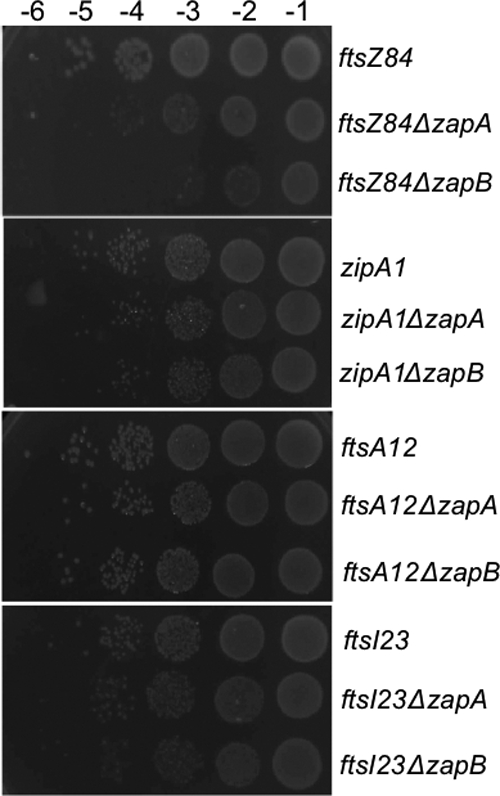
Deletion of ZapB specifically reduces FtsZ division potential. Overnight cultures of TS mutant strains were grown to equal density in LB medium at 30°C and serially diluted (10−1 to 10−6) in LB medium. Aliquots (10 μl) were spotted on NA plates incubated at 30°C overnight.
The combination of the ΔzapB and ftsZ84 alleles was previously characterized in the background of E. coli K-12 strain C600 and reported to produce a synthetic defective phenotype: overnight colonies of the double mutant strain were tiny and grew more slowly than both wild-type (wt) and single mutant cells. In liquid medium the strain generated cells with highly abnormal morphologies such as DNA-free minicells, blebs, and branches (16). When isolated on plates the KG22Z84 ΔzapB strain produced very small colonies but also a few big colonies in which the TS phenotype of ftsZ84 was retained and the zapB gene was confirmed to be deleted. To characterize the suppression phenomenon, we reconstructed the KG22Z84 ΔzapB strain. The strain formed tiny colonies on solid medium. Again, a few bigger colonies appeared, supposedly containing unknown suppressors of the very sick double mutant. We were able to isolate two different types of suppressors (called sup77 and sup78). The single mutant strains, the double mutant strain, and the two suppressors were analyzed and compared for defects in cell growth and morphology in liquid (LB) or on solid medium (nutrient agar [NA]). On solid medium KG22Z84 ΔzapB formed tiny colonies, visible only after at least 20 h of growth at 30°C; sup77 formed small colonies that were clearly bigger than those of the double mutant while sup78 formed colonies with a mucoid phenotype, very similar to the appearance of cells with increased levels of capsule synthesis, typical of a lon mutant (47) (see Fig. S2A in the supplemental material). Interestingly, a KG22Z84 ΔzapA mutant seemed to grow faster than KG22Z84 ΔzapB on solid medium (see Fig. S2A in the supplemental material). The growth rates of the strains in liquid medium showed that the single mutant ftsZ84 and zapB strains did not exhibit any particular difference in growth rates compared to the parental strain KG22 while the double mutant KG22Z84 ΔzapB grew very slowly. The KG22Z84 ΔzapA strain and the two suppressors still showed a growth defect but slightly less severe than that of the KG22Z84 ΔzapB double mutant (see Fig. S2B). Spots of serial dilutions of the ftsZ84(Ts) strains were incubated at increasing temperatures, and already at 30°C the KG22Z84 ΔzapB double mutant displayed a plating defect of several orders of magnitude, while the two suppressors were able to mitigate the defect (see Fig. S2C). Cell samples taken from plates or from exponentially growing cultures were compared for morphological defects and phenotypes: as described above, the KG22Z84 ΔzapB double mutant showed highly abnormal morphology defects that were alleviated in cells carrying the suppressors (see Fig. S2E). Grown overnight on plates, cells carrying the KG22Z84 ΔzapB mutant formed very long filaments, whereas the two suppressors formed cells of normal size and only few filaments (see Fig. S2D).
The FtsZ-ZapA-ZapB interactome.
To further dissect the interaction between ZapA and ZapB, we introduced truncations into both proteins and tested their effect in a bacterial two-hybrid assay (27). The BTH analysis was performed in a BTH101 ΔzapA ΔzapB background in order to avoid any interference by the endogenously encoded proteins.
ZapB is an 81-amino-acid (aa) protein with a 100% coiled-coil structure, without any globular domains (see Fig. S3A in the supplemental material) (16). Since there are no specific domains in the ZapB structure, we systematically constructed C-terminal and N-terminal deletions differing by 10 aa (Fig. 3A). The truncation of the first 10 aa was sufficient to completely abolish the Lac+ phenotype. In contrast, the deletion of up to 41 aa at the ZapB C-terminal end did not affect the ZapB-ZapA interaction. In contrast, to affect ZapB self-interaction, it was necessary to truncate larger portions of the protein, and neither the N- nor the C-terminal end was essential. Thus, the N-terminal region of ZapB was essential for the interaction with ZapA.
Fig 3.

FtsZ-ZapA-ZapB interactome. (A) Interaction of ZapB mutants fused to the T18 fragment and ZapA or ZapB fused to the T25 fragment in a BTH assay. (B) Interaction of ZapA mutants fused to the T25 fragment and ZapA or ZapB or FtsZ fused to the T18 fragment in a BTH assay. ZapA-1 contains only S1+S2; ZapA-2 contains S1+S2+H1; ZapA-3 contains H1+H2; ZapA-4 contains only H2 (see Fig. S3B in the supplemental material for ZapA structure and S1, S2, H1, and H2 definition). Symbols in the BTH assay: +, weak interaction; ++, stronger interaction; +++, strong interaction; ÷, no interaction. (C) Far-Western blotting. (a) ZapB-His6 interacts with ZapA but not FtsZ, ParB, or bovine serum albumin (BSA). ZapB-1-His6 does not interact with any of the proteins tested. (b) ZapA interacts with FtsZ and ZapB but not with ZapB-1, ParB, or BSA. (D) The mutants constructed are zapB(S4A L5A), zapB(E6A V7A), zapB(F8A E9A), and zapB(K10A L11A). Protein interaction was detected by bacterial two-hybrid assay. Transformants were spotted onto selective plates containing X-Gal and incubated at 30°C for 48 h. Blue indicates a positive interaction. (E) Ni2+-NTA affinity chromatography of ZapA with or ZapB-His6 or ZapB(S4A L5A)-His6. (a) Starting reactions mixes were as follows: lane 1, ZapB-His6 and ZapA; lane 2, ZapB-His6, ZapA and FtsZ; lane 3, ZapB(S4A L5A)-His6 and ZapA; lane 4, ZapB-His6 and FtsZ. BSA at 0.5 mg/ml was present in each reaction mixture. Reaction mixtures were loaded on an SDS-PAGE gel and analyzed by Coomassie staining. The elution profiles of the three proteins were inspected separately by Western blot analysis, as indicated on the figure.
ZapA is a 108-aa protein characterized by an N-terminal globular domain and a C-terminal coiled-coil domain (see Fig. S3B) (30). We also tested ZapA truncation mutants in the BTH assay (Fig. 3B). Mutant ZapA-2 contains the globular domain of ZapA while ZapA-4 contains the coiled-coil domain. ZapA interacted through its coiled-coil domain with ZapB and with itself and through its globular domain with FtsZ. These results support the ZapA-FtsZ interaction model proposed by Low et al. (30).
That ZapB interacts with ZapA via its N-terminal end was confirmed by far-Western blot analyses: in this assay purified ZapA was able to interact with purified FtsZ and ZapB but not with ZapBΔ10 (ZapB-1), and in the same way ZapB but not ZapBΔ10 was able to bind ZapA (Fig. 3C).
To pinpoint the amino acids most important for ZapB's interaction with ZapA, we constructed zapB mutants changing the first 10 amino acids, two-by-two, to alanines. As described above, the ZapB variants were tested in a BTH assay for their interaction with ZapA. The amino acid changes that reduced ZapB's interaction with ZapA were identified [variants ZapB(S4A L5A), ZapB(F8A E9A), and ZapB(K10A L11A)] (Fig. 3D). All these mutants were still able to interact with wild-type ZapB.
Interaction of ZapB(S4A L5A) with ZapA was assayed in vitro by a coelution experiment using ZapB-His6 and ZapB(S4A L5A)-His6 fusions (Fig. 3E). ZapB-His6 bound to a Ni2+-resin was capable of retaining ZapA independently of the presence of FtsZ in the sample. ZapB(S4A L5A)-His6 instead retained significantly less ZapA than the wild-type protein (Fig. 3E, panel c).
We also examined whether FtsZ was retained in the column by ZapB-His6 in the presence of ZapA, but the elution profile showed that FtsZ was only slightly more abundant when ZapA was present than when it was absent, and FtsZ was retained nonspecifically in the column (Fig. 3E, panel d). We previously reported that ZapB forms a high-molecular-weight complex with ZapA and FtsZ (19), but probably the complex formed by the three proteins, with ZapA acting as a linker between FtsZ and ZapB, was not stable enough to resist the washing steps performed in the coelution assay.
Effects of ZapB and ZapA on FtsZ GTPase activity.
Proteins promoting FtsZ protofilament lateral association or bundling increase FtsZ filament stability and therefore cause a reduction in FtsZ's GTPase activity (25, 37, 45).
Small et al. (45) reported that ZapA strongly inhibits FtsZ GTPase activity, whereas Mohammadi et al. (33) reported a milder effect. The latter group suggested that the modest decrease they observed was a consequence of the lateral association of FtsZ protofilaments, known to decrease the GTPase activity of FtsZ (37) and not an effect directly induced by ZapA.
We analyzed the effects of adding equimolar amounts of ZapA and ZapA plus ZapB to FtsZ at pH 6.5 and 7.5 (Fig. 4A and B). ZapA partially inhibited FtsZ activity at both pHs. At pH 6.5, ZapB had no effect, but at pH 7.5, ZapB partially reversed the inhibitory effect of ZapA. ZapB alone had no effect on FtsZ GTPase activity (data not shown).
Fig 4.

ZapB affects FtsZ GTPase activity via ZapA. In all experiments 1 mM GTP, 5 μM FtsZ, 5 μM ZapA, and 5 μM ZapB were used. The graphs report the average of three independent experiments; error bars are the standard deviation of the mean. (A) GTP hydrolysis during FtsZ polymerization in a 30-min time course at pH 6.5. (B) GTP hydrolysis during FtsZ polymerization in a 30-min time course at pH 7.5. Pi, inorganic phosphate.
ZapB and ZapA effects on FtsZ bundling.
First, we inspected FtsZ polymerization. In sedimentation assays increasing amounts of ZapA enhanced FtsZ sedimentation and decreased FtsZ levels in the soluble fraction. The largest amount of FtsZ in the pellet fraction was found when ZapA was at a concentration of 4.8 μM, equal to a ZapA dimer per four FtsZ molecules. Further increasing the ZapA concentration did not enhance FtsZ sedimentation (Fig. 5A). Using light scattering, we confirmed that increasing the ZapA concentration in the polymerization reaction mixture enhanced FtsZ bundle formation, even though, using this technique, saturation of ZapA-induced FtsZ polymerization was not reached even at the highest ZapA concentration (8.3 μM) (Fig. 5B). The light-scattering data showed that FtsZ-ZapA structures evolve over time, especially at higher ZapA concentrations, as suggested by the increasing light-scattering signal during the 30-min time course experiment (Fig. 5B).
Fig 5.

ZapB counteracts ZapA-induced bundling of FtsZ. The sedimentation and the light-scattering assays were performed as described in Materials and Methods in a polymerization buffer at pH 6.5. Polymerization reactions were started by addition of 0.5 mM GTP. S, supernatant; P, pellet. (A) Sedimentation assay of FtsZ. Titration of ZapA (from 0 to 8.3 μM) against FtsZ (8.3 μM). (B) Light scattering. Titration of ZapA (from 2 to 8.3 μM) against FtsZ (8.3 μM). (C) Sedimentation assay. Titration of ZapB (from 0 to 24.9 μM) against FtsZ (8.3 μM) and ZapA (3.2 μM). (D) Sedimentation assay. Titration of ZapB (from 0 to 24.9 μM) against ZapA (3.2 μM). (E) Sedimentation assay. FtsZ (8.3 μM) and ZapA (3.2 μM) incubated with ZapB or ZapB(S4A L5A) or ParB (24.9 μM).
We then tested the effect of ZapB plus ZapA on FtsZ sedimentation using fixed amounts of ZapA and FtsZ, titrating the ZapB concentration from 0 to 24.9 μM. Increasing the ZapB concentration (above 8 μM) caused a reduction in the amount of FtsZ found in the pellet fraction, and FtsZ was now present together with ZapA almost completely in the soluble fractions (Fig. 5C). In contrast, increasing amounts of ZapB did not significantly change the sedimentation pattern of ZapA in the absence of FtsZ (Fig. 5D). In the same assay, a ZapB mutant affected in its interaction with ZapA, and a low-molecular-weight unrelated protein, such as ParB, did not have any effect on FtsZ sedimentation (Fig. 5E).
ZapB alone did not have any significant effect on FtsZ bundling (see Fig. S4A and B in the supplemental material), consistent with a lack of direct interaction between the proteins. We also confirmed that ZapB polymerizes and bundles in the presence of divalent cations such as Ca2+ and that ZapA increases ZapB sedimentation (see Fig. S4B and C). ZapA was in the pellet fractions only when FtsZ or ZapB was present (see Fig. S4D). All the sedimentation and light-scattering assays were performed in a buffer at pH 6.5 and not at the physiological pH of 7.5 because polymerization assays carried out with the three proteins ZapA-FtsZ-ZapB did not give reproducible results at the higher pH.
We analyzed ZapB polymerization by sedimentation assays and sucrose gradient centrifugation and found that it was very similar using buffers with an Mg2+ concentration between 2 and 10 mM at all pHs tested (see Fig. S5 in the supplemental material). ZapB showed the same effect on ZapA-induced FtsZ sedimentation in reaction mixtures containing ZapB, ZapA, and FtsZ in buffers containing either 2 mM or 10 mM MgCl2 (data not shown).
Morphologies of FtsZ, ZapA, and ZapB structures.
The structures formed by FtsZ, ZapA, and ZapB were inspected by TEM. ZapB assembled into cables and bundles with a characteristic, regularly striated pattern in the negative stain in buffers at both pH 6.5 (Fig. 6A) and pH 7.5 (see Fig. S6A in the supplemental material). The ZapB mutant with a reduced ability to interact with ZapA, ZapB(S4A L5A), formed structures indistinguishable from those of the wild-type protein (data not shown). Besides thick cables and bundles, long filaments with a less ordered and organized structure were also present (Fig. 6A, black arrows). We then studied by TEM, using a polymerization buffer at pH 6.5, the structures formed by FtsZ, ZapA, and ZapB when two of the three proteins were combined together in all the possible permutations. FtsZ in the presence of ZapA formed arrays of parallel filaments separated by a fixed width (Fig. 6B). The cables that ZapB formed in the presence of ZapA were different from the ones formed by ZapB alone: they assembled into what seemed to be thicker bundles, and the thin filaments disappeared (Fig. 6C). ZapA caused bundling of ZapB structures, an effect very similar to that caused by the addition of Ca2+ (16). ZapB and FtsZ together in the polymerization reaction formed two distinct structures, similar to the ones formed by the proteins alone (Fig. 6D).
Fig 6.

FtsZ, ZapA, and ZapB form long cable-like structures in vitro. Electron microscopy images of uranyl acetate-stained filaments and bundles. Polymerization reactions were performed at pH 6.5 as described in Materials and Methods. Using high (8.3 μM) or low (2 μM) concentrations of ZapB did not change the morphology of the structures formed. (A) ZapB (4.1 μM). Black arrows, thin ZapB filaments. (B) FtsZ (8.3 μM) and ZapA (3.2 μM). (C) ZapB (3.2 μM) and ZapA (3.2 μM). (D) FtsZ (8.3 μM) and ZapB (2 μM). Black arrows, FtsZ protofilaments. (E) FtsZ (8.3 μM), ZapA (3.2 μM), and ZapB(S4A L5A) (2 μM). Black arrow, array of parallel filaments. (F) FtsZ (8.3 μM), ZapA (3.2 μM), and ZapB (2 μM). Scale bar, 100 nm.
Next, we examined the structures formed by the three proteins combined. The mutant ZapB(S4A L5A) was included in the reaction mixtures as a negative control. In the presence of ZapB(S4A L5A) there were visible long cables, apparently formed by ZapB(S4A L5A), and arrays of parallel FtsZ filaments very similar to the ones formed by FtsZ in the presence of ZapA (Fig. 6E, black arrow). Instead, when wild-type ZapB was used in the polymerization reaction mixtures, the thick cables formed by ZapB disappeared, and the only structures visible were long cable-like filaments, much smaller in diameter than the structures formed by ZapB alone, running parallel to each other or bundling together in bigger complexes (Fig. 6F). The structures formed by the three proteins at pH 7.5 (see Fig. S6B in the supplemental material) were indistinguishable from the ones formed at pH 6.5 (Fig. 6F).
The striated pattern of the cross-linked cables in samples containing FtsZ, ZapA, and ZapB differed from the striation of the ZapB structures in the width of the stripes, which were much wider in the cables formed by ZapB alone. Also the size of the cable-like structures was different; ZapB-cables often merged when running parallel, forming structures with bigger diameters (especially in the presence of ZapA [Fig. 6C, panel c′] or divalent cations), whereas the cables formed by FtsZ-ZapA-ZapB remained independent, producing arrays of parallel filaments.
The structures formed by ZapB in the presence of ZapA resembled those ZapB formed in the presence of 20 mM Ca2+ (20 mM Mg2+ had the same effect on ZapB polymers) (see Fig. S7 in the supplemental material). Higher magnification of the structures showed that ZapA and ZapB together formed bundles of smaller cables (Fig. 7A and B) that, in a few cases, resembled hollow tubular structures (Fig. 7C). To present an overview of the structures, Fig. S7 in the supplemental material shows further images of the cables formed by ZapB alone, ZapB plus ZapA, ZapB alone in buffer containing 20 mM Mg2+, and ZapB(S4A L5A) plus ZapA. Thus, ZapA induced the formation of much larger ZapB structures, similar in size and appearance to those formed by the addition of divalent cations such as Ca2+ or Mg2+.
Fig 7.

ZapA induces bundling of ZapB cables. Electron microscopy images of uranyl acetate-stained cables and bundles formed by ZapA and ZapB (3.2 μM each). Polymerization reactions were performed at pH 6.5 as described in Materials and Methods. Scale bar, 100 nm.
DISCUSSION
A fine balance between the levels of cell division proteins is required for cytokinesis to proceed normally. For example, 2- to 7-fold increases in the level of FtsZ resulted in induction of the minicell phenotype; at 10 times above its normal level, cell division was inhibited, and the cells became filamentous (10, 49). This effect was due to an imbalance of the FtsZ/FtsA ratio, which is critical for cell division to proceed normally (10, 14). It is likely that ZapB, ZapA, and FtsZ are present in the cells in similar amounts. The artificial elevation of ZapB levels has been reported to affect both nucleoid and cell morphology (16).
Supporting a key role of ZapA in recruiting ZapB to the Z ring, an increased level of ZapA caused delocalization of ZapB in the cytoplasm (Fig. 1). This effect was most readily explained by titration of ZapB away from the Z ring. Interestingly, ZapA overproduction also resulted in aberrant localization of FtsZ (Fig. 1) that looked very similar to that observed when ZapC was overproduced; two recent papers reported that in the presence of elevated levels of ZapC, the cells formed filaments and that FtsZ assembled into spots, spirals, and more linear rod-like structures (15, 25). ZapA, as has been proposed for ZapC, is an FtsZ cross-linking and bundling factor (11, 30, 33), so it was not unexpected that increasing its cellular concentration affected Z-ring morphology. However, ZapC was not important for ZapB and ZapA localization and interaction, and its overproduction did not induce ZapB delocalization (see Fig. S1 in the supplemental material).
The FtsZ84 variant has been described to have a reduced GTPase activity and to polymerize inefficiently (3, 4, 7). In a strain carrying the ftsZ84 allele, deletion of zapB resulted in very sick cells (Fig. 2; see also Fig. S2 in the supplemental material). This phenotype raised the possibility that the ZapB role in cell division is strictly linked to FtsZ. Surprisingly, a zapA deletion exhibited a less severe growth defect when combined with the ftsZ84 allele. This observation suggested that ZapB might have a ZapA-independent impact on FtsZ and/or cell division, as we proposed previously (19). In contrast, the combination of the zapB allele with TS mutations in ftsA, zipA, or ftsI did not result in synthetic defects, in keeping with a role for ZapB strictly linked to FtsZ (Fig. 2). The suppressors isolated in the KG22Z84 ΔzapB double mutant mitigated the defects of the ftsZ84 mutant. Phoenix and Drapeau (38) showed that normal cell division activity in a strain carrying the ftsZ84 mutation could be restored by a modest increase in the expression of the TS mutant ftsZ84 or by acquiring a lon mutation. Indeed, at least one of the KG22Z84 ΔzapB suppressors we isolated (sup78) has the mucoid colony phenotype typical of lon mutants. Phoenix and Drapeau (38) suggested that lon mutations could rescue the KG22Z84 phenotype by reducing the degradation of the temperature-sensitive protein.
Mohammadi et al. (33) carefully analyzed the ZapA-FtsZ interaction using buffers with different compositions and pHs and proposed that ZapA is involved in FtsZ filament association during the transition from helical filament to midcell ring. To study the effect of ZapB on FtsZ dynamics, we used the buffers suggested to stimulate FtsZ protofilament association via ZapA. At both the physiological pH of 7.5 and the optimal pH for FtsZ polymerization of 6.5, ZapA reduced FtsZ GTPase activity (Fig. 4). The same strong inhibition was previously reported by Small et al. (45) even though Mohammadi et al. (33) detected only a minor reduction, probably originated by lateral association of FtsZ protofilaments. ZapB at pH 6.5 did not have any effect on FtsZ GTPase activity, but at pH 7.5, where ZapA inhibition was less effective, ZapB partially relieved the inhibition. This effect is most easily explained by titration of ZapA by ZapB, consistent with the effect observed in the sedimentation assays (Fig. 5). In these assays, high concentrations of ZapB caused a dramatic reduction in the amount of FtsZ in the pellet fraction. This effect was specifically induced by ZapB through ZapA since a ZapB mutant with a reduced ability to bind ZapA did not have any effect on FtsZ sedimentation. It is likely that ZapB simply sequesters ZapA so that it is no longer capable of binding to and bundling FtsZ. However, we cannot exclude the possibility that ZapB causes depolymerization of FtsZ via ZapA. Using sedimentation assays, we found that FtsZ pelleting reached saturation using a ZapA/FtsZ ratio of 1:2 even though in light-scattering experiments ZapA-FtsZ structures seemed to evolve over time, and saturation was not reached using even a 1:1 ratio. Previous reports showed a stoichiometry of ZapA-FtsZ interaction of 1:1 (23, 30, 33) or 1:2 (45).
TEM analysis showed that, in the presence of ZapA, FtsZ formed arrays of parallel protofilaments (Fig. 6). ZapB and FtsZ formed two independent structures. ZapB cables in the presence of ZapA had a tendency to merge, forming very large and long bundled structures. FtsZ, ZapA, and ZapB (present at concentrations that did not induce a significant FtsZ depolymerization) formed aligned filaments (from two to five filaments in each array) with a regularly striated pattern, and the characteristic ZapB cables were not visible. A more thorough analysis of the structures formed by ZapB in the presence of ZapA showed that ZapB cables bundled together, twisting around each other, forming structures with diameters up to 100 nm.
All data, in vivo and in vitro, support the formation of a stable complex between ZapA and ZapB, and ZapA seemed to associate more strongly to ZapB than to FtsZ. This finding could offer new insights into understanding how ZapA promotes FtsZ filament bundling at midcell and not at places other than the division site.
Supplementary Material
ACKNOWLEDGMENTS
We thank members of the Centre for Bacterial Cell Biology for stimulating discussions and staff at the Newcastle Biomedical EM Unit for technical support.
This work was supported by the Biotechnology and Biological Sciences Research Council and the EC Consortium DIVINOCELL.
Footnotes
Published ahead of print 4 November 2011
Supplemental material for this article may be found at http://jb.asm.org/.
REFERENCES
- 1. Aarsman ME, et al. 2005. Maturation of the Escherichia coli divisome occurs in two steps. Mol. Microbiol. 55:1631–1645 [DOI] [PubMed] [Google Scholar]
- 2. Adams DW, Errington J. 2009. Bacterial cell division: assembly, maintenance and disassembly of the Z ring. Nat. Rev. Microbiol. 7:642–653 [DOI] [PubMed] [Google Scholar]
- 3. Addinall SG, et al. 2005. New temperature-sensitive alleles of ftsZ in Escherichia coli. J. Bacteriol. 187:358–365 [DOI] [PMC free article] [PubMed] [Google Scholar]
- 4. Anderson DE, Gueiros-Filho FJ, Erickson HP. 2004. Assembly dynamics of FtsZ rings in Bacillus subtilis and Escherichia coli and effects of FtsZ-regulating proteins. J. Bacteriol. 186:5775–5781 [DOI] [PMC free article] [PubMed] [Google Scholar]
- 5. Bi EF, Lutkenhaus J. 1991. FtsZ ring structure associated with division in Escherichia coli. Nature 354:161–164 [DOI] [PubMed] [Google Scholar]
- 6. Blatny JM, Brautaset T, Winther-Larsen HC, Haugan K, Valla S. 1997. Construction and use of a versatile set of broad-host-range cloning and expression vectors based on the RK2 replicon. Appl. Environ. Microbiol. 63:370–379 [DOI] [PMC free article] [PubMed] [Google Scholar]
- 7. Bramhill D, Thompson CM. 1994. GTP-dependent polymerization of Escherichia coli FtsZ protein to form tubules. Proc. Natl. Acad. Sci. U. S. A. 91:5813–5817 [DOI] [PMC free article] [PubMed] [Google Scholar]
- 8. Casadaban MJ, Cohen SN. 1980. Analysis of gene control signals by DNA fusion and cloning in Escherichia coli. J. Mol. Biol. 138:179–207 [DOI] [PubMed] [Google Scholar]
- 9. Chen Y, Erickson HP. 2005. Rapid in vitro assembly dynamics and subunit turnover of FtsZ demonstrated by fluorescence resonance energy transfer. J. Biol. Chem. 280:22549–22554 [DOI] [PMC free article] [PubMed] [Google Scholar]
- 10. Dai K, Lutkenhaus J. 1992. The proper ratio of FtsZ to FtsA is required for cell division to occur in Escherichia coli. J. Bacteriol. 174:6145–6151 [DOI] [PMC free article] [PubMed] [Google Scholar]
- 11. Dajkovic A, Pichoff S, Lutkenhaus J, Wirtz D. 2010. Cross-linking FtsZ polymers into coherent Z rings. Mol. Microbiol. 78:651–668 [DOI] [PubMed] [Google Scholar]
- 12. Datsenko KA, Wanner BL. 2000. One-step inactivation of chromosomal genes in Escherichia coli K-12 using PCR products. Proc. Natl. Acad. Sci. U. S. A. 97:6640–6645 [DOI] [PMC free article] [PubMed] [Google Scholar]
- 13. de Boer P, Crossley R, Rothfield L. 1992. The essential bacterial cell-division protein FtsZ is a GTPase. Nature 359:254–256 [DOI] [PubMed] [Google Scholar]
- 14. Dewar SJ, Begg KJ, Donachie WD. 1992. Inhibition of cell division initiation by an imbalance in the ratio of FtsA to FtsZ. J. Bacteriol. 174:6314–6316 [DOI] [PMC free article] [PubMed] [Google Scholar]
- 15. Durand-Heredia JM, Yu HH, De Carlo S, Lesser CF, Janakiraman A. 2011. Identification and characterization of ZapC, a stabilizer of the FtsZ ring in Escherichia coli. J. Bacteriol. 193:1405–1413 [DOI] [PMC free article] [PubMed] [Google Scholar]
- 16. Ebersbach G, Galli E, Moller-Jensen J, Lowe J, Gerdes K. 2008. Novel coiled-coil cell division factor ZapB stimulates Z ring assembly and cell division. Mol. Microbiol. 68:720–735 [DOI] [PubMed] [Google Scholar]
- 17. Erickson HP, Anderson DE, Osawa M. 2010. FtsZ in bacterial cytokinesis: cytoskeleton and force generator all in one. Microbiol. Mol. Biol. Rev. 74:504–528 [DOI] [PMC free article] [PubMed] [Google Scholar]
- 18. Fu G, et al. 2010. In vivo structure of the E. coli FtsZ-ring revealed by photoactivated localization microscopy (PALM). PLoS One 5:e12682. [DOI] [PMC free article] [PubMed] [Google Scholar]
- 19. Galli E, Gerdes K. 2010. Spatial resolution of two bacterial cell division proteins: ZapA recruits ZapB to the inner face of the Z-ring. Mol. Microbiol. 76:1514–1526 [DOI] [PubMed] [Google Scholar]
- 20. Goehring NW, Beckwith J. 2005. Diverse paths to midcell: assembly of the bacterial cell division machinery. Curr. Biol. 15:R514–R526 [DOI] [PubMed] [Google Scholar]
- 21. Goehring NW, Gueiros-Filho F, Beckwith J. 2005. Premature targeting of a cell division protein to midcell allows dissection of divisome assembly in Escherichia coli. Genes Dev. 19:127–137 [DOI] [PMC free article] [PubMed] [Google Scholar]
- 22. Gonzalez JM, et al. 2003. Essential cell division protein FtsZ assembles into one monomer-thick ribbons under conditions resembling the crowded intracellular environment. J. Biol. Chem. 278:37664–37671 [DOI] [PubMed] [Google Scholar]
- 23. Gueiros-Filho FJ, Losick R. 2002. A widely conserved bacterial cell division protein that promotes assembly of the tubulin-like protein FtsZ. Genes Dev. 16:2544–2556 [DOI] [PMC free article] [PubMed] [Google Scholar]
- 24. Guzman LM, Belin D, Carson MJ, Beckwith J. 1995. Tight regulation, modulation, and high-level expression by vectors containing the arabinose PBAD promoter. J. Bacteriol. 177:4121–4130 [DOI] [PMC free article] [PubMed] [Google Scholar]
- 25. Hale CA, et al. 2011. Identification of Escherichia coli ZapC (YcbW) as a component of the division apparatus that binds and bundles FtsZ polymers. J. Bacteriol. 193:1393–1404 [DOI] [PMC free article] [PubMed] [Google Scholar]
- 26. Jaiswal R, Panda D. 2009. Differential assembly properties of Escherichia coli FtsZ and Mycobacterium tuberculosis FtsZ: an analysis using divalent calcium. J. Biochem. 146:733–742 [DOI] [PubMed] [Google Scholar]
- 27. Karimova G, Pidoux J, Ullmann A, Ladant D. 1998. A bacterial two-hybrid system based on a reconstituted signal transduction pathway. Proc. Natl. Acad. Sci. U. S. A. 95:5752–5756 [DOI] [PMC free article] [PubMed] [Google Scholar]
- 28. Lanzetta PA, Alvarez LJ, Reinach PS, Candia OA. 1979. An improved assay for nanomole amounts of inorganic phosphate. Anal. Biochem. 100:95–97 [DOI] [PubMed] [Google Scholar]
- 29. Li Z, Trimble MJ, Brun YV, Jensen GJ. 2007. The structure of FtsZ filaments in vivo suggests a force-generating role in cell division. EMBO J. 26:4694–4708 [DOI] [PMC free article] [PubMed] [Google Scholar]
- 30. Low HH, Moncrieffe MC, Lowe J. 2004. The crystal structure of ZapA and its modulation of FtsZ polymerisation. J. Mol. Biol. 341:839–852 [DOI] [PubMed] [Google Scholar]
- 31. Lowe J, Amos LA. 1999. Tubulin-like protofilaments in Ca2+-induced FtsZ sheets. EMBO J. 18:2364–2371 [DOI] [PMC free article] [PubMed] [Google Scholar]
- 32. Lu C, Stricker J, Erickson HP. 1998. FtsZ from Escherichia coli, Azotobacter vinelandii, and Thermotoga maritima—quantitation, GTP hydrolysis, and assembly. Cell Motil. Cytoskeleton 40:71–86 [DOI] [PubMed] [Google Scholar]
- 33. Mohammadi T, et al. 2009. The GTPase activity of Escherichia coli FtsZ determines the magnitude of the FtsZ polymer bundling by ZapA in vitro. Biochemistry 48:11056–11066 [DOI] [PMC free article] [PubMed] [Google Scholar]
- 34. Mukherjee A, Dai K, Lutkenhaus J. 1993. Escherichia coli cell division protein FtsZ is a guanine nucleotide binding protein. Proc. Natl. Acad. Sci. U. S. A. 90:1053–1057 [DOI] [PMC free article] [PubMed] [Google Scholar]
- 35. Mukherjee A, Lutkenhaus J. 1994. Guanine nucleotide-dependent assembly of FtsZ into filaments. J. Bacteriol. 176:2754–2758 [DOI] [PMC free article] [PubMed] [Google Scholar]
- 36. Mukherjee A, Lutkenhaus J. 1998. Dynamic assembly of FtsZ regulated by GTP hydrolysis. EMBO J. 17:462–469 [DOI] [PMC free article] [PubMed] [Google Scholar]
- 37. Mukherjee A, Lutkenhaus J. 1999. Analysis of FtsZ assembly by light scattering and determination of the role of divalent metal cations. J. Bacteriol. 181:823–832 [DOI] [PMC free article] [PubMed] [Google Scholar]
- 38. Phoenix P, Drapeau GR. 1988. Cell division control in Escherichia coli K-12: some properties of the ftsZ84 mutation and suppression of this mutation by the product of a newly identified gene. J. Bacteriol. 170:4338–4342 [DOI] [PMC free article] [PubMed] [Google Scholar]
- 39. Pichoff S, Lutkenhaus J. 2002. Unique and overlapping roles for ZipA and FtsA in septal ring assembly in Escherichia coli. EMBO J. 21:685–693 [DOI] [PMC free article] [PubMed] [Google Scholar]
- 40. Popp D, Iwasa M, Narita A, Erickson HP, Maeda Y. 2009. FtsZ condensates: an in vitro electron microscopy study. Biopolymers 91:340–350 [DOI] [PMC free article] [PubMed] [Google Scholar]
- 41. RayChaudhuri D. 1999. ZipA is a MAP-Tau homolog and is essential for structural integrity of the cytokinetic FtsZ ring during bacterial cell division. EMBO J. 18:2372–2383 [DOI] [PMC free article] [PubMed] [Google Scholar]
- 42. RayChaudhuri D, Park JT. 1992. Escherichia coli cell-division gene ftsZ encodes a novel GTP-binding protein. Nature 359:251–254 [DOI] [PubMed] [Google Scholar]
- 43. Rivas G, et al. 2000. Magnesium-induced linear self-association of the FtsZ bacterial cell division protein monomer. The primary steps for FtsZ assembly. J. Biol. Chem. 275:11740–11749 [DOI] [PubMed] [Google Scholar]
- 44. Rueda S, Vicente M, Mingorance J. 2003. Concentration and assembly of the division ring proteins FtsZ, FtsA, and ZipA during the Escherichia coli cell cycle. J. Bacteriol. 185:3344–3351 [DOI] [PMC free article] [PubMed] [Google Scholar]
- 45. Small E, et al. 2007. FtsZ polymer-bundling by the Escherichia coli ZapA orthologue, YgfE, involves a conformational change in bound GTP. J. Mol. Biol. 369:210–221 [DOI] [PubMed] [Google Scholar]
- 46. van den Ent F, Johnson CM, Persons L, de Boer P, Lowe J. 2010. Bacterial actin MreB assembles in complex with cell shape protein RodZ. EMBO J. 29:1081–1090 [DOI] [PMC free article] [PubMed] [Google Scholar]
- 47. Van Melderen L, Aertsen A. 2009. Regulation and quality control by Lon-dependent proteolysis. Res. Microbiol. 160:645–651 [DOI] [PubMed] [Google Scholar]
- 48. Vicente M, Rico AI. 2006. The order of the ring: assembly of Escherichia coli cell division components. Mol. Microbiol. 61:5–8 [DOI] [PubMed] [Google Scholar]
- 49. Ward JE, Jr., Lutkenhaus J. 1985. Overproduction of FtsZ induces minicell formation in E. coli. Cell 42:941–949 [DOI] [PubMed] [Google Scholar]
- 50. Yu XC, Margolin W. 1997. Ca2+-mediated GTP-dependent dynamic assembly of bacterial cell division protein FtsZ into asters and polymer networks in vitro. EMBO J. 16:5455–5463 [DOI] [PMC free article] [PubMed] [Google Scholar]
Associated Data
This section collects any data citations, data availability statements, or supplementary materials included in this article.