Abstract
This article describes the potentials and challenges of quantitative analyses of human neonatal brain images using structural MR imaging and diffusion tensor imaging. To maximize the potential of MR imaging for neonatal brain studies, the combination of both contrasts is highly beneficial. Based on the multicontrast data, a neonate brain atlas was created, which allows automated segmentation of neonate brain MR images. The accuracy, advantages, and potential pitfalls of this atlas-based segmentation approach are discussed. The accurate and reproducible MR imaging quantification achieved by this approach could be an initial step toward the successful clinical evaluation of the neonatal brain.
Keywords: neonate, diffusion tensor imaging, normalization, quantification, brain atlas
Introduction: MRI modalities applicable to neonatal brain analysis
Recent advances in MRI techniques enable scanning of the neonatal brain with various techniques. These include structural MRI (T1-, T2- weighted images), diffusion tensor imaging (DTI), perfusion MRI, functional MRI, MR angiography, and MR spectroscopy. However, because of the small size of the neonate brain, limited scan time, and image contrasts that are very different from adult brains, there are unique issues that must be addressed to develop an effective quantitative neonate MRI technique. This article focuses on a state-of-the-art quantification method for structural MRI and DTI of neonates, which helps to deepen the understanding of human brain development, and the potential for the clinical application of quantitative MRI techniques.
Importance of neonatal brain MRI analysis
The brain suffers various insults during the pre- and peri-natal period, such as hypoxia-ischemia, infection, and exposure to toxic substances. There are also genetic abnormalities that affect brain development. Preterm birth and low birth weight are also risk factors for brain damage. Severely damaged babies show abnormal symptoms immediately after birth. Mild to moderate damage has been linked to abnormalities later in life. For example, approximately 50% of babies born at very preterm, defined as ≤32 gestational weeks, are at risk for developing cerebral palsy, epilepsy, impaired academic achievement, and behavioral disorders, including attention-deficit/hyperactivity disorder 7,8,30. However, most neuropsychologic impairments are not obvious during the first year of life. Therefore, a symptom-based diagnosis is extremely difficult for neonates with mild to moderate brain damage. For successful early interventions, an effective evaluation method is needed to detect and characterize brain damage as early as possible. Evaluation of neonatal brain damage using MRI has several advantages. First, MRI is sensitive for the detection of subtle brain abnormalities compared with other imaging modalities, such as CT and ultrasound. Previous studies using conventional T1- and T2- weighted images indicate that an expert radiologist can detect some abnormality in 70% of MR scans from very preterm infants 37. Second, the scanning of non-sedated neonates is better for the neonate, and progressively becomes more difficult until the fourth year of life, because of the greater motion and shorter sleep time. Neonates can be scanned during hospitalization, which is another advantage. In addition, MRI is now widely available, and, once the protocol and image-processing stream are accomplished, they can be performed and implemented on routine clinical scanners.
Features of the neonatal brain MRI
Anatomy of the neonatal brain
The most striking difference between the neonatal brain and the adult brain is size. The neonatal brain volume is approximately 1/3 – ¼ that of the adult brain. Inside the brain, the immature architecture is constantly developing. The cerebral cortex develops sequentially. The most prominent neuronal form in the neonatal brain is the pyramidal cell. Pyramidal cells are guided from the deep part of the brain (subventricular zone) to the cortical area (subplate: a transient developmental layer of the cortex) during 12–20 weeks gestation. After they arrive at the subplate, pyramidal neurons begin to make synapses and elaborate a dendritic tree. The axons and dendrites, along with fine glial processes, make up the neuropil. At term, pyramidal cells dominate the cortex, but the neuropil development is still insufficient. Pyramidal cells have a prominent apical dendrite extending from the top of the cell body to layer I; these large dendrites give a strong radial orientation to the cortex.
Myelination of the human brain begins at approximately 29 weeks of gestation in the telencephalon13. The myelin sheath is formed by oligodendrocytes (OL). The OL and its product, myelin, are synergistic with the developing axon 36 (ie, the axonal cytoskeleton does not form properly in the absence of myelin) 38, whereas the amount of myelin formed by the OL is controlled by the rate of expansion of the growing axonal cylinder 17. Myelination proceeds in a temporally and spatially inhomogeneous manner 36. Specifically, tracts in the brain myelinate at different rates and times. At term, the axonal network is still developing and the myelination is insufficient in most of the white matter structures, except for some tracts in the brain stem.
Structural MRI of the neonatal brain
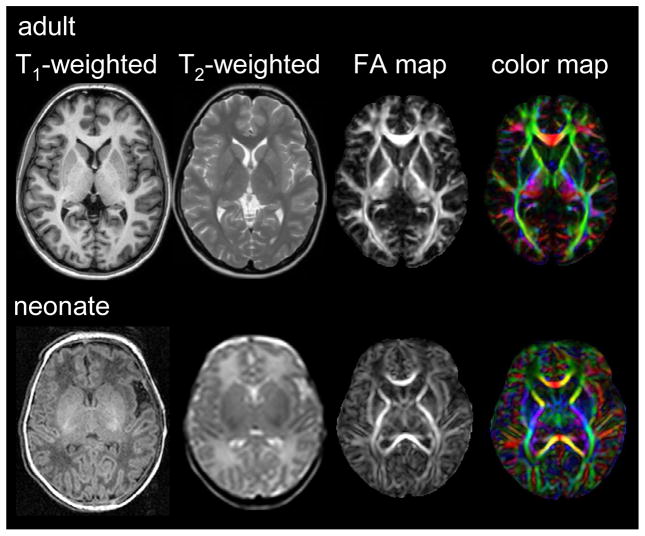
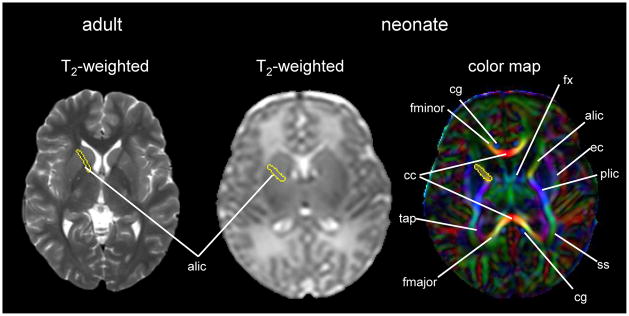
The neonatal brain is immature. On T1-weighted images, the intensity of the white matter is lower than that of the gray matter. On T2-weighted images, the intensity of the white matter is higher than that of the gray matter. These contrasts are the reverse of those seen in adults [Fig. 1]. This is caused by the incomplete myelination in the white matter of the neonatal brain. Because of the variability of the myelination status in different fibers, the contrast between the gray and white matter in some areas is very poor. For example, the anterior limb of the internal capsule is one of the most myelinated areas at term. Consequently, the signal intensity of this structure on T2-weighted images is lower than the other white matter areas and very close to that of the surrounding gray matter structures. Although identification of this area is easy on T2-weighted images in the adult, it is extremely difficult in the neonatal brain [Fig. 2]. To quantify the absolute T1- and T2- relaxation time of each brain structure, a quantitative T1 map and T2 maps can be created, in which T1- and T2- relaxation time are measured at each voxel. For example, the T2 map, which is often used to evaluate the myelination status of the brain, can be calculated from dual or multiple echo fast spin echo sequences by fitting the images with different echo times to an exponential model.
Fig. 1.
Comparison between adult and neonate MRI. The white matter/gray matter contrast of the neonatal brain is inverted in T1- and T2- weighted images. The white matter structures of the neonate show a lower FA than the adult. However, the cortex has a higher FA.
Fig. 2.
An example of an adult T2- weighted image and a neonatal T2- weighted image and color map. The anterior limb of the internal capsule is identified in the adult T2- weighted image, but difficult to identify in the neonatal T2- weighted image. Using a color map, various white matter structures can be readily identified, even in the poorly myelinated neonatal brain. Coordinates of the anterior limb of the internal capsule were transferred from the color map to the T2- weighted image. Abbreviations: alic/plic=anterior and posterior limb of internal capsule; cc=corpus callosum; cg=cingulum; ec=external capsule; fx=fornix; fmajor/fminor=forceps major and minor; ss=sagittal striatum; and tap=tapatum
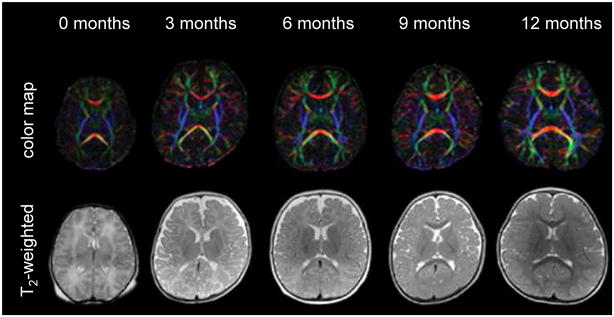
From MRI studies of normal postnatal brain development, several important time-dependent MR signal changes, such as a shortening of T1 and T2 relaxation times of the gray and white matter 2,4,5,10, have been described previously. Most of the time-dependent changes are attributed to an increase in lipid concentration caused by the myelination process.1,20,24,29,35 Because the white matter appears as hyperintense on newborn T2-weighted images, the rapid shortening of T2 in the white matter results in “contrast inversion” between the white and gray matter during postnatal development [Fig. 3].
Fig. 3.
Color map and T2-weighted images of 0 – 12-month-old infants. (From Susumu M. Introduction to diffusion tensor imaging. Amsterdam (The Netherlands): Elsevier; 2007. p. 159; with permission.)
DTI of the neonatal brain
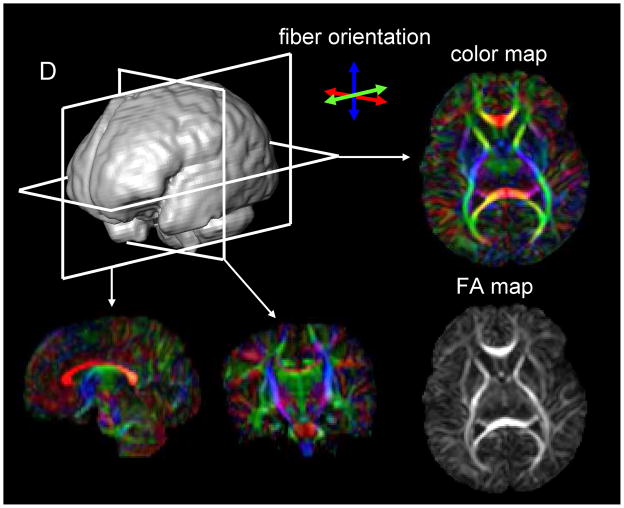
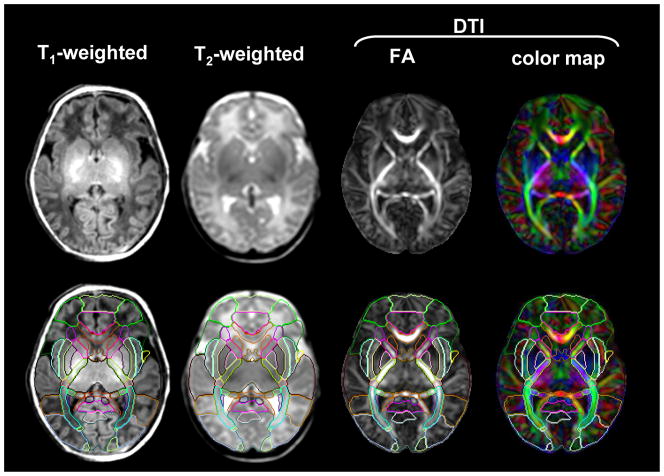
DTI is a technique that can provide unique image contrasts inside the brain.3,11,21,32 MRI can measure the extent of water diffusion (ie, the random motion of water) along an arbitrary axis. From this measurement, it is often found that water tends to diffuse along a preferential axis, which has been shown to coincide with the orientation of ordered structures, such as fiber tracts. Based on the diffusion orientation of water molecules, this technique can provide several types of new imaging contrasts, such as anisotropy maps and orientation maps, or a combination of the two, which is called a color-coded orientation map or simply a color map hereafter [Fig. 4]. One of the most widely used metrics of diffusion anisotropy is “fractional anisotropy (FA)” 31,32, in which anisotropy is scaled from 0 (isotropic) to 1 (anisotropic). In the color map, the brightness shows the extent of the anisotropy and the color represents fiber orientation [Fig. 4].
Fig. 4.
DTI-based images of a neonatal brain. The raw data are three-dimensional and arbitrary slice angles and positions can be extracted. The FA and color maps have the same image intensity, but the color map has additional orientation information represented by colors. In the color map, fibers orienting along the right-left, dorsal-ventral, and caudal-rostral axes are indicated by the red, blue, and green colors, respectively.
DTI can reveal the detailed white matter anatomy of pre-myelinated brains. In [Fig. 2], white matter tracts (indicated by white labels) can be clearly identified on the color map, but not on the T2–weighted images of the neonatal brain at 40 post-conceptional weeks. This suggests that the diffusion measurement is sensitive to axonal geometry rather than myelination. It is thus likely that the anisotropy measurements allow the monitoring of axonal injuries. During the postnatal period, the anisotropy of the white matter further increases [Fig. 3]. 1,12,19,21,23,24 This is likely caused by myelination of the axons, although it could also be caused by an increase in axonal density or axon caliber. The diffusion anisotropy of the neonatal cortex is higher than that of adults, caused by neatly aligned large dendrites of the pyramidal cells in the cortex. Anisotropy of the cortex decreases rapidly after birth, suggesting that the development of axonal and dendritic arbors in the neuropil destroys the coherent water motion along the columnar organization of the cortex.
Complementary role of structural MRI and DTI
Structural MRI and DTI are complementary techniques. DTI provides superior anatomical information about pre-myelinated brains, but less information about myelination status compared with a T2 map. Indeed, myelination increases the anisotropy of water molecules, but other factors, such as axon and neuropil development, also affect anisotropy, which makes it less specific as an indicator of myelination. One of the biggest problems with T2 maps is, ironically, their high sensitivity to the myelination process. A T2 map is a very poor tool with which to describe the anatomy of pre-myelineated brains. Especially during the contrast inversion period, T2 maps often cannot even differentiate the gray and white matter. Unless we can discretely identify anatomic units of interest, one cannot quantify their T2 values in an anatomy-specific manner.
Current clinical applications for neonatal brain MRI
Conventional T1- and T2- weighted images already have the ability to detect brain malformations, intra-cranial hemorrhage, ischemic-hypoxic injury, signal alteration of the gray and white matter caused by seizure or metabolic abnormalities, atrophy, and ventricular enlargement. Some of these imaging features can be related to the prognosis. In the white matter area, periventricular hemorrhagic infarction and cystic periventricular white matter damage are associated with poor motor outcome,6,33 and thinning of the corpus callosum is related to cerebral palsy and motor delay.9 Gray matter loss and ventricular enlargement have been correlated with neurologic outcome at one year.14 However, there have been studies that indicate that diffuse periventricular leukomalacia, ventricular size, and the surface area of the corpus callosum do not correlate with neurologic outcomes. The problem is that each study has used different measurements to evaluate imaging features and clinical outcomes, which makes it difficult to compare these results. Therefore, the neurologic prognostic capability is still controversial.
From qualitative to quantitative analysis
Requirements for data quantification
Although conventional T1- and T2-weighted images have been valuable tools to diagnose gross brain injuries, more subtle or diffuse damage has often been difficult to study. To improve the accuracy of abnormality detection and to extract more objective findings, a quantitative evaluation is required. If one can provide quantitative measures, such as volumes, shapes, and various MR parameters (e.g., T1, T2, anisotropy, diffusivity, etc.) of various brain regions of the patient, and the normal range and cut-off values, one can use those measures much like the results of blood tests are used. This not only would draw attention to potentially abnormal areas, but also provide new ways to evaluate MR images, thus expanding the ability of MR-based diagnosis by enabling one to detect previously hard-to-define abnormalities. The numbers would enable a clinician to conduct a statistical comparison between diagnostic groups, and also provide the potential to estimate the impact on the neurologic symptom or future neurologic outcomes, which is important for neonatal brain studies. Such research will be an important foundation to create diagnostic guidelines. Toward this end, there is a need to establish a data quantification method as an initial step.
Strategy for data quantification
For data quantification, areas from which to extract the MR parameters need to be defined (e.g., T2 values). The defined area is often called a region of interest (ROI). There are three axes to define the ROI: size (large or small); number (single or multiple); and the way the area is defined (manual or automated). For example, the manual ROI method is a straightforward approach to measure MR parameters of the specific brain structure with rich localized information. However, the number of ROIs is usually limited because drawing an ROI is labor-intensive and time-consuming. This causes insufficient spatial specificity of the findings because huge brain areas remain unsurveyed. The ROIs are placed according to the a priori hypothesis, which means that this type of analysis can only be applicable for hypothesis-driven studies. There is also an issue with reproducibility. For the ROI drawing, corresponding image slice levels and locations of the brain structures among different subjects are judged based on anatomic features. However, adjusting brain position and angle at the time of the scan is not easy in the neonate brain. The ROI drawing itself requires anatomic knowledge about the neonatal brain; therefore, the reproducibility depends on the operator’s skill. To achieve high reproducibility, one can increase the size of the ROI. In an extreme case, one can identify the entire brain as an ROI. In this case, one can define the ROI within a subject or across subjects with almost perfect reproducibility, but there is no localized information. In general, a manual ROI method has the inverse relationship between reproducibility and spatial information. Therefore, the other end of the extreme is using a voxel as the ROI, which has the most localization information. However, matching voxel-to-voxel manually across subjects is almost impossible.
For the initial step toward clinical application, it is necessary to screen a whole brain with rich spatial information. To handle large amounts of image data, an automated method is preferable. Voxel-based analyses, which perform the automated whole-brain voxel matching using computer software, seemed suitable for this purpose. Matching all voxels to corresponding voxels between two brains means transforming the shape of one to the other. This procedure is often called “normalization.” It has the highest possible localized information. The reproducibility depends on the method used for the image normalization, which will be discussed later.
Statistical analysis after normalization of an individual brain to an atlas space is an effective quantification strategy to detect differences between a target group and a control group without an a priori hypothesis. This strategy is also suitable for automated detection of the pathology. One important drawback of this voxel-based statistical comparison is the low sensitivity for detecting wide-spread subtle abnormalities. Because of the large number of the voxels and the noise, it is not easy to achieve statistical significance, especially after a multiple-comparison correction. To partially address this issue, isotropic “smoothing” or “filtering” of the image is often used. Another idea to increase the statistical power to detect widespread subtle abnormalities is to use an atlas-based analysis. In this method, a pre-segmented set of ROIs, which covers the entire brain, is overlaid on the normalized image to measure MR parameters inside the ROIs. The automatically placed ROI is regarded as a filter to group voxels in anatomically reasonable way. Therefore, if one wants to achieve higher statistical power, one can increase the size of each ROI and reduce the total number of ROIs. In contrast, if one wants to know the precise localization of the abnormality, one can reduce the size of each ROI and increase the total number or ROIs. Again, the most extreme case is to use each voxel as an ROI. In either case, accurate image normalization is key for the quantitative image analysis.
Normalization-based neonatal brain MRI analysis
Current status of the normalization-based MRI analysis
For MRI analysis of the adult or child’s brain, normalization-based quantitative analysis methods are widely used, which is an effective way to characterize the anatomy of the normal population and pathologic changes.26 However, for the neonate population, there are only a small number of studies using image normalization.15,16,34 There are two reasons that hinder normalization-based MRI analysis of the neonatal brain. One is the lesser gray matter/white matter contrast in the neonatal brain. Transformation uses image contrasts to co-register the subjects’ brain structures to that of the template. However, T1- and T2-weighted images from neonates have less contrast between each brain structure compared with the adult brain. The other is the lack of a standard neonatal atlas. For a study in a single institution, an arbitrarily-selected image can be a template for the image normalization. However, if one wants to compare the results from multiple institutions, a “standardized” atlas on which to transform the image and report the area with significance with “common language” is needed. Because of the huge difference in image contrast between the neonatal and adult brain, one needs an atlas specifically made for the neonatal brain. For adult brain analysis, several brain atlases in standard space, such as Montreal Neurological Institute (MNI) space or Talairach space, are commonly used in the neuroimaging community. However, for neonatal studies, only a T1-weighted template created by averaging seven patients’ brains (not normal control brains) and a T2-weighted template of 2 -3 month-olds (therefore, not a neonatal template) (http://www.unicog.org/main/pages.php?page=Infants) were available to the neuroimaging community until 2011.16
Core components of the normalization-based analysis
The development of the neonatal brain is not uniform. Each brain structure develops at different times and rates. Especially for the white matter tracts, the myelination status and speed varies greatly. Therefore, each white matter structure must be identified accurately to avoid false-positive findings. For example, the superior longitudinal fasciculus is poorly myelinated in the neonatal brain, but the corticospinal tract is already myelinated to some extent. These two fibers are next to each other at the level of the centrum semiovale. If part of the superior longitudinal fasciculus is mislabeled as the corticospinal tract, one might conclude, wrongly, that the area is abnormal (less myelinated than usual). To avoid false-positive findings and to increase statistical power, the accuracy of the normalization, which guarantees each brain structure is correctly registered to the template space, is a crucial requirement.
Clear contrasts between each brain structure and appropriate normalization method are the two core components necessary for successful neonatal brain quantification. To satisfy these requirements, the authors created a neonatal brain atlas with multiple contrasts (JHU-neonate atlas, http://cmrm.med.jhmi.edu/cmrm/Data_neonate_atlas/atlas_neonate.htm)27, and combine the atlas with a state-of-the-art normalization method, large deformation diffeomorphic metric mapping (LDDMM).27
Multi-contrast atlas of the neonatal brain
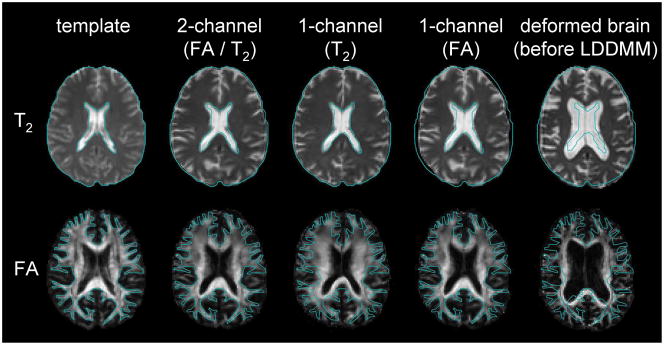
There are various types of image contrasts that MRI can create, each with specific benefits. T2-weighted images have good contrast between brain tissue and the cerebrospinal fluid space, but lack contrasts inside the white matter area, which is treated as a large single compartment. DTI, however, has very rich contrasts within the white matter, enabling identification of various white matter structures, yet the brain boundary and ventricle shapes are obscure. In this way, T2 and DTI carry anatomic information that is spatially complementary. Conventionally, when one performs a brain transformation to an atlas, one needs to choose one of the image contrasts to drive the registration algorithm. If one uses only one of the contrasts, the anatomic information is not sufficient to obtain satisfactory registration [Fig. 5]. This is why there is a need to develop a multi-contrast template for normalization, in which multiple contrasts are provided simultaneously.
Fig. 5.
The efficacy of dual-channel image registration. The blue line indicates the boundary of the brain (T2) and the white matter (FA) of the template. T2 and DTI carry contrasts in a spatially complementary manner. In this example, the atrophic brain with substantial ventricular enlargement is normalized to the template. When T2 is used to drive the transformation, the brain boundary and the ventricle of the patient become very similar to those of the template (T2), but the white matter structure is not similar to that of the template. If only the FA map is used, the white matter shape becomes very similar to the template, but the brain boundary is not matched (FA). By using both contrasts, the registration quality of the entire brain drastically improves (FA/T2). (From Ceritoglu C, Oishi K, Li X et al. Multi-contrast large deformation diffeomorphic metric mapping for diffusion tensor imaging. NeuroImage 2009;47:618; with permission.)
The JHU-neonate atlas includes T1- and T2-weighted contrasts and DTI-derived contrasts. One hundred twenty two brain structures were parcellated in the atlas [Fig. 6] to create the “parcellation map,” according to our previous publications.25,28 The authors created both a population-averaged atlas and a single-subject atlas. The purpose of a population-averaged atlas is to determine the average shape and size of the neonatal brain. This atlas can be used as a template for brain normalization using linear transformations or non-linear transformations with image “smoothing.” However, as a result of averaging, the sharpness of the image contrast can be lost 22. Therefore, a single-subject atlas, with the size adjusted to that of the population-averaged atlas, was also created, providing a template for highly elastic non-linear transformations, which require sharp image features 25.
Fig. 6.
The attempt to parcellate 122 brain structures from a full-term neonate. (From Oishi K, Mori S, Donohue PK, et al. Multi-contrast human neonatal brain atlas: application to normal neonate development analysis. NeuroImage 2011;56:8; with permission.)
Current practical issues and the future of normalization-based neonatal brain analysis
The authors are currently working on optimizing the MRI settings and the analysis tool (combination of the multi-contrast neonatal brain atlas and LDDMM) to provide a good experimental environment for clinical researchers. Some of their experiences are described next.
Success rate of the neonatal scan
Seventy normal-term neonates (within 48 hours of birth) were scanned using a Johns Hopkins University protocol on a 3.0T magnet. Total time required for each neonate was approximately 30 minutes. Specifically, 5 min for each DTI acquisition with three repetitions to increase signal-to-noise ratio (15 min), two additional scans for TE = 42 ms and 100 ms to obtain a T2 map (6 min), and an MPRAGE image for anatomical reference (5 min) were obtained. To ensure that neonates were sleeping during the scan, neonates were well fed before the scan and were well wrapped with a blanket with the ears covered by earmuffs. The subjects were then placed in cushions that occupied spaces between the subject and the RF coil. Fifty-three of the 70 neonates slept through the scans without sedation (success rate of 75%).
Normalization accuracy
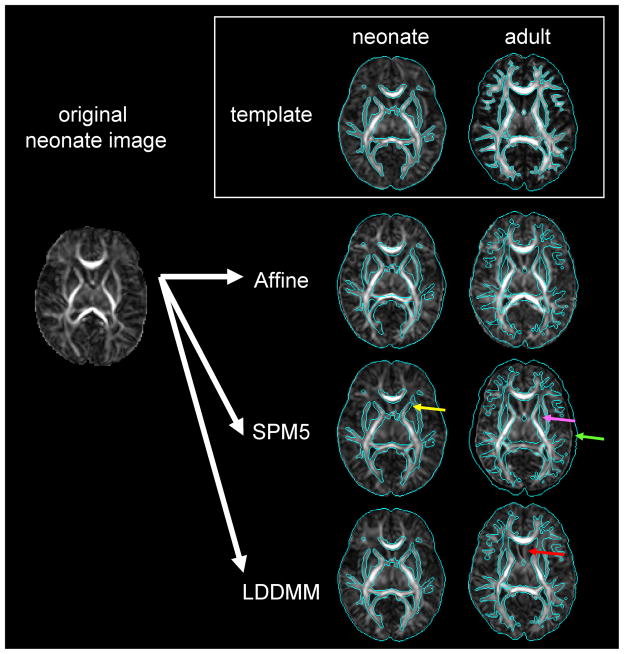
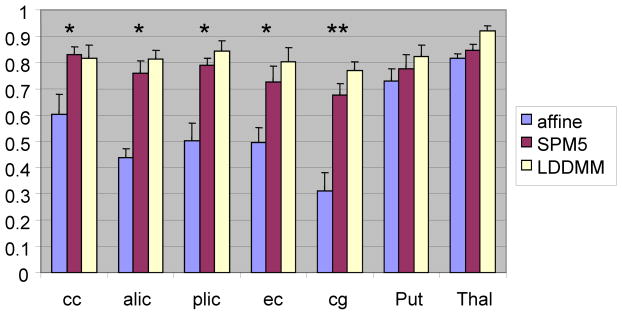
As a preliminary analysis, the accuracy of normalization was compared using linear affine transformation, non-linear transformation of SPM5, and of dual-channel LDDMM, which uses FA and T2 contrasts simultaneously [Fig. 7, 8]. To evaluate the registration quality, reliability analyses were performed to estimate kappa statistics, based on Landis and Koch.18 According to the criteria, a kappa value of 0.11–0.2 is considered “slight,” 0.21–0.4 is “fair,” 0.41–0.60 is “moderate,” 0.61–0.80 is “substantial,” and 0.81–1.0 is “almost perfect” registration between a subject image and the atlas. Dual-channel LDDMM successfully improved the overall normalization accuracy to satisfy the requirement for neonatal brain MRI analysis in a structure-specific manner.
Fig. 7.
The preliminary attempt to normalize a neonatal image to the neonatal template (single-subject image) and the adult template (JHU-MNI template 25) using various normalizing methods. Normalized images (two right columns) were overlaid by the brain surface and WM areas of the templates, indicated by the blue contours. For all normalization methods, the neonatal template performed better than the adult template. The combination of the neonatal template and LDDMM achieved the best registration quality. Non-linear transformation of SPM5 (http://www.fil.ion.ucl.ac.uk/spm/) also demonstrated considerable registration quality with the neonatal template, although some mis-registrations are indicated [e.g., yellow arrow: the putamen was classified as the anterior limb of the internal capsule]. This registration quality was better than that registered with the adult template (pink arrow: globus pallidum was classified as the internal capsule; green arrow: mis-registration of the brain surface). LDDMM has enough transformation to normalize a neonatal image to the adult template, but the result was unreliable for the low FA structures, such as the septum (red arrow).
Fig. 8.
Comparison of kappa values for each brain structure. LDDMM can improve registration accuracy in most structures, compared with linear (affine) transformation. One could also see the improvement in registration accuracy in the cingulum compared with the non-linear transformation of SPM5. The data are from the average values of 10 full-term neonates (*: significant improvement compared with affine, p<0.05 corrected after multiple comparisons; **: significant improvement compared with both affine and SPM5, p<0.05 corrected after multiple comparisons). The results indicate that this single-subject neonatal template is also applicable to the SPM, which is widely used in the neuroimaging community. cc = corpus callosum; alic = anterior limb of the internal capsule; plic = posterior limb of the internal capsule; ec = external capsule; cg = cingulum; Put = putamen; Thal = thalamus.
Future application of the normalization based neonatal MRI analysis
Future applications for this atlas include scientific investigations, such as determining the effects of prenatal events (hypoxia-ischemia, infections, or exposure to toxic substances) and the effects of preterm birth or low birth weight. This method enables one to perform whole-brain analysis, which is important for the visualization of structural specificity, but which was lacking in previous studies. These basic studies will lead to more clinical investigations, such as seeking imaging biomarkers for various neurologic disorders. The final goal is to use the measured value much like the results from blood tests, to make a diagnosis, evaluate the treatment, and predict future neurologic outcomes. Another goal is to create diagnostic criteria for the automated diagnosis of various diseases.
Summary
This article describes the anatomical features of the neonatal brain and how one can quantify those features using structural MRI and DTI, which are complementary techniques. To maximize the potential of MRI for neonatal brain studies, the authors proposed to quantify both contrasts with a state-of-the-art diffeomorphic normalization method. Accurate and reproducible MRI quantification achieved by this method is an initial step toward the successful clinical research studies of the neonatal brain.
Acknowledgments
The authors thank Dr. Jon Skranes, Dr. Tomas Ernst, and Dr. Linda Chang for their helpful comments, and Ms. Mary McAllister for manuscript editing. This publication was made possible by grants from the National Institutes of Health (R21AG033774, P41RR015241, U24RR021382, P01EB001955, R01AG20012, and R01HD065955), and from the National Center for Research Resources grant G12-RR003061.
Footnotes
Publisher's Disclaimer: This is a PDF file of an unedited manuscript that has been accepted for publication. As a service to our customers we are providing this early version of the manuscript. The manuscript will undergo copyediting, typesetting, and review of the resulting proof before it is published in its final citable form. Please note that during the production process errors may be discovered which could affect the content, and all legal disclaimers that apply to the journal pertain.
Contributor Information
Kenichi Oishi, Assistant Professor of Radiology, The Russell H. Morgan Department of Radiology and Radiological Science, The Johns Hopkins University School of Medicine, Baltimore, Maryland.
Andreia V. Faria, The Russell H. Morgan Department of Radiology and Radiological Science, The Johns Hopkins University School of Medicine, Baltimore, Maryland; and Professor of Radiology, Department of Radiology, University of Campinas, Campinas, SP, Brazil.
Susumu Mori, Professor of Radiology, The Russell H. Morgan Department of Radiology and Radiological Science, The Johns Hopkins University School of Medicine, Baltimore, Maryland.
References
- 1.Baratti C, Barnett AS, Pierpaoli C. Comparative MR imaging study of brain maturation in kittens with T1, T2, and the trace of the diffusion tensor. Radiology. 1999;210:133. doi: 10.1148/radiology.210.1.r99ja09133. [DOI] [PubMed] [Google Scholar]
- 2.Barkovich AJ, Kjos BO, Jackson DE, Jr, et al. Normal maturation of the neonatal and infant brain: MR imaging at 1.5 T. Radiology. 1988;166:173. doi: 10.1148/radiology.166.1.3336675. [DOI] [PubMed] [Google Scholar]
- 3.Basser PJ, Mattiello J, LeBihan D. MR diffusion tensor spectroscopy and imaging. Biophys J. 1994;66:259. doi: 10.1016/S0006-3495(94)80775-1. [DOI] [PMC free article] [PubMed] [Google Scholar]
- 4.Bird CR, Hedberg M, Drayer BP, et al. MR assessment of myelination in infants and children: usefulness of marker sites. AJNR Am J Neuroradiol. 1989;10:731. [PMC free article] [PubMed] [Google Scholar]
- 5.Christophe C, Muller MF, Baleriaux D, et al. Mapping of normal brain maturation in infants on phase-sensitive inversion--recovery MR images. Neuroradiology. 1990;32:173. doi: 10.1007/BF00589106. [DOI] [PubMed] [Google Scholar]
- 6.De Vries LS, Groenendaal F, van Haastert IC, et al. Asymmetrical myelination of the posterior limb of the internal capsule in infants with periventricular haemorrhagic infarction: an early predictor of hemiplegia. Neuropediatrics. 1999;30:314. doi: 10.1055/s-2007-973511. [DOI] [PubMed] [Google Scholar]
- 7.Hack M, Fanaroff AA. Outcomes of children of extremely low birthweight and gestational age in the 1990’s. Early Hum Dev. 1999;53:193. doi: 10.1016/s0378-3782(98)00052-8. [DOI] [PubMed] [Google Scholar]
- 8.Hack M, Wilson-Costello D, Friedman H, et al. Neurodevelopment and predictors of outcomes of children with birth weights of less than 1000 g: 1992–1995. Arch Pediatr Adolesc Med. 2000;154:725. doi: 10.1001/archpedi.154.7.725. [DOI] [PubMed] [Google Scholar]
- 9.Hayakawa K, Kanda T, Hashimoto K, et al. MR imaging of spastic diplegia. The importance of corpus callosum. Acta Radiol. 1996;37:830. doi: 10.1177/02841851960373P279. [DOI] [PubMed] [Google Scholar]
- 10.Holland BA, Haas DK, Norman D, et al. MRI of normal brain maturation. AJNR Am J Neuroradiol. 1986;7:201. [PMC free article] [PubMed] [Google Scholar]
- 11.Hsu EW, Mori S. Analytical expressions for the NMR apparent diffusion coefficients in an anisotropic system and a simplified method for determining fiber orientation. Magn Reson Med. 1995;34:194. doi: 10.1002/mrm.1910340210. [DOI] [PubMed] [Google Scholar]
- 12.Huppi PS, Maier SE, Peled S, et al. Microstructural development of human newborn cerebral white matter assessed in vivo by diffusion tensor magnetic resonance imaging. Pediatr Res. 1998;44:584. doi: 10.1203/00006450-199810000-00019. [DOI] [PubMed] [Google Scholar]
- 13.Iida K, Takashima S, Ueda K. Immunohistochemical study of myelination and oligodendrocyte in infants with periventricular leukomalacia. Pediatr Neurol. 1995;13:296. doi: 10.1016/0887-8994(95)00192-1. [DOI] [PubMed] [Google Scholar]
- 14.Inder TE, Warfield SK, Wang H, et al. Abnormal cerebral structure is present at term in premature infants. Pediatrics. 2005;115:286. doi: 10.1542/peds.2004-0326. [DOI] [PubMed] [Google Scholar]
- 15.Kazemi K, Ghadimi S, Abrishami-Moghaddam H, et al. Neonatal probabilistic models for brain, CSF and skull using T1-MRI data: preliminary results. Conf Proc IEEE Eng Med Biol Soc. 2008;2008:3892. doi: 10.1109/IEMBS.2008.4650060. [DOI] [PubMed] [Google Scholar]
- 16.Kazemi K, Moghaddam HA, Grebe R, et al. A neonatal atlas template for spatial normalization of whole-brain magnetic resonance images of newborns: preliminary results. Neuroimage. 2007;37:463. doi: 10.1016/j.neuroimage.2007.05.004. [DOI] [PubMed] [Google Scholar]
- 17.Kinney HC, Brody BA, Kloman AS, et al. Sequence of central nervous system myelination in human infancy. II. Patterns of myelination in autopsied infants. J Neuropathol Exp Neurol. 1988;47:217. doi: 10.1097/00005072-198805000-00003. [DOI] [PubMed] [Google Scholar]
- 18.Landis JR, Koch GG. An application of hierarchical kappa-type statistics in the assessment of majority agreement among multiple observers. Biometrics. 1977;33:363. [PubMed] [Google Scholar]
- 19.McKinstry RC, Mathur A, Miller JH, et al. Radial organization of developing preterm human cerebral cortex revealed by non-invasive water diffusion anisotropy MRI. Cereb Cortex. 2002;12:1237. doi: 10.1093/cercor/12.12.1237. [DOI] [PubMed] [Google Scholar]
- 20.Miot-Noirault E, Barantin L, Akoka S, et al. T2 relaxation time as a marker of brain myelination: experimental MR study in two neonatal animal models. J Neurosci Methods. 1997;72:5. doi: 10.1016/s0165-0270(96)00148-3. [DOI] [PubMed] [Google Scholar]
- 21.Mori S, Itoh R, Zhang J, et al. Diffusion tensor imaging of the developing mouse brain. Magn Reson Med. 2001;46:18. doi: 10.1002/mrm.1155. [DOI] [PubMed] [Google Scholar]
- 22.Mori S, Oishi K, Jiang H, et al. Stereotaxic white matter atlas based on diffusion tensor imaging in an ICBM template. Neuroimage. 2008;40:570. doi: 10.1016/j.neuroimage.2007.12.035. [DOI] [PMC free article] [PubMed] [Google Scholar]
- 23.Mukherjee P, Miller JH, Shimony JS, et al. Diffusion-tensor MR imaging of gray and white matter development during normal human brain maturation. AJNR Am J Neuroradiol. 2002;23:1445. [PMC free article] [PubMed] [Google Scholar]
- 24.Neil JJ, Shiran SI, McKinstry RC, et al. Normal brain in human newborns: apparent diffusion coefficient and diffusion anisotropy measured by using diffusion tensor MR imaging. Radiology. 1998;209:57. doi: 10.1148/radiology.209.1.9769812. [DOI] [PubMed] [Google Scholar]
- 25.Oishi K, Faria A, Jiang H, et al. Atlas-based whole brain white matter analysis using large deformation diffeomorphic metric mapping: application to normal elderly and Alzheimer’s disease participantstlas. Neuroimage. 2009;46:486. doi: 10.1016/j.neuroimage.2009.01.002. [DOI] [PMC free article] [PubMed] [Google Scholar]
- 26.Oishi K, Konishi J, Mori S, et al. Reduced fractional anisotropy in early-stage cerebellar variant of multiple system atrophy. J Neuroimaging. 2009;19:127. doi: 10.1111/j.1552-6569.2008.00262.x. [DOI] [PubMed] [Google Scholar]
- 27.Oishi K, Mori S, Donohue P, et al. Multi-Contrast Human Neonatal Brain Atlas: Application to Normal Neonate Development Analysis. NeuroImage. 2011 doi: 10.1016/j.neuroimage.2011.01.051. [DOI] [PMC free article] [PubMed] [Google Scholar]
- 28.Oishi K, Zilles K, Amunts K, et al. Human brain white matter atlas: identification and assignment of common anatomical structures in superficial white matter. Neuroimage. 2008;43:447. doi: 10.1016/j.neuroimage.2008.07.009. [DOI] [PMC free article] [PubMed] [Google Scholar]
- 29.Ono J, Kodaka R, Imai K, et al. Evaluation of myelination by means of the T2 value on magnetic resonance imaging. Brain Dev. 1993;15:433. doi: 10.1016/0387-7604(93)90083-k. [DOI] [PubMed] [Google Scholar]
- 30.Perlman JM. Neurobehavioral deficits in premature graduates of intensive care--potential medical and neonatal environmental risk factors. Pediatrics. 2001;108:1339. doi: 10.1542/peds.108.6.1339. [DOI] [PubMed] [Google Scholar]
- 31.Pierpaoli C, Basser PJ. Toward a quantitative assessment of diffusion anisotropy. Magn Reson Med. 1996;36:893. doi: 10.1002/mrm.1910360612. [DOI] [PubMed] [Google Scholar]
- 32.Pierpaoli C, Jezzard P, Basser PJ, et al. Diffusion tensor MR imaging of the human brain. Radiology. 1996;201:637. doi: 10.1148/radiology.201.3.8939209. [DOI] [PubMed] [Google Scholar]
- 33.Roelants-van Rijn AM, Groenendaal F, Beek FJ, et al. Parenchymal brain injury in the preterm infant: comparison of cranial ultrasound, MRI and neurodevelopmental outcome. Neuropediatrics. 2001;32:80. doi: 10.1055/s-2001-13875. [DOI] [PubMed] [Google Scholar]
- 34.Shi F, Fan Y, Tang S, et al. Neonatal brain image segmentation in longitudinal MRI studies. Neuroimage. 2009 doi: 10.1016/j.neuroimage.2009.07.066. [DOI] [PMC free article] [PubMed] [Google Scholar]
- 35.Takeda K, Nomura Y, Sakuma H, et al. MR assessment of normal brain development in neonates and infants: comparative study of T1- and diffusion-weighted images. J Comput Assist Tomogr. 1997;21:1. doi: 10.1097/00004728-199701000-00001. [DOI] [PubMed] [Google Scholar]
- 36.Wiggins RC. Myelination: a critical stage in development. Neurotoxicology. 1986;7:103. [PubMed] [Google Scholar]
- 37.Woodward LJ, Anderson PJ, Austin NC, et al. Neonatal MRI to predict neurodevelopmental outcomes in preterm infants. N Engl J Med. 2006;355:685. doi: 10.1056/NEJMoa053792. [DOI] [PubMed] [Google Scholar]
- 38.Yakovlev PI, Lecours AR. Regional development of the brain in early life. Philadelphia, PA: F.A. Davis; 1967. [Google Scholar]


