Abstract
The most important factor in predicting the risk of injury or death in a frontal crash is the crash severity, which is expressed as the velocity change, or delta-V, experienced by the vehicle during the crash. The National Automotive Sampling System (NASS) is the largest database in the world linking injury outcomes with delta-Vs, which are obtained from field reconstructions. The accuracy of these reconstructions was assessed by analyzing 228 NASS cases involving single event frontal crashes in which the vehicle’s frontal delta-V was also measured directly by an onboard event data recorder (EDR). Compared to the EDR measurements, the delta-V values in NASS averaged 19% lower with a standard deviation of 8.6 kph. The effect of this error on injury and fatality risk calculations was investigated using NASS data from 1997 – 2006 for frontal crashes with a known delta-V. Injury and fatality risk functions were calculated by curve fitting the distributions of the delta-V values associated with injury and fatality incidence normalized by the fitted crash exposure distribution. Individual delta-V values were linearly scaled to correct for the bias error, and the delta-V distributions were corrected for scatter error using a numerical deconvolution technique. Correcting for delta-V bias error shifted the calculated risk curves to the right and correcting for delta-V scatter error shifted the curves back to the left, but to a lesser extent. The effects of occupant age, gender, and belt use on injury and fatality risk were substantial.
INTRODUCTION
The probability of injury or death in a crash is dependent on many factors, including the nature and severity of the crash, whether the occupant is wearing a seatbelt, and the injury tolerance of the occupant, which is related to age, size, and gender. However, crash severity expressed as the change in velocity, or delta-V, experienced by the vehicle during the collision phase of a crash explains nearly all of the variation in the injury outcome of field crashes [Malliaris et al., 1997]. The National Automotive Sampling System/Crashworthiness Data System (NASS-CDS) is uniquely well-suited to the task of calculating injury and fatality risk because it links injury outcomes with a variety of crash and occupant characteristics, including delta-V.
Delta-V data in NASS are obtained from field reconstructions using the WinSMASH software [Sharma et al., 2007]. A certain amount of error is inherent in field reconstructions, because collisions in the real world seldom match standard laboratory crash test configurations. Due to the recent introduction of significant numbers of event data recorders (EDRs) into the vehicle fleet, the magnitude of the errors in the NASS delta-V data can now be quantified. In an ongoing study in which EDR data have been retrieved from vehicles involved in NASS cases, it has been reported that the delta-V values in NASS underestimate the delta-V recorded by the EDR by an average of approximately 20%, with a significant amount of scatter [Gabler et al., 2004; Niehoff et al., 2006]. The objective of the present study was to formulate injury and fatality risk curves for frontal crashes that correct for these errors in the NASS delta-V data.
METHODS
EDR data from 228 vehicles that had been involved in crashes investigated in the NASS-CDS database between 2000 and 2005 were gathered as part of an ongoing study that has been described in detail by Gabler et al. (2004) and Niehoff et al. (2006). All EDR data came from General Motors vehicles. Because most current EDRs record only the frontal component of the crash pulse, cases were only considered if they involved a single event frontal crash with a principal direction of force (PDOF) between −30 and 30 degrees. 228 such cases were found in which the EDR successfully recorded the entire crash pulse.
The error in the NASS delta-V data was quantified by comparing the longitudinal delta-V calculated in 228 NASS cases to the longitudinal delta-V recorded by an EDR in the same vehicle. Differences between the two values were attributed to errors in the NASS delta-V data. Two aspects of the NASS delta-V error were quantified: bias error and scatter error. Both types of error were calculated using simple linear regression. The bias error was simply the slope of the regression line obtained by a least-squares fit of the NASS vs. EDR delta-V data. In accordance with the assumptions of linear regression, the scatter error was assumed to be homoscedastic with a normal distribution having a mean equal to the fit delta-V and a standard deviation given in the regression ANOVA table:
| (1) |
The assumption that the EDR data were perfectly accurate was evaluated by comparing the delta-V values obtained from an EDR and laboratory accelerometers in 34 frontal crash tests. The crash test data were taken from Niehoff et al. (2005). A similar linear regression analysis was performed on the crash test data. However, in the crash test data, the scatter error did not appear to remain constant across all delta-V levels, as it did in the NASS data. Rather, the scatter error appeared to increase in proportion to the delta-V. This heteroscedasticity was modeled by fitting a parabola through the squared residual errors of the original regression line:
| (2) |
where cv is the coefficient of variation (standard deviation divided by the mean) of the scatter error, and x is the delta-V.
Because bias error is systematic, it can be easily corrected by multiplying the delta-V values in NASS by the appropriate scaling factor. Scatter error, on the other hand, is random. It is impossible to correct individual delta-V values in NASS for scatter. However, it is possible to remove the effect of scatter error from distributions of delta-V estimates. The distribution of delta-V values in NASS reflects the sum of the true distribution of delta-Vs and the distribution of the scatter error. It can be shown mathematically that the distribution of the sum of two independent random variables is the convolution of each of their distributions. Therefore, the true distribution of crash severities occurring in the field can be obtained by deconvolving the scatter error from the reported distribution of delta-Vs:
| (3) |
where f′ is the distribution of delta-Vs reported in NASS, f is the true distribution of delta-Vs (as would be measured by EDRs), g is the distribution of scatter error, x is delta-V, and z is a dummy variable. As mentioned previously, the scatter error was assumed to have a normal distribution such that:
| (4) |
The basic idea behind the convolution integral is that the population of crashes reported in the NASS database at a particular delta-V actually encompasses a range of crash severities, some of which were actually less severe than the reported delta-V (but the reconstruction erred on the high side), and some of which were actually more severe than the reported delta-V (but the reconstruction erred on the low side).
The goal of this study was to evaluate how frontal crash injury and fatality risk curves would be affected by error in the NASS delta-V data, assuming the magnitude of bias and scatter error observed in the sample of 228 frontal crashes where EDR data were available. To that end, injury and fatality risk curves were calculated using NASS data from 1997 – 2006 in which the most harmful event was a frontal crash (PDOF between −30 and 30 degrees) with a known delta-V. Rollovers were excluded. Only front seat occupants of airbag-equipped vehicles (model year 1995 or later) who were over 18 years old and not ejected were studied. Various subsets of this population were studied to examine the effects of age, gender, belt use, and airbag deployment. Each NASS/CDS case was multiplied by the weighting factors provided in order to obtain national estimates and remove biases in the raw data.
Injury risk was calculated by dividing the number of injured occupants by the total number of exposed occupants at each delta-V level. Distributions of delta-Vs were modeled using the probability density function (pdf) and cumulative distribution function (cdf) of a standard Weibull distribution:
| (5) |
| (6) |
where α is the shape parameter, β is the scale parameter, and x is the delta-V in units of kilometers per hour (kph).
The weighted NASS delta-V data for all occupants were sorted and normalized to obtain the cdf of the crash severity exposure. The NASS exposure cdf was mathematically manipulated in several ways before curve fitting. First, the delta-V data were scaled to correct for the estimated bias error. Second, all delta-Vs below 30 kph in the bias-corrected data (24 kph in the original data) were excluded from the curve fit. Because NASS only includes tow-away and/or injury crashes, low-severity crashes are undersampled. The reported crash exposure in the NASS data appeared to follow a roughly exponential distribution at delta-Vs of approximately 30 kph and greater. At this level of crash severity, it is reasonable to expect that virtually all vehicles would have to be towed from the scene due to damage. The equation form for the Weibull distribution (eq. 6) was adjusted to obtain the pdf and cdf over the delta-V region of interest θ < x < ∞, where θ = 30 kph (eq. 7 and 8):
| (7) |
| (8) |
Third, the complement of the cdf of the NASS delta-V exposure data greater than 30 kph (cdfNASSexp) was log transformed in order to give greater weight to higher severity impacts.
The true distribution of the delta-V exposure (as would be measured by EDRs) was curve fit to the form of the adjusted Weibull distribution (eq. 7). This true distribution (f), when convolved with the distribution of scatter error in the NASS delta-V estimates (g) (eq. 4), yielded an estimate for the actual distribution of delta-V data in NASS (f′) (eq. 3). The convolution was performed over all delta-V values, even though the curve fitting only involved delta-Vs greater 30 mph. The α and β coefficients of the true delta-V exposure distribution (f) were estimated by fitting the log transform of the complement of the cdf of the true distribution convolved with error (F′expθ) to the log transform of the complement of cdf of the NASS delta-V exposure data (cdfNASSexp) at each delta-V increment i:
| (9) |
Because the cdf of the actual NASS exposure data was expressed in discrete 1 kph delta-V increments, a single data point could represent a small or large number of actual cases. The curve fit of equation (9) was therefore performed by minimizing the sum of the squared error at each delta-V increment (ɛι) weighted according to the calibrated sample size (nc) of the weighted NASS data in that increment. The calibrated sample size is used for data in which weighting factors have been applied to increase the sample size (Dorofeev and Grant, 2006), and is equal to or less than the raw sample size of the data, depending on the spread of the weighting factors:
| (10) |
where wi is the weighting factor for case i in NASS. A multiplier (nexp) was then applied to predict the true distribution of exposed occupants in absolute, rather than normalized, terms:
| (11) |
This multiplier was fit so that after equation (11) was convolved with the distribution of scatter error (eq. 3), the resulting estimate for the number of occupants exposed to delta-Vs greater than 30 kph matched the actual number of such occupants in NASS.
Next, a risk curve was optimized so that the predicted cumulative distribution of injuries or fatalities matched the actual distribution in NASS. The risk function was given the form of standard Weibull distribution (eq. 6) with coefficients αrisk and βrisk. The risk curve was multiplied by the estimated true exposure function (eq. 11) to obtain an estimate of the true injury incidence (finc):
| (12) |
Equation (12) was convolved with the estimated scatter error in the NASS delta-V estimates (eq. 3) and then integrated (but not log-transformed) to obtain the cumulative number of injured occupants expected to be in NASS as a function of delta-V (nexpF′inc). The coefficients of the risk function (αrisk and βrisk) were determined by fitting the predicted (nexpF′inc) against the actual (cdfNASS inc) cumulative number of injured occupants in NASS at each delta-V level. The curve fit was accomplished by minimizing the sum of the squared error at each delta-V increment weighted according to the calibrated sample size (nc) (eq. 10) of the NASS data in that increment, subject to the constraint that the total number of injured occupants predicted by the risk curve multiplied by the exposure curve had to match the total number of injured occupants in the NASS sample. This analysis was performed to develop risk curves for two groups of injured occupants: those sustaining AIS 3 or greater injury plus all fatalities (AIS 3+F) and those sustaining fatal injury (F). The effects of age, gender, belt use, and airbag deployment were analyzed using relevant subsets of the NASS data.
Injury and fatal injury risk was also calculated nonparametrically simply by dividing the number of injured occupants by the number of exposed occupants in various delta-V intervals using the uncorrected and bias-corrected delta-Vs in the weighted NASS data (scatter error cannot be corrected nonparametrically). Errors in the calculated proportions (p) were estimated:
| (13) |
where nc was the calibrated sample size (eq. 10). All error bars presented in this paper represent 95% confidence intervals calculated as ± 1.96σ.
RESULTS
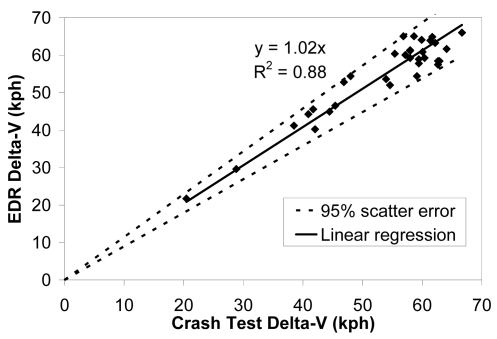
In the 34 crash tests reported by Niehoff et al. (2005), the delta-V recorded by the EDR was on average 2% ± 6% higher than the delta-V obtained from laboratory instrumentation (Fig. 1).
Figure 1.
EDR performance in crash tests.
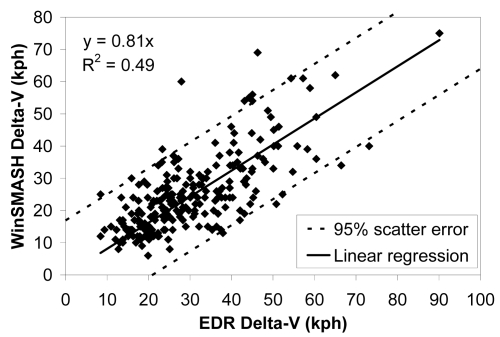
In the 228 NASS cases studied, the longitudinal delta-V estimates in NASS were on average 19% lower than the longitudinal delta-Vs recorded by the EDRs (Fig. 2). In addition, there was substantial scatter error (R2 = 0.49, σ = 8.6 kph). The scatter error appeared to be approximately equal at all delta-V levels.
Figure 2.
Comparison of longitudinal delta-V values from WinSMASH and the EDR in 228 NASS cases.
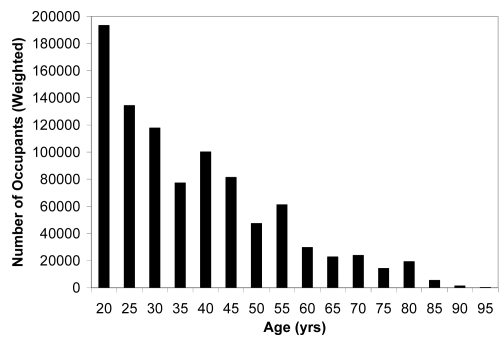
11,483 cases in the 1997 – 2006 NASS data met the criteria for this study (non-ejected front seat occupants over 18 years old in frontal crashes with a known delta-V and no rollover). After applying the weighting factors in the NASS database to each case, the total number of occupants represented nationwide by this sample was calculated to be 4,464,531. The overall weighted occupant sample was coded as mostly belted (89%), evenly split between males and females, and heavily skewed towards younger occupants (Fig. 3) and lower severity crashes.
Figure 3.
Distribution of ages in the NASS sample given as averages over a 5-yr span (±2 yrs of label).
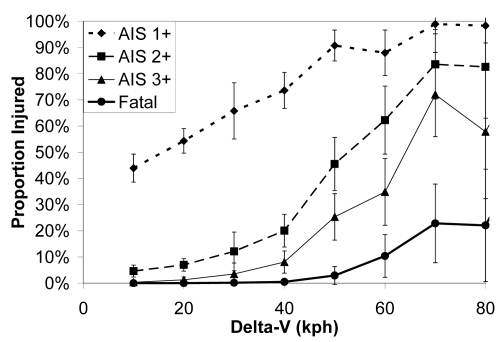
Initial estimates of injury and fatality risk were obtained nonparametrically by calculating the proportion of injured occupants in various delta-V intervals (Fig. 4). Even in low severity frontal crashes, it was common for occupants to sustain at least a minor injury (AIS 1+). At delta-V levels associated with FMVSS 208 compliance testing for frontal crashes (~ 50 kph), the risk of AIS 2+ injury was approximately 50%, the risk of AIS 3+ injury was approximately 25%, and the risk of fatality was approximately 5%.
Figure 4.
Comparison of risk curves based on uncorrected NASS data.
To correct the NASS data for bias error, the delta-V estimates were multiplied by 1.24, which was the reciprocal of the slope of linear regression line fit through the EDR vs. NASS delta-V data (Fig. 2). The standard deviation of the scatter error obtained from the linear regression of the EDR vs. NASS delta-V data was also multiplied by 1.24 to characterize the scatter error of the bias-corrected delta-V data. This yielded a standard deviation of 10.7 kph for the bias-corrected NASS delta-V data.
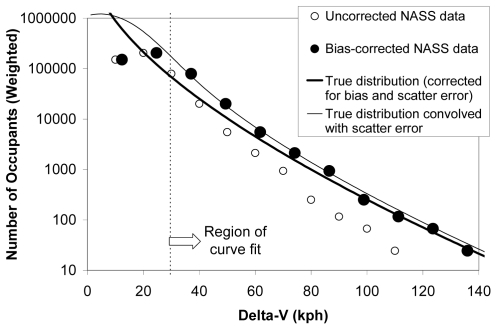
Correcting for the error in the NASS delta-V data had a profound effect on the estimated distribution of delta-Vs to which all occupants were exposed. The delta-V exposure in the NASS data was heavily skewed towards lower severity impacts. 95% of the cases in the uncorrected NASS sample involved delta-Vs of 38 kph or less, and only 0.5% of the cases involved delta-Vs of 60 kph or more. The distribution of delta-Vs was roughly exponential at delta-Vs above 24 kph, with the number of cases decreasing by a factor of approximately ten for every 20 – 25 kph increase in delta-V (Fig. 5). The bias-corrected delta-V data contained almost twice the number of cases with delta-Vs above 30 kph as the original NASS sample. The proportionate increase in cases was even higher at the higher delta-Vs.
Figure 5.
Distribution of delta-Vs in the NASS sample with corrections for bias and scatter error.
Correcting for scatter error, on the other hand, had the opposite effect on the exposure distribution. Because the delta-V exposure was so heavily skewed towards lower severity crashes, the effect of high end error in the lower severity crashes overwhelmed the effect of low end error in the higher severity crashes. The effect of scatter error, therefore, was to shift the exposure distribution towards higher delta-Vs. Correcting for scatter error shifted the exposure distribution towards lower delta-Vs. As expected, the estimated true distribution of delta-Vs, when convolved with the distribution of the scatter error, matched the bias-corrected NASS data extremely well (Fig. 5). The number of cases with delta-Vs above 30 kph in the estimated true distribution was half that of the bias-corrected NASS data and, surprisingly, was about equal to the number of such cases in the original uncorrected NASS data. However, the estimated true distribution of delta-Vs predicted that more occupants were exposed to higher delta-Vs than were reported in the original NASS data.
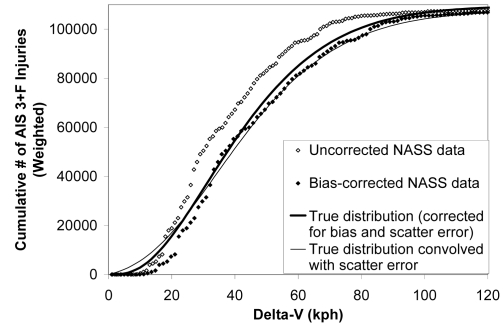
The effect of scatter error on the distribution of delta-Vs associated with injury or fatality incidence was quite minor. Although the effect of scatter error was to flatten out all distributions and make them more uniform, this effect was most pronounced in the highly skewed exposure distribution. Both the estimated true distribution of delta-Vs associated with AIS 3+F injury and the convolution of this distribution with the scatter error matched the bias-corrected NASS data very well (Fig. 6).
Figure 6.
Various distributions of delta-Vs associated with AIS 3+F injury.
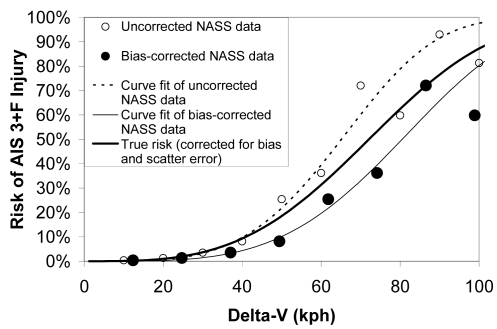
Risk curves obtained after correcting for bias and scatter error in the NASS delta-V data consistently fell between the risk curves derived from the original and the bias-corrected NASS data. In general, the risk curves derived from the original uncorrected NASS data were accurate at lower delta-Vs and somewhat conservative at higher delta-Vs (Fig. 7). However, the level of certainty in the risk curves decreased at higher delta-Vs as the data became increasingly sparse. At uncorrected delta-Vs above approximately 64 kph, the nonparametric risk estimates often became inconsistent and began to diverge from the parametric risk estimates substantially (>20% for AIS 3+F injury, >10% for fatal injury).
Figure 7.
Various distributions of delta-Vs associated with AIS 3+F injury.
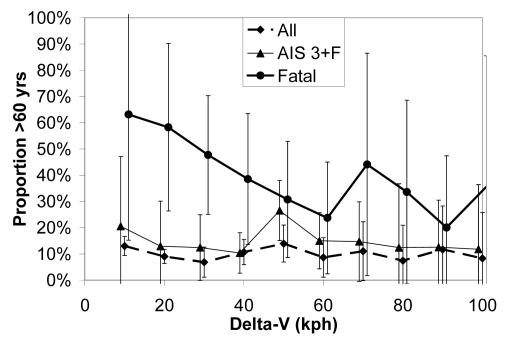
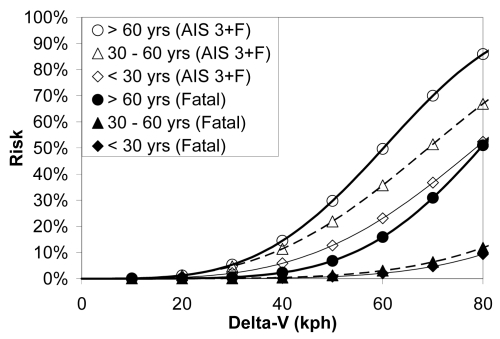
Although delta-V was far and away the best predictor of occupant injury and fatality, occupant age, gender, and belt use also proved to be important predictors. The effect of occupant age was especially significant for older occupants (> 60 yrs). Although older occupants made up only about 10% of the crash-involved population, they were more often injured and killed, especially in lower severity crashes (Figure 8). After correcting for delta-V bias and scatter errors, the estimated risk of AIS 3+F injury and fatality for older occupants was correspondingly higher than middle-aged (30 – 60 yrs) and younger (< 30 yrs) occupants (Figure 9). The effect of older age was even more pronounced for fatality risk than AIS 3+F injury risk.
Figure 8.
Proportion of occupants who were > 60 yrs old in the uncorrected weighted NASS data.
Figure 9.
Risk of AIS 3+F injury and fatality for various age groups based on corrected NASS data.
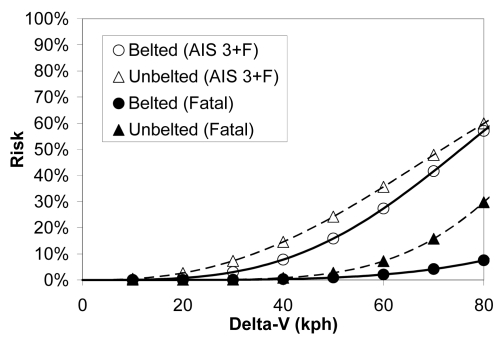
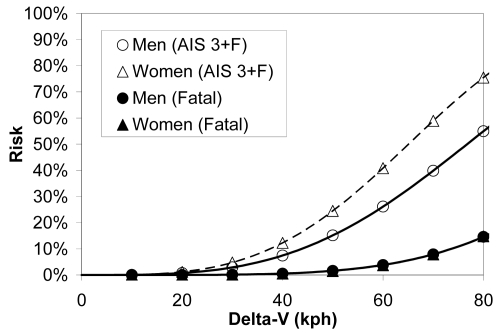
As expected, the risk of AIS 3+F injury and fatality was higher for unbelted occupants compared to belted occupants (Figure 10). Belt use appeared to reduce AIS 3+F injury risk most effectively in lower and moderate severity crashes, and reduce the risk of fatality most effectively in higher severity crashes. Gender appeared to influence the risk of AIS 3+F injury, but not the risk of fatality (Figure 11).
Figure 10.
Risk of AIS 3+F injury and fatality as a function of belt use based on corrected NASS data.
Figure 11.
Risk of AIS 3+F injury and fatality for men and women based on corrected NASS data.
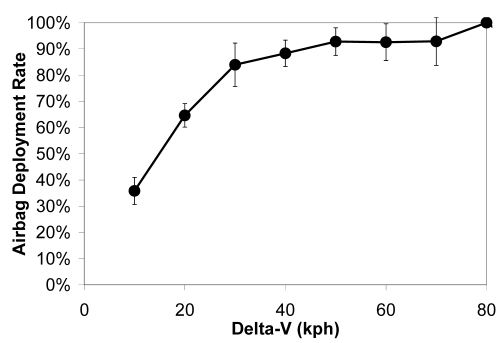
The effect of airbag deployment was investigated and deemed to be unimportant in this dataset, primarily because the vast majority of vehicles studied were equipped with an airbag (except for some earlier model vehicles that did not have an airbag on the passenger side). Although 40% of the weighted NASS sample involved cases without an airbag deployment, these nondeployments occurred primarily in lower severity crashes (Figure 12). In crashes with a delta-V of roughly 30 kph or greater, the airbag reportedly deployed approximately 90% of the time.
Figure 12.
Airbag deployment rate as a function of delta-V in the uncorrected weighted NASS data.
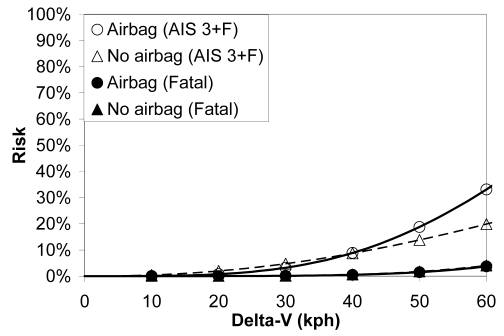
It was difficult to evaluate the effect of airbag deployment on injury and fatality risk because there were few crashes without an airbag deployment at the higher delta-V levels where airbags are most effective, and the data that did exist were inconsistent. After correcting for delta-V bias and scatter error, the risk of AIS 3+F injury was not greatly different in crashes with and without an airbag deployment, and the risk of fatality was also similar regardless of airbag deployment (Figure 13). Therefore, airbag deployment was not investigated as a separate injury predictor. The risk curves in the present study effectively assume that the airbag did deploy in higher severity crashes.
Figure 13.
Risk of AIS 3+F injury and fatality with and without airbag deployment based on corrected NASS data.
Additional analyses were conducted on subsets of the NASS sample encompassing all possible combinations of belt use, age (grouped into three intervals: < 30 yrs, 30 – 60 yrs, and > 60 yrs), and gender (Appendix). The results of the subgroup analyses showed the same general trends as the original analyses on the larger groups (Figs. 7, 9, 10, and 11). Two inconsistencies did emerge. First, the AIS 3+F injury data were inconsistent for unbelted middle-aged (30 – 60 yrs) occupants, resulting in risk curves that appeared too high at low delta-Vs and too low at high delta-Vs. Second, the fatality risk curves for unbelted females were lower than expected.
DISCUSSION
One of the great strengths of the NASS-CDS database is that, unlike the Fatality Analysis Reporting System (FARS) or state data compiled from police reports, it incorporates crash reconstruction information such as the delta-V and PDOF. Although the National Highway Traffic Safety Administration (NHTSA) is continually trying to improve their WinSMASH algorithm [Sharma et al., 2007], some amount of error is inevitable in crash reconstruction. Recently acquired EDR data provide a novel way of evaluating the accuracy of the delta-V data in the NASS database. The delta-V recorded by an EDR was shown to match the delta-V measured by laboratory instrumentation in crash tests with an error of only 2% ± 6% based on data reported by Niehoff et al. (2005). Given that vehicle center of gravity acceleration recorded in crash tests is itself subject to some error, this level of agreement between the two measurement systems demonstrates excellent accuracy in the EDR data. Currently, most EDRs record only the longitudinal component of delta-V, and are therefore only useful in assessing delta-V accuracy in frontal crashes.
In the 228 NASS cases studied, the longitudinal delta-V estimates using WinSMASH were on average 19% lower than the delta-Vs recorded by the EDR. In addition, the scatter error was substantial (σ = 8.6 kph). The WinSMASH error was similar for cars, SUVs, and vans. Niehoff et al. (2006) found that WinSMASH delta-V estimates were more accurate for pickups. However, we did not feel the evidence was strong enough to justify separating out pickups from other vehicle types, so all types of vehicles were lumped together in the current analysis.
The risk curves for the overall dataset are in agreement with other recent studies [Augenstein et al., 2003], but are lower than comparable curves from earlier studies [Evans, 1993; Malliaris et al., 1997], probably because the more recent data reflect much higher levels of belt use and airbag protection. The present study is unique in accounting for errors in the NASS delta-V data. The specific mathematical techniques used in the present study were first applied to estimate the risk of concussion in football players as a function of head acceleration measured by helmet-mounted accelerometers [Funk et al., 2007]. However, the effect of random delta-V errors on the distribution of crashes, injuries, and risk had been previously explored by Kullgren and Lie (1998). By introducing random errors into an idealized data set, they demonstrated that estimates of injury risk derived from erroneous field data could substantially underestimate the true risk of injury at a particular delta-V. The present study confirms that hypothesis, provides additional mathematical development of the theory, and applies the theory to real world data.
The bias and scatter error in the NASS delta-V estimates had the most significant effect on the calculated distribution of delta-Vs defining the exposure of crash-involved occupants. Because the exposure distribution was so heavily skewed towards lower delta-Vs, shifting the distribution to the right 24% to correct for the bias error caused the exposure at any particular delta-V to rise by several hundred percent. On the other hand, the scatter error in the delta-V estimates also tended to shift the exposure distribution to the right, again because the exposure distribution was so heavily skewed towards lower delta-Vs. After correcting the delta-V data for bias, the high end scatter error from the lower delta-Vs dominated the low end scatter error from the higher delta-Vs. Therefore, correcting for scatter error caused the exposure curve to shift back to the left.
The effect of random scatter error on the distributions of delta-Vs associated with the incidence of injury or fatality was relatively minor, because the incidence distributions were not as heavily skewed as the exposure distributions. The theory predicts that incidences of injury and fatality at very low delta-Vs are more likely to be cases where the delta-V is underestimated. A review of the ten lowest delta-V fatality cases revealed two severe vertical impacts not accounted for in the frontal delta-V estimates, three cases where the investigator noted that the delta-V appeared low, and two apparent heart attacks preceding the crash, all of which lends anecdotal support to the theory. Nevertheless, most of the effect of delta-V error on the calculated risk curves was due to the effect of the error on the exposure distributions, rather than incidence distributions. It was indeed serendipitous that the two aspects of the delta-V error (bias and scatter) offset each other to some extent. As a result, the influence of rather substantial bias and scatter errors in the NASS delta-V data on the calculated injury and fatality risk curves was not as large as expected.
Although the technique used in the present study to correct for delta-V error in NASS yielded interesting and fruitful results, it created some difficulties in analyzing covariates. The addition of random error to a data set intrinsically causes some information to be irretrievably lost. As a result, the technique presented here only allowed random error to be corrected in a distribution of delta-Vs, not in individual cases. Individual cases could conceivably be corrected for scatter error by reassigning a delta-V value to each case from the corrected distribution by matching its percentile value from the original distribution. That approach would create a corrected dataset that could be analyzed using conventional statistical techniques such as logistic regression. However, the approach that was chosen in this study was to analyze subgroups of the dataset separately to look at various combinations of covariates, which had to be treated as discrete, rather than continuous, variables (Appendix). This approach neither fit nor forced any interrelationships among the various covariates of delta-V, belt use, age, and gender.
The present analysis was parametric, which had certain advantages and limitations. For example, the Weibull form chosen for this study is simple (only two parameters), passes through the origin, has good shape flexibility, and forces the calculated risk function to assume a monotonically increasing form. However, it cannot match large inflections and inconsistencies in the NASS data that sometimes occur due to small sample sizes and uneven weighting factors. For that reason, it is always valuable to compare risk curve fits and nonparametric risk estimates to determine when the data have become too sparse to be reliable. In spite of having a dataset encompassing ten years worth of NASS data, many of the nonparametric risk estimates appear to become consistent at delta-Vs above 64 kph (Figs. 4 and 7). The problem was more pronounced for risk curves derived from smaller subsets of the data, usually involving older or unbelted occupants.
Lastly, the error-correction technique presented here was limited by imperfect modeling of the NASS delta-V error. The assumption that the scatter error in the WinSMASH delta-V estimates had a standard deviation of 8.6 kph across the board at all delta-V levels appeared to be the best model for the empirical data (Fig. 2). However, for low severity crashes, this assumption predicted that reconstructions could yield negative delta-V values, which would never actually happen. Fortunately, the error caused by this modeling assumption was negligible, because the curve fit of the exposure distribution only involved higher delta-Vs (> 30 kph), and the injury and fatality incidence distributions contained very few cases at low delta-Vs (< 15 kph).
Researchers should be aware of the fact that the delta-V values for frontal crashes in the NASS database contain substantial errors that have a particularly strong affect on the estimated distribution of delta-Vs to which crash-involved occupants are exposed. Correcting for bias error in the delta-V estimates is simple, but yields risk curves that underestimate the true risk of injury or fatality. Correcting for scatter error in the delta-V estimates can be accomplished as described here, but the technique involves fairly cumbersome mathematics and makes the analysis of covariates more difficult. If no correction for delta-V error is made, then calculated risk curves are likely to be somewhat conservative, particularly at higher delta-Vs.
CONCLUSION
Recently acquired EDR data from NASS cases suggests that the delta-V data in NASS that are used as a basis for government policy decisions and industry practices contain substantial errors. In this study, delta-V data in individual NASS cases were corrected for bias error, and distributions of delta-V data were corrected for scatter error using a novel numerical deconvolution method. Injury and fatality risk curves for frontal crashes were calculated as a function of age, gender, and belt use using the raw and corrected NASS delta-V data to demonstrate the magnitude of the error. Fortuitously, the effect of the bias error and the effect of the scatter error in the NASS delta-V data were offsetting. In spite of the substantial errors in the delta-V estimates in NASS, risk curves calculated using uncorrected NASS data were generally accurate at low delta-Vs and somewhat conservative at higher delta-Vs.
APPENDIX
Table 1.
Data for all risk curve calculations of NASS delta-V data corrected for bias and scatter error. The ID Code describes the subsample of the 1997 – 2006 NASS dataset. The first character indicates belt status (B = belted, U = unbelted, A = all), the second character indicates age group (Y = < 30 yrs, M = 30 – 60 yrs, O = > 60 yrs, A = all), and the third character indicates gender (M = male, F = female, A = all). Both raw (R) and weighted (W) sample sizes are given. α and β coefficients are for a Weibull distribution (eq. 11 for the exposure distribution and eq. 6 for the risk function) where x is delta-V in units of kilometers per hour.
| ID Code | All Occupants | AIS 3+F | Fatal | ||||||||||
|---|---|---|---|---|---|---|---|---|---|---|---|---|---|
| Sample size | Exposure | Sample size | Risk | Sample size | Risk | ||||||||
| R | W | α | β | nexp | R | W | α | β | R | W | α | β | |
| AAA | 11483 | 4646531 | 0.66 | 3.35 | 760379 | 1289 | 107722 | 3.33 | 80.5 | 240 | 10601 | 4.89 | 117 |
| BAA | 9397 | 4085206 | 0.60 | 2.15 | 549439 | 805 | 67357 | 3.38 | 84.1 | 118 | 4337 | 4.54 | 140 |
| UAA | 1962 | 506307 | 1.17 | 18.2 | 194344 | 465 | 39030 | 2.54 | 82.9 | 114 | 5434 | 5.39 | 97.0 |
| AYA | 4449 | 1836122 | 0.81 | 6.70 | 379996 | 410 | 33689 | 3.61 | 86.9 | 65 | 2903 | 5.38 | 123 |
| AMA | 5596 | 2341731 | 0.57 | 1.75 | 319070 | 631 | 58104 | 3.19 | 77.5 | 95 | 3821 | 4.85 | 123 |
| AOA | 1438 | 468678 | 0.92 | 9.91 | 82617 | 248 | 15929 | 3.64 | 66.5 | 80 | 3877 | 4.92 | 85.7 |
| AAM | 5913 | 2283623 | 0.74 | 5.31 | 461638 | 653 | 52576 | 3.36 | 85.6 | 150 | 6759 | 4.83 | 117 |
| AAF | 5560 | 2358444 | 0.60 | 2.05 | 298965 | 635 | 55121 | 3.42 | 72.4 | 90 | 3841 | 5.04 | 115 |
| BYA | 3440 | 1569771 | 0.71 | 4.19 | 260713 | 222 | 21688 | 3.42 | 93.4 | 15 | 659 | 4.80 | 171 |
| BMA | 4702 | 2077813 | 0.51 | 0.90 | 230624 | 401 | 34782 | 3.31 | 81.2 | 48 | 1756 | 4.97 | 134 |
| BOA | 1255 | 437622 | 1.19 | 14.4 | 73223 | 182 | 10887 | 3.93 | 66.6 | 55 | 1921 | 5.48 | 85.3 |
| BAM | 4617 | 1971408 | 0.66 | 3.35 | 315950 | 360 | 26986 | 3.61 | 89.3 | 65 | 2706 | 4.82 | 132 |
| BAF | 4773 | 2110354 | 0.57 | 1.49 | 233087 | 445 | 40371 | 3.43 | 74.3 | 53 | 1631 | 4.17 | 154 |
| UYA | 968 | 259442 | 1.09 | 15.5 | 102056 | 180 | 11643 | 3.61 | 80.6 | 46 | 1975 | 5.62 | 102 |
| UMA | 823 | 218466 | 1.46 | 25.3 | 79424 | 220 | 22427 | 1.62 | 99.1 | 43 | 1504 | 4.96 | 108 |
| UOA | 171 | 28399 | 0.92 | 14.9 | 14358 | 65 | 4960 | 3.19 | 59.8 | 25 | 1956 | 3.92 | 80.8 |
| UAM | 1219 | 301363 | 1.18 | 18.5 | 137005 | 283 | 24592 | 2.47 | 88.9 | 79 | 3253 | 4.57 | 109 |
| UAF | 742 | 204933 | 1.05 | 15.7 | 55727 | 182 | 14438 | 2.69 | 71.8 | 35 | 2181 | 6.91 | 84.9 |
| AYM | 2408 | 921923 | 0.86 | 8.71 | 230211 | 227 | 16675 | 4.53 | 81.9 | 45 | 2131 | 4.93 | 130 |
| AYF | 2039 | 911315 | 0.78 | 5.16 | 141984 | 183 | 17014 | 3.21 | 86.1 | 20 | 772 | 6.36 | 111 |
| AMM | 2798 | 1145857 | 0.66 | 3.27 | 191359 | 319 | 29495 | 2.97 | 86.6 | 70 | 2962 | 5.32 | 108 |
| AMF | 2791 | 1194305 | 0.50 | 0.86 | 129543 | 311 | 28584 | 3.50 | 68.1 | 25 | 859 | 4.20 | 161 |
| AOM | 707 | 215843 | 1.06 | 12.2 | 46166 | 107 | 6406 | 3.96 | 68.8 | 35 | 1667 | 4.88 | 87.4 |
| AOF | 730 | 252824 | 0.80 | 7.57 | 36439 | 141 | 9523 | 3.39 | 63.4 | 45 | 2210 | 4.90 | 84.6 |
| BYM | 1757 | 761200 | 0.72 | 4.99 | 140792 | 102 | 7970 | 4.61 | 87.0 | 9 | 412 | 4.42 | 187 |
| BYF | 1681 | 805687 | 0.75 | 4.33 | 117665 | 120 | 13718 | 3.26 | 86.1 | 6 | 247 | 5.07 | 157 |
| BMM | 4702 | 2077813 | 0.51 | 0.90 | 230624 | 401 | 34782 | 3.31 | 81.2 | 48 | 1756 | 4.97 | 134 |
| BMF | 2439 | 1066263 | 0.45 | 0.45 | 98311 | 220 | 20815 | 3.49 | 69.8 | 17 | 602 | 4.13 | 168 |
| BOM | 602 | 199218 | 1.14 | 13.5 | 40739 | 77 | 5049 | 4.17 | 68.3 | 25 | 1140 | 6.60 | 78.3 |
| BOF | 653 | 238404 | 1.25 | 15.4 | 32267 | 105 | 5838 | 3.70 | 64.38 | 30 | 782 | 4.43 | 98.6 |
| UYM | 629 | 157290 | 1.08 | 15.6 | 79390 | 122 | 8440 | 4.13 | 77.41 | 34 | 1479 | 4.78 | 113 |
| UYF | 339 | 102152 | 1.19 | 16.3 | 22779 | 58 | 3204 | 2.40 | 102 | 12 | 495 | 12.5 | 75.3 |
| UMM | 493 | 129448 | 1.37 | 23.0 | 49856 | 131 | 14796 | 1.46 | 112 | 35 | 1246 | 4.86 | 103 |
| UMF | 330 | 89018 | 1.43 | 24.2 | 27575 | 89 | 7631 | 2.28 | 74.5 | 8 | 257 | 4.70 | 130 |
| UOM | 97 | 14626 | 0.80 | 8.15 | 5924 | 30 | 1357 | 2.84 | 75.2 | 10 | 528 | 2.17 | 154 |
| UOF | 73 | 13763 | 1.07 | 24.7 | 8081 | 35 | 3603 | 2.64 | 57.6 | 15 | 1428 | 5.55 | 73.5 |
REFERENCES
- Augenstein J, Perdeck E, Stratton J, et al. Characteristics of Crashes that Increase the Risk of Serious Injuries. 47th Annual Proceedings Association for the Advancement of Automotive Medicine; 2003. pp. 561–576. [PMC free article] [PubMed] [Google Scholar]
- Dorofeev S, Grant P. Statistics for Real-Life Sample Surveys. Cambridge University Press; 2006. [Google Scholar]
- Evans L. Driver Injury and Fatality Risk in Two-Car Crashes versus Mass Ratioo Inferred Using Newtonian Mechanics. 37th Annual Proceedings Association for the Advancement of Automotive Medicine; 1993. pp. 313–327. [DOI] [PubMed] [Google Scholar]
- Funk JR, Duma SM, Manoogian SJ, et al. Biomechanical Risk Estimates for Mild Traumatic Brain Injury. 51st Annual Proceedings Association for the Advancement of Automotive Medicine; 2007. pp. 343–361. [PMC free article] [PubMed] [Google Scholar]
- Gabler HC, Hampton C, Hinch J, et al. Crash Severity: A Comparison of Event Data Recorder Measurements with Accident Reconstruction Estimates. Society of Automotive Engineers, Paper 2004-01-1194, 2004. [Google Scholar]
- Kullgren R, Lie A. Vehicle Collision Accident Data – Validity and Reliability. J Traffic Med. 1998;26(3–4):77–89. [Google Scholar]
- Malliaris AC, Digges KH, DeBlois JH. Relationships Between Crash Casualties and Crash Attributes. Society of Automotive Engineers. Paper 970393; 1997. [Google Scholar]
- Niehoff P, Gabler HC, Brophy J, et al. Evaluation of Event Data Recorders in Full Systems Crash Tests. 19th International Technical Conference on the Enhanced Safety of Vehicles, Paper 05–0271; 2005. p. 13. [Google Scholar]
- Niehoff P, Gabler HC. The Accuracy of WinSMASH Delta-V Estimates: The Influence of Vehicle Type, Stiffness, and Impact Mode. 50th Annual Proceedings Association for the Advancement of Automotive Medicine; 2006. pp. 73–89. [PMC free article] [PubMed] [Google Scholar]
- Sharma D, Stern S, Brophy J, et al. An Overview of NHTSA’s Crash Reconstruction Software WinSMASH. 20th International Technical Conference on the Enhanced Safety of Vehicles, Paper 07–0211; 2007. p. 13. [Google Scholar]


