Abstract
This study specifically investigated a range of vehicle-related factors that are associated with a lower risk of serious or fatal injury to a belted driver in a head-on collision. This analysis investigated a range of structural characteristics, quantities that describes the physical features of a passenger vehicle, e.g., stiffness or frontal geometry. The study used a data-mining approach (classification tree algorithm) to find the most significant relationships between injury outcome and the structural variables. The algorithm was applied to 120,000 real-world, head-on collisions, from the National Highway Traffic Safety Administration’s (NHTSA’s) State Crash data files, that were linked to structural attributes derived from frontal crash tests performed as part of the USA New Car Assessment Program. As with previous literature, the analysis found that the heavier vehicles were correlated with lower injury risk to their drivers. This analysis also found a new and significant correlation between the vehicle’s stiffness and injury risk. When an airbag deployed, the vehicle’s stiffness has the most statistically significant correlation with injury risk. These results suggest that in severe collisions, lower intrusion in the occupant cabin associated with higher stiffness is at least as important to occupant protection as vehicle weight for self-protection of the occupant. Consequently, the safety community might better improve self-protection by a renewed focus on increasing vehicle stiffness in order to improve crashworthiness in head-on collisions.
INTRODUCTION
A range of vehicle structural attributes have been identified as possibly correlated with a lower risk of serious or fatal injury in crashes. This study analyzes these possible relationships through the correlation of a large number of real-world, head-on collisions, from NHTSA’s State Crash data files, with structural attributes derived from frontal crash tests performed in the USA New Car Assessment Program (NCAP).
This study specifically investigated the likelihood of serious or fatal injury to a belted driver in a head-on collision. The analysis examined a wide range of possible explanatory, structural characteristics, including Average Height of Force (Digges and Eigen, 2000); Initial Stiffness; relative and absolute measures of total crush, crush in the engine compartment, crush in the occupant compartment, the Kw400 Crush-Work Stiffness metric (Mohan and Smith, 2007); vehicle body type; and vehicle weight.
This analysis extends previous research that compared two groups of vehicles or two groups of restraint systems. Kahane, for example, compared NCAP test results with fatality risk in real-world crashes recorded in the FARS database (1994). He related the fatality risk with laboratory impact responses of two groups of vehicles.
FARS does not generally describe the physical characteristics of vehicles. Kahane linked crash records to fundamental impact responses from the NCAP frontal tests, including HIC, femur force, and chest acceleration of the dummy occupants. Kahane then used a logistic regression model to analyze the linked data set. The dependent variable in the model was the probability of fatality for the driver. The analysis used two categories of independent variables: driver and crash characteristics (e.g. vehicle weight, driver age, and driver gender) and NCAP laboratory measurements.
Later, Austin examined five years of police-reported crashes from seven states in the State Data System (2005). The state files give information on both drivers in a head-on collision, including injury severity, age, and gender in their records. State data files have little engineering information, but they have a large number of crash observations. Austin investigated the aggressivity of a vehicle, i.e. the extent to which a vehicle (striking vehicle) hits another vehicle (struck vehicle) and increases the fatality risk in the struck vehicle.
As in the earlier Kahane study, the Austin paper used the NCAP laboratory tests to obtain structural attributes of passenger vehicles. Searching through the state crash files, Austin selected head-on crashes and side collisions that involved two of the vehicles for which he had structural attributes. While adjusting for confounding variables such as vehicle weight, driver age, and driver gender, Austin used logistic regression to study the effect of structural attributes on the fatality risk of the driver in the struck vehicle.
A number of international studies rate the safety performance of passenger vehicles by analyzing the risk to the drivers of the vehicles in real-world crash data reported by police or insurance claims. A recent study by Newstead et al. (2007) reviewed many past studies and rated vehicles by an index based on 3.2 million drivers in tow-away crashes in Australia. Using logistic regression, Newstead investigated a safety index that rates the relative performance of vehicles in self protection and protection of the other road user. The index was used to identify vehicles that had inferior or superior safety characteristics. The study also suggested that optimizing for self protection might lead to faster and greater gains than optimizing on vehicle-to-vehicle compatibility.
In this study, the authors link the State Crash data files with the NCAP data files. The study uses a data-mining approach (classification tree algorithm) to find the most significant relationships based on 120,000 crash observations between injury outcome in real-world crashes and the structural characteristics from the laboratory crash tests.
DATA
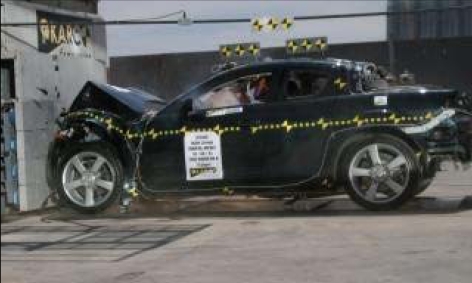
The first set of data is derived from NCAP tests, which measure the dynamic crash performance of passenger vehicles in frontal collisions into a rigid wall (see Figure 1). The tests measure the forces transmitted into a rigid barrier, the longitudinal acceleration in the rear-seat area, and the static and dynamic crush of the vehicle (NHTSA 2001).
Figure 1.
NCAP Crash Test into a Rigid Wall Barrier
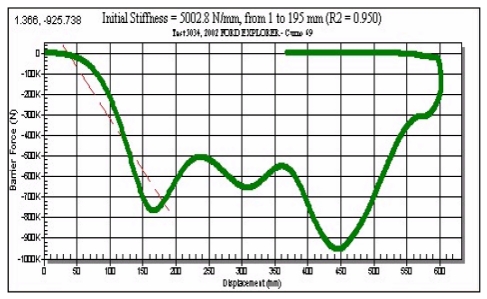
Structural attributes, including stiffness, occupant compartment crush, and so on, can be calculated from the NCAP data files. For example, the initial stiffness is defined as the initial slope of the force-versus-crush curve of the barrier crash, shown as a dashed line in Figure 2.
Figure 2.
Initial Stiffness Derived from NCAP Crash Test
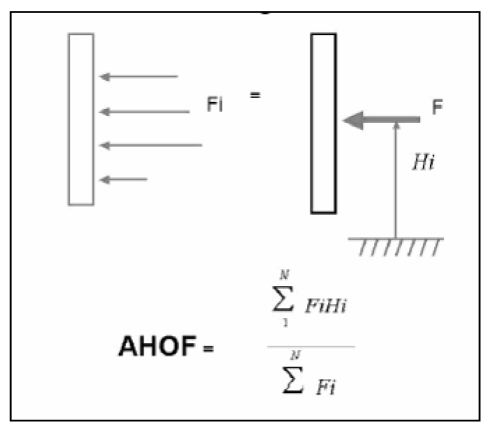
Another example is the Average Height of Force (AHOF), shown in Figure 3. The forces at a given height about the ground are multiplied by the height, and the products are summed. AHOF is defined as that sum divided by the sum of all the forces measured at the wall.
Figure 3.
AHOF Derived from NCAP Data Set
The second data set was derived from real-world crash data, collected by a number of states within the USA to provide basic information for a large number of crashes. Each state maintains a database that contains broad information about people, vehicles, and conditions written down in Police Accident Reports (PAR’s). Each state has different requirements for collection and reporting of crash data. Beginning in about 1980, NHTSA began collecting crash information based on information based on PAR’s. Currently, the NHTSA obtains data from twenty-nine states and compiles it into the State Data System. Most states use the KABCO injury severity code (K is killed and A is incapacitating injury while other injury categories are not severe). A measure of crash severity, such as Δv, is not available in the State Data System.
This study uses state crash data from Florida for 1992 to 2004, Illinois for 1990 to 2003, Maryland for 1989–2001, Ohio for 1990 to 1999, and Pennsylvania for 1997 to 2001 and 2003 to 2004.
METHODS
The analysis of the real-world head-on collisions consisted of the following stages:
Extraction of Vehicle-Specific Structural Variables from NCAP Frontal Tests
Association of State Accident Data with NCAP Frontal Test Data
Application of the Data Mining/Classification Tree Algorithm
Extraction of Vehicle-Specific Structural Variables from NCAP Frontal Tests
A wide variety of structural attributes were extracted from the 1991–2006 NCAP frontal test data using NHTSA’s Load Cell Analysis software package. NCAP tests results were excluded from this analysis if the Load Cell Analysis program reported suspicious or faulty sensor data, unless there were no valid test results available for a given vehicle model from a different year. Eliminating the tests with questionable data resulted in 567 tests that were included in this study.
These structural attributes include:
Average Height of Force (AHOF)
Initial Stiffness
Absolute and relative measures of crush, including
Total crush from front to back bumper
Crush from the front bumper to the firewall
Crush from the firewall to the back bumper
Crush from the steering wheel to the back bumper
Maximum crush distance
Vehicle body type (LTV versus passenger vehicle)
Vehicle weight
Crush-work stiffness 200, 300, and 400, measures of the work required to crush 200, 300, and 400 mm, respectively, of a vehicle’s front end.
Association of State Crash Data with NCAP Frontal Test Data
The state crash data and NASS CDS data were linked to the NCAP test data using the vehicle VINs reported in both data sets. While a number of USA State Crash Data files were available, this analysis was limited to those states for which the VIN was recorded.
The matching algorithm first attempts to link the real world crash data to NCAP data based only on the VIN. The algorithm first attempts to match based on the following characters in the VIN field:
Char 1: Country of Manufacture
Char 2: Manufacturer
Char 3: Manufacturing Division
Chars 4–8: Vehicle Features, e.g. body style, engine type, model, series, etc.
If no match was found then, the algorithm would attempt to match by excluding the Country of Manufacture field. If multiple matches are found, the algorithm uses the latest NCAP test with a model year that is less than or equal to the model year of the crash vehicle. If there are no NCAP tests with earlier model years, then the algorithm selects the NCAP test closest to the model year of the vehicle in the collision.
If the algorithm is unable to find a match based on the VIN field, it then attempts to match using the vehicle make and model as reported by the Insurance Institute of Highway Safety (IIHS) Vindicator program (HLDI, 2005). If this is unsuccessful, the authors then attempted to match using the crash observation with a vehicle sister or clone in the test data.
The IIHS Vindicator program is a command line utility that takes as input a 16 digit VIN, and produces output including the vehicle make and model. The matching program uses Vindicator in an automated process to extract the makes and models of vehicles in the NCAP tests and the State crash data. Then, this information is used to create a match based on make and model between these two datasets.
To make as many matches as possible between the two datasets, the algorithm uses a list of vehicle sisters and clones (Anderson, 2007). Vehicle sisters and clones are vehicles that are based on the same platform, e.g. the Chevrolet Celebrity 4-door and the Buick Century 4-door.
For this analysis, the following selection criteria were used to select observations from the merged data file:
Head-on collisions involving 2 vehicles;
Driver reported to be belted;
Structural parameters were known for the vehicle (i.e. the state crash record could be linked to a valid NCAP frontal test);
One of the vehicles was towed or disabled, or the driver was seriously/fatally injured (in order to eliminate minor property-damage-only crashes from the dataset).
The State Crash data set included crashes where at least one vehicle was towed (which would include both groups of injury outcome: (1) fatalities/severe injuries and (2) moderate/light/no injuries) or crashes in which the driver was seriously/fatally injured (which would include only serious/fatal injuries). The first set of crash observations make up the bulk of the observations. There were very few observations in the second set that are not also in the first. In order not to lose any information about crashes with negative outcomes, the analysis included these records that appeared in only the second set.
The effects of using a tow away threshold for crash analysis have been studied (HSIS, 1998). It turns out that, to combat reduction in funding, many state agencies no longer report property-damage-only (PDO) crashes. If some state agencies report PDO and some state agencies do not, researchers can not analyze the state data in the aggregate. A benefit of increasing the analysis threshold to tow-away crashes is a much greater consistency of crash rates among individual states, i.e., if the states have the same crash rates at the tow away threshold, then it may be possible to analyze all the combined state data set.
Execution of the Classification Tree Algorithm
The analysis of the linked data set was done by applying a data mining techniques, called decision tree classification. The decision tree used in this study was generated by the TreeDisc algorithm-(SAS Institute, 1995). Given the large set of collision observations that were gathered, this classification algorithm enables an automated search for the most important structural characteristics.
The approach has the following attributes:
It uses an automated process to select the most statistically important structural variables: the data mining algorithm begins by building Chi-Square contingency tables that measure the correlation between the injury risk dependent variable and each and every one of the dependent variables,
It automates the search for the values of these structural characteristics that produce the most significant outcome for the driver: the independent variable with the highest correlation to injury risk is selected, and the data set is then partitioned based on the values of that independent variable,
It does not assume that all structural variables are equally important for all vehicle types: adjacent categories with statistically indistinguishable injury risk are merged into a combined grouping, and
It offers an advantage over Logistic Regression in that it does not manually (or subjectively) determine which of the independent variables must be used by the model.
The recursion in the algorithm terminates under one of two conditions. It will terminate if the minimum number of observations in a leaf node falls below a predetermined threshold or if the optimally merged predictor for the next level falls below a p-value of 0.1.
Value ranges for each of the independent structural characteristics were established. These ranges were established by grouping vehicles into one of five quintiles based on each structural attribute. In other words, vehicles with values for a given variable less than or equal to the 20th percentile in the crash records, vehicles with values for a given variable that were greater than the 20th percentile but less than or equal to the 40th percentile, etc. In addition to these structural variables, the classification algorithm input included the vehicle body type (LTV versus car) and whether or not an airbag deployed.
RESULTS
The classification tree algorithm was applied to 120,000 severe cases, in which both the vehicle structural parameters of a vehicle and the outcome to its driver were known. The minimum number of observations for a node to be expanded was 13,000, and the maximum number of levels was four.
A number of potential independent variables yielded insignificant or inconsistent results, and were excluded from this analysis. These variables included the vehicle body type, relative and absolute measures of crush, and the Kw200 and Kw300 crush-work stiffness.
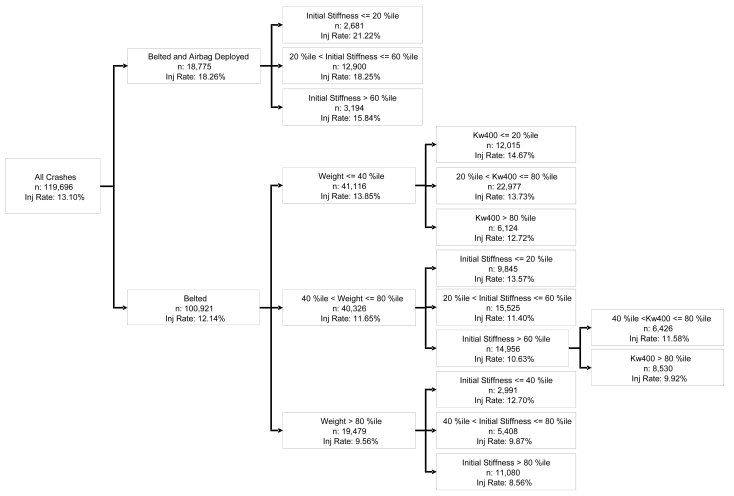
As shown in Figure 4, the classification tree for vehicle self-protection first divided the cases by whether an airbag was present and deployed. When an airbag deployed and the driver was belted, the serious/fatal injury rate was 18.26% as opposed to 12.14% when the driver was belted, but no airbag deployed or there was no airbag present. The higher injury rate when an airbag deploys is most likely indicative of more severe crashes in these cases.
Figure 4.
The Head-on Collision Classification Tree (Self-Protection)
The remainder of the tree classified the cases based on structural parameters. The Kw400 Crush-Work Stiffness, Initial Stiffness, and Vehicle Weight were found to have a statistically significant correlation with injury risk to the driver of the struck vehicle.
Vehicle Stiffness and Self-Protection
This analysis considers the effect of the Kw400 Crush-Work Stiffness and the Initial Stiffness in tandem. Due to the high degree of correlation between these two stiffness metrics, their effect can be synthesized into one view of a generic relationship between vehicle stiffness and injury risk
Both the Initial Stiffness and Kw400 Crush-Work Stiffness metrics were found to have a significant correlation with injury risk for all types of vehicles, with or without airbag deployment.
The relationship between the stiffness metrics and injury risk was uniform throughout the tree. As stiffness increased, the risk of serious or fatal injury to the driver decreased.
The degree of correlation between stiffness and injury risk is particularly striking when an airbag deployed. In these cases, initial stiffness had the strongest association with injury risk. This relationship may be due to the role that an airbag plays in managing the stress on the restraint system caused by higher initial stiffness.
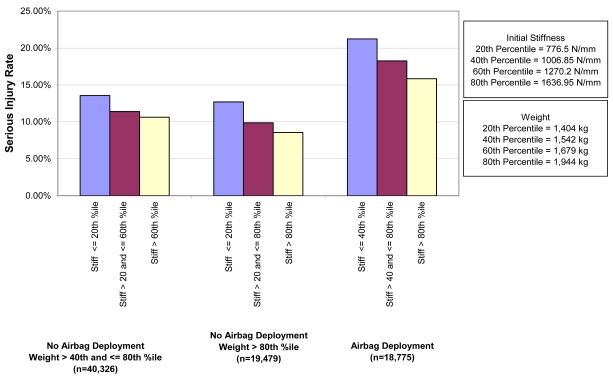
Figure 5 depicts the relationship between Initial Stiffness and injury risk for the portions of the classification tree. In all cases, as initial stiffness of the driver’s car increases, the injury risk to the driver decreases. Moreover, each instance in the classification tree divides the vehicles into three groups.
Figure 5.
Injury Rates by Vehicle Initial Stiffness for Cars (Self-Protection)
The improvement in safety between the least safe and safest groups was significant, ranging from 21.7% (when no airbag deployed and vehicle weight was between the 40th and 80th percentiles) to 25.4% (when an airbag deployed) to 32.6% (when no airbag deployed and vehicle weight was above the 80th percentile).
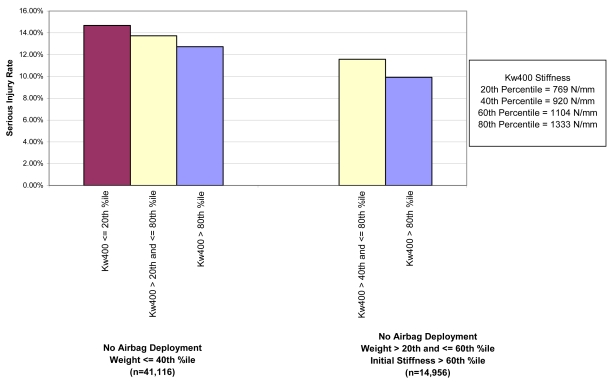
Figure 6 depicts the relationship between the Kw400 Crush-Work Stiffness and injury risk for the classification tree. As with the Vehicle Initial Stiffness, as the Kw400 Crush-Work Stiffness increases, the injury risk to the driver decreases.
Figure 6.
Injury Rates by Kw400 Crush-Work Stiffness for Cars
Again, each instance in the classification tree divides the vehicles into three groups. The threshold for the lowest, least safe group varies between the 20th and 40th percentile, while the threshold for the highest, safest group was the 80th percentile. Note that there were no vehicles with a Kw400 stiffness below the 40th percentile in the right-hand group of the figure.
When no airbag deployed and vehicle weight was less or equal than the 40th percentile, we can also see an increase in safety with increased vehicle stiffness.
Vehicle Weight and Self-Protection
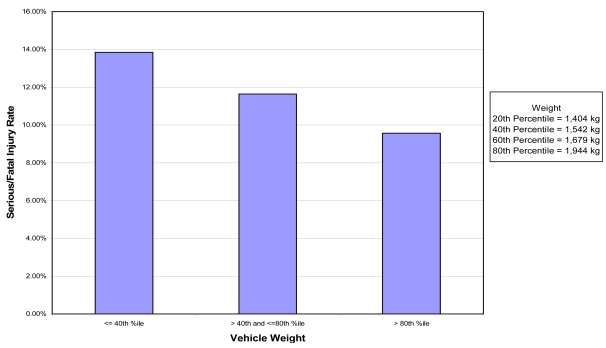
In addition to vehicle stiffness, vehicle weight was also found to have a significant correlation with injury risk, as shown by the classification tree in Figure 4. When no airbag deployed, the relationship between vehicle weight and injury risk conforms to previous research results, i.e., increased vehicle weight has the most significant correlation with reduced injury risk.
Figure 7 depicts the classic relationship between struck vehicle weight and injury risk predicted by previous research. When no airbag was present or the airbag did not deploy, increases in vehicle weight as associated with lower serious/fatal injury rates for the driver of that vehicle. Vehicles above the 80th percentile weight (> 1,944 kg) have an injury rate of 9.56% compared to 13.85% for vehicles at or below the 40th percentile weight (<= 1,542 kg).
Figure 7.
Vehicle Weight and Injury Risk When No Airbag Deployed
However, when an airbag deployed, the relationship between vehicle weight and injury risk did not conform to these previous results. For these cases, initial stiffness had the most significant correlation with injury risk (see Figure 4).
DISCUSSION
This study specifically investigated the likelihood of serious or fatal injury to a belted driver in a head-on collision. A wide range of possible explanatory, structural characteristics were included in this analysis, including Average Height of Force (AHOF); Initial Stiffness; relative and absolute measures of total crush, crush in the engine compartment, and crush in the occupant compartment; the Crush-Work Stiffness Kw400 metric of “stiffness”; vehicle body type; and vehicle weight. The study used a data-mining approach (classification tree algorithm) to find the most significant relationships between injury outcome and the structural characteristics.
To a certain extent, the relationships between vehicle weight and stiffness (independent variables) and the injury outcome (dependent variable) conform to previous studies. Specifically, the analysis found that heavier and stiffer vehicles were associated with a lower injury risk to the driver.
In addition, the analysis did yield two additional significant results. Vehicle stiffness was found to be more important than AHOF for self-protection. Given the potential issues of bumper mismatches, AHOF would have been expected to have a stronger correlation with injury risk. However, vehicle stiffness was found to have a universally significant correlation with injury risk, while AHOF was not found to be significant (at levels captured by this analysis).
The relative importance of stiffness and weight depended on whether an airbag deployed. When an airbag deployed, vehicle weight was not found to have a strong correlation, while initial stiffness did.
Vehicle weight certainly is important in these collisions. However, one possible explanation is that the importance of the vehicle weight is mitigated by the occupant restraint (indicated by airbag deployment). At a higher initial stiffness, more stress is placed on the restraint systems in a head-on collision.
Moreover, higher initial stiffness is associated with lower intrusion into the occupant cabin. Therefore these results suggest that lower intrusion into the vehicle cabin associated with higher stiffness is at least as important as vehicle weight.
In a sense, this study is similar to earlier research in which frontal safety was only concerned with crashworthiness while leaving out aggressivity and vehicle-to-vehicle compatibility. In other words, this paper is a study of self protection at a time when contemporary studies focus on compatibility. Today, the safety community has determined that good structural interaction—between two impacting vehicles—is required for good compatibility (Edwards, 2003). Other researchers have investigated how well vehicle characteristics, such as AHOF, spread the structural loading over various load paths in vehicle-to-vehicle compatibility studies (Mohan, 2007).
The authors believe that an engineering approach (e.g., pre-tensioners in the safety belts or balancing energy transfer in a collision) is a prudent leg of underpinning to automotive safety. There is another important leg of underpinning to automotive safety: A large number of real-world crashes show that the approach taken in the laboratory experiments results in thousands fewer deaths and severe injuries. The authors believe that this other branch must be studied further.
Initially, the authors considered applying logistic regression for this study. However, the analytical difficulties inherent in logistic regression limited its usefulness. The difficulties included the need to manually (or subjectively) determine which of the independent variables should be used by the model and the need to partition the values in an independent variable group.
The classification tree algorithm used here addresses these difficulties to a large extent. This methodology is able to process vast real-world crashes without the analysts subjectively directing the steps. The methodology proceeded purely on identifying the primary correlate with injury risk. At the next lowest branch of the tree, the methodology proceeded purely on the next primary correlate that was not a surrogate for the previously selected independent variable.
Limitations of the Analysis
The data sets used in this analysis presents limitations that should be kept in mind when interpreting results.
The structural attributes from the NCAP data may not correlate with real-world attributes because of their generation under laboratory conditions. For example, in these frontal tests, vehicles collide with a planar barrier. Consequently, the amount of intrusion due to bumper mismatches would not be captured in the NCAP tests.
The State Accident Databases contain no engineering measure of crash severity (e.g. ΔV). To mitigate this limitation, this study considers attempts to limit consideration to the most severe in which one of the vehicles required towing or the driver experienced a serious or fatal injury. Moreover, the significant number of cases used in this study mitigates this limitation through the law of large numbers.
Future Plans
In addition to the limitations inherent in the data, this analysis of vehicle self-protection, which does not take into account the properties of the striking vehicle, can provide only part of the explanation for the crash outcomes. Nonetheless, the data mining techniques described here provide a powerful tool to investigate more of these factors, most notably from the perspective of vehicle compatibility.
In addition to expanding this analysis to include additional collision types (e.g. front to side collisions), future work is planned to examine crash outcomes from the following perspectives:
Vehicle Aggressivity: An analysis of a dataset comprised of crash observations in which we know the structural parameters of the other vehicle and the injury outcome for the driver of this vehicle. This dataset can provide information about the structural parameters that are likely to cause injury to the drivers of other vehicles.
Vehicle Compatibility: An analysis of the dataset comprised of crash observations in which we know the structural parameters of both vehicles and the injury outcome for the driver. This dataset can provide information in two key areas. First, the dataset could elucidate the relative importance of the structural parameters of the striking versus the struck vehicle. This dataset can also be used to analyze under what circumstances struck vehicle parameters provide protection (e.g. when struck by a heavy or light vehicle).
The analysis will also be expanded through the examination of additional state data sources to further substantiate the relationships discovered in the current analysis.
CONCLUSION
A data mining analysis of State Data Files and NCAP frontal test results found statistically significant relationships between the risk of serious or fatal injury to a driver in a head-on collision and a number of vehicle structural parameters measured in the NCAP tests. These structural parameters are quantities that describe the physical features of a passenger vehicle, e.g., stiffness or frontal geometry.
The classification tree analysis of these real-world collisions produced the following major conclusions:
As found in previous literature, the struck vehicle weight is correlated with lower injury risk in many cases.
However, when an airbag deployed in the struck vehicle or when the striking vehicle weight is above the 40th percentile, the struck vehicle’s stiffness has the most statistically significant correlation with injury risk. That is, the drivers in the stiffer vehicles had the lower injury rate.
This analysis, therefore, suggests that the safety community might better improve self-protection by a renewed focus on increasing the stiffness of their vehicles in order to improve their crashworthiness in head-on collisions.
ACKNOWLEDGMENTS
This research was funded in part by Hyundai-Kia Research & Development, as part of the Hyundai-KIA Automotive Safety Research Laboratory (ASRL) at the National Crash Analysis Center. The views expressed herein are those of the authors and not necessarily those of Hyundai Motor Company or Kia Motors Corporation.
REFERENCES
- Anderson GC. Vehicle Year & Model Interchange List (Sisters and Clones List) Neptune Engineering; Clovis, CA: 2007. [Google Scholar]
- Austin R. Vehicle Aggressiveness in Real World Crashes. 19th International Technical Conference on the Enhanced Safety of Vehicles Conference (ESV); 2005. [Google Scholar]
- Digges K, Eigen A. Analysis of Load Cell Barrier Data to Assess Vehicle Compatibility. SAE World Congress; Detroit, Michigan. March 2000. [Google Scholar]
- Edwards MJ, Davies H, Thompson A, Hobba A. Development of test procedures and performance criteria to improve compatibility in car frontal collisions. Proceedings of the Institution of Mechanical Engineers. 2003;217 ProQuest Science Journals pg. 233. [Google Scholar]
- Highway Loss Data Institute (HLDI) Vindicator User’s Manual. Insurance Institute for Highway Safety; Arlington, VA: 2005. [Google Scholar]
- Highway Safety Information System (HSIS) Effects of a Towaway Reporting Threshold on Crash Analysis Results. Research and Development, Turner-Fairbank Highway Research Center; Aug, 1998. Publication No. FHWA-RD-98-114. [Google Scholar]
- Kahane CJ. Correlation of NCAP Performance with Fatality Risk in Actual Head-On Collisions. Jan, 1994. NHTSA Technical Report DOT HS 808 061. [Google Scholar]
- Mohan P, Marzougui D, Kan C-D. Modified Approach to Accurately Measure Height of Force (HOF). SAE Paper No. 2007-01-1182; April 2007. [Google Scholar]
- Mohan P, Smith DL. Finite Element Analysis of Compatibility Metrics in Frontal Collisions. 20th Enhanced Safety of Vehicles Conference, Paper Number 07-0188; Lyon, France. June 2007. [Google Scholar]
- Newstead S, Watson L, Cameron M. An Index for Rating the Total Secondary Safety of Vehicles from Real World Crash Data. 51st Annual Proceedings, Association for the Advancement of Automotive Medicine; October 2007; [PMC free article] [PubMed] [Google Scholar]
- NHTSA Test Reference Guide, Version 5 Volume I: Vehicle Tests, Prepared by Information Systems and Services, Inc., May 2001
- SAS Institute, “TREEDISC macro,” 1995.


