Abstract
This study used police-reported motor vehicle crash data from eleven states to determine ejection, fatality, and fatal/serious injury risks for belted drivers in vehicles with conventional seatbelts compared to belted drivers in vehicles with seat integrated restraint systems (SIRS). Risks were compared for 11,159 belted drivers involved in single- or multiple-vehicle rollover crashes. Simple driver ejection (partial and complete), fatality, and injury rates were derived, and logistic regression analyses were used to determine relative contribution of factors (including event calendar year, vehicle age, driver age/gender/alcohol use) that significantly influence the likelihood of fatality and fatal/serious injury to belted drivers in rollovers. Results show no statistically significant difference in driver ejection, fatality, or fatal/serious injury rates between vehicles with conventional belts and vehicles with SIRS.
INTRODUCTION
For a belted occupant, the effect of excursion on headroom is one of the most important factors influencing the likelihood of head-to-roof/window/ground impact during a rollover (Moffatt and Padmanaban, 2007). Several researchers have examined factors associated with occupant excursion: 1) the occupant motion within the seatbelt, and 2) “roof crush” that allows seatbelt anchor excursion toward the roof (Arndt et al., 1995; Bahling et al., 1990; Herbst et al., 1996; James et al., 1997; Meyer et al., 2000; Moffatt et al., 1997; Moffatt and James, 2005; and Rains et al., 1998). Many researchers have addressed the potential for changes in seatbelt geometry to limit excursion. Since the 1970s, manufacturers have been studying the concept of a seat integrated restraint system (SIRS) where the shoulder belt is anchored directly to the seat. In the early 1990s, Mercedes and BMW introduced vehicles which incorporated SIRS.
For conventional belt systems, the shoulder belt anchorage is attached to the vehicle structure. SIRS equipped vehicles have the belt anchorages incorporated into the seat itself; thus, all anchorage points move with the seat as it is adjusted.
There has been debate among highway safety researchers as to the relative effectiveness of each of these belt types in reducing injury/ejection in rollover crashes. This study uses field data to compare fatalities and fatal/serious injuries to belted drivers in all rollovers and single-vehicle-only rollovers for vehicles with conventional belts and vehicles with SIRS.
METHOD
Vehicles with SIRS in front outboard seating positions were identified, and their performance in rollovers was compared to that of vehicles with conventional belts.
Vehicle Data
First, US-registered 1991–2006 model-year light trucks and passenger cars equipped with SIRS in front outboard positions were identified (see Appendix B, Table B.2). Next, vehicles that had conventional belts for a few model years and subsequently were equipped with SIRS as standard equipment in front outboard seating positions were identified. For these makes/models, model years available with conventional belts for up to 3 years before the introduction of SIRS were compared with model years after the introduction of SIRS. The study excluded convertibles (see Appendix B, Table B.1).
Data analyses were performed using police-reported motor vehicle accident data from eleven states (Alabama, Florida, Idaho, Illinois, Maryland, Missouri, Nebraska, New York, North Carolina, Pennsylvania, and Wisconsin). At the time this study was done, state accident data was not available for calendar years 2005 and 2006. Hence, model years 1991–2004 were used in the data analyses.
The study included 5,316 belted drivers in SIRS vehicles and 5,843 belted drivers in conventional belt vehicles involved in rollovers. This study focused only on vehicles with SIRS offered as standard equipment in front outboard seating positions and for which there was a comparative non-SIRS equipped vehicle.
Accident Data
The primary source of field data is police-reported accident data maintained by state agencies. State selection for the study was made based on availability of electronic data on vehicle identification numbers (VINs); crash type (rollover/non rollover); driver age, gender, belt use, and ejection status (specified for all drivers, not just injured drivers); and injury severity. These data elements were essential to perform statistical analyses to compare risk of fatality, injury, and ejection for the two types of belts. The eleven states used for the study include the specified data and other driver/vehicular/environmental factors associated with the crash in their electronic files. These states provide field data that is frequently used by the National Highway Traffic Safety Administration (NHTSA) and other highway safety organizations to address rollover injury risks.
The key vehicle variables considered were: vehicle make, model, and year (derived from VIN coding); presence/absence of SIRS, and vehicle age at the time of the crash. The primary occupant variables considered were: injury severity (study looked at fatality and fatal/serious injury; see discussion of injury codes in following paragraphs); ejection status (non-ejection, complete, or partial); and driver age, gender, and alcohol use. The collision variables considered were: number of vehicles involved in the accident (single-vehicle/multiple-vehicle crashes), calendar year of the accident, and type of accident (rollover). The calendar years of crash data, by state, used for this study are: Alabama (1992–2004), Florida (1992–2004), Idaho (1992–2004), Illinois (1996–2003), Maryland (1993–2004), Missouri (1993–2004), Nebraska (2000–2004), New York (1995–2004), North Carolina (2000–2004), Pennsylvania (1995–2004), and Wisconsin (1999–2002). The years used and states selected were based on the availability of ejection and injury severity codes (Appendix C).
The police reports, from which the state accident data files are compiled, code occupant injury on a five-point scale known as KABCO: K = killed, A = incapacitating injury, B = non-incapacitating injury, C = possible injury, O = no injury. To determine where an injury falls on the KABCO scale, police officers rely on the definitions provided by the National Safety Council manual on Classification of Motor Vehicle Traffic Accidents. This injury coding scale is different from the AIS (Abbreviated Injury Scale) system, copyrighted by the Association for the Advancement of Automotive Medicine (AAAM) and used by National Automotive Sampling System (NASS) teams, which requires a post-accident medical analysis. The AIS is based on a scale of 0 to 7 designed to measure the threat to life. Both coding schemes are valid and have been used extensively by NHTSA to examine injury severity in rollover crashes.
Approach
For this study, two separate analyses were performed: 1) analyses for fatally injured drivers (with “K” injuries) in rollovers; 2) analyses for fatal/seriously injured drivers (with “K” or “A” injuries) in rollovers. First, simple fatality, fatal/serious injury, and ejection rates were obtained for belted drivers. Then, a statistical technique called logistic regression was used to determine whether the presence of SIRS is a statistically significant predictor of likelihood of fatality, serious/fatal injury, or ejection in rollovers.
Derivation of Simple Rates
The simple rates were compared for each make/model that introduced SIRS after a few years of conventional belts. By comparing injury and ejection rates for SIRS versus conventional belt vehicles for the same make/model, the study normalizes some of the differences in driver, environmental, and vehicular factors that could contribute to injury outcome in a rollover. In addition, logistic regression was performed to account for any other differences between the SIRS and conventional belt vehicles.
The risk of partial/complete ejection to belted drivers in rollovers was compared for SIRS versus conventional belts to see whether there was a difference in the ejection rates between SIRS and conventional belts.
Data on completely ejected belted drivers is sparse, and hence analyses of injury rate comparisons could not be done for this specific group alone. However, results addressing the risk of ejection included both partially and completely ejected drivers.
Logistic Regression
Logistic regression is a generalization of the multiple regression method, which permits data analysis at the crash level. For this study, logistic regression was used to model probability of fatality (K) and fatal/serious (K/A) injury. In logistic regression models, likelihood of fatality, for example, is a measure of association that explains how much more likely it is for someone to die in a crash with the presence of a factor (old age, for example) compared to the absence of the same factor. Rollovers are complex events with driver, driving environment, and vehicular factors interacting at the level of individual crashes to increase or decrease the likelihood of fatality or fatal/serious injury. To properly measure the relationship between fatality (or fatal/serious injury) and a vehicular factor such as the presence of SIRS, the relative effects of factors other than belt type that might also influence injury outcome must be explored concurrently. Logistic regression facilitates that exploration.
The logistic procedure, PROC LOGISTIC, within the SAS (Statistical Analysis System) statistical analysis software was used to perform this study.
Logistic regression models were developed for belted drivers to examine the factors influencing fatality and serious/fatal injury likelihood for: 1) all rollovers, and 2) single-vehicle rollovers. As is typically done in logistic regression analyses, overall model fit parameters and the statistical significance of each factor included were examined, beginning with statistical significance tests that were performed to determine whether the influence of a factor on fatality or serious/fatal injury likelihood is real or due to chance. The commonly accepted standard significance level (p-value) of 0.05 was used to test statistical significance.
This study did not include other vehicle parameters, such as roof strength-to-weight ratio, aspect ratio (overall vehicle height/track width), vehicle curb weight, or number of doors, that were included in previous studies (Padmanaban et al., 2004a, 2004b). The rationale is the previous studies showed that roof strength-to-weight ratio was not a statistically significant predictor of likelihood of fatality/serious injury and that other vehicle parameters, such as weight, aspect ratio, and number of doors, were not different for vehicle models with conventional belts and vehicle models with SIRS.
RESULTS
SIRS Vehicle Registration
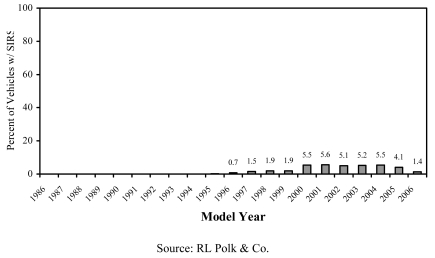
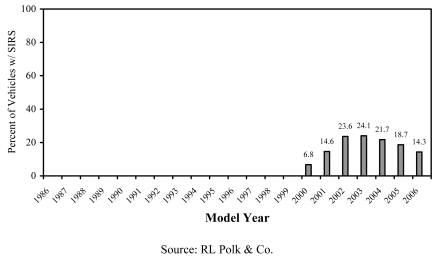
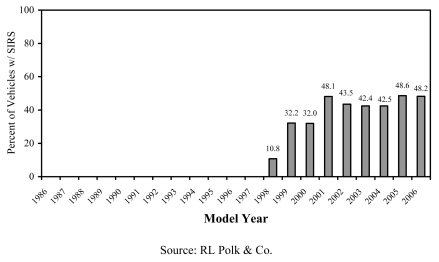
Figures 1, 2, and 3 (all figures are provided in Appendix A) present the number of passenger cars, sport utility vehicles, and pickup trucks equipped with SIRS (as standard equipment) in front outboard seating positions and registered in the US, by model year. The list of vehicles is presented in Appendix B.
As shown in these figures, even as late as 2004, very few passenger cars and sport utility vehicles had SIRS as standard equipment in front outboard positions, and the data for SUVs indicates that the use of SIRS in vehicles are diminishing.
Fatality and Fatal/Serious Injury Rates
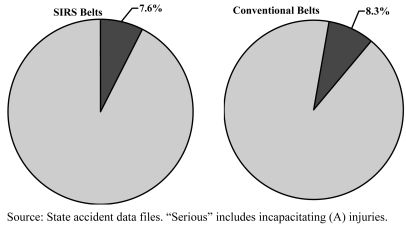
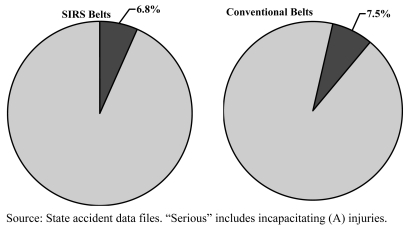
Figures 4 and 4A present fatality rates for belted drivers in all rollover and in single-vehicle rollover crashes respectively. Figures 5 and 5A present fatal/serious injury rates for belted drivers in all rollover and in single-vehicle rollover crashes respectively.
Figures 4 and 4A show that the risk of fatality to a belted driver in any type of belt is very low in rollovers (less than one percent) and that there is no statistically significant (p-value >0.05) difference between the fatality rates for drivers in SIRS or conventional belts. Figures 5 and 5A show that the risk of fatal/serious injury to a belted driver in any type of belt is about 7–8% for all rollovers and single-vehicle rollovers. Again, there is no statistically significant difference in fatal/serious injury rates between the two types of belts.
Ejection Rates
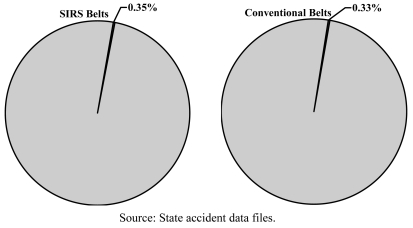
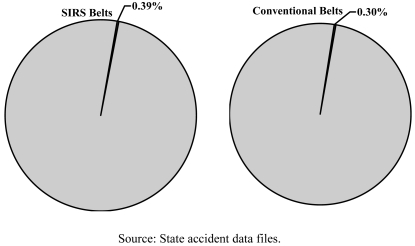
Figures 6 and 6A present partial ejection rates for belted drivers by belt type for all and single-vehicle rollovers. As seen in these figures, the risk of partial ejection to belted drivers is about 0.3% to 0.4% in rollovers. Both belt types reduce the risk of partial ejection.
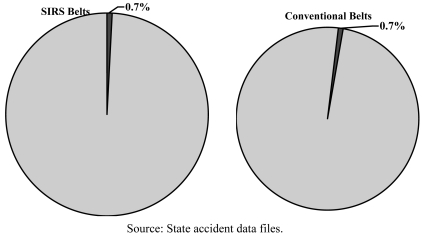
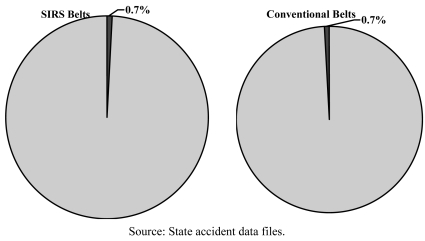
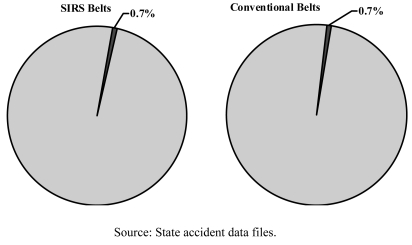
The corresponding data for the risk of partial or complete ejections was also derived. There was insufficient data to address belted complete ejections separately. For belted drivers in all rollovers, the risk of partial/complete ejection is 0.7% for SIRS and 0.8% for conventional belts. This difference was not statistically significant (p-value = 0.9). For single-vehicle rollovers, the risk of partial/complete ejection rate is 0.7% for both types of belts (Figure 6B). Once again, the risk of partial or complete ejection to a belted driver in SIRS or conventional belts is very low.
Logistic Regression Results
To account for any differences between the vehicles with conventional belts and vehicles with SIRS, a statistical technique called “logistic modeling” was performed. First, the factors included in logistic models were examined for their statistical significance in influencing likelihood of fatality or fatal/serious injury. Next, the contribution of each factor to the logistic model fit (irrespective of its statistical significance) was examined. The models were developed for belted non-ejected and partially ejected drivers in all rollovers and in single-vehicle rollovers.
Results of Statistical Significance Testing
Likelihood of Fatality — The results of the statistical significance tests for factors included in the study are provided in Table 1 for all rollovers and Table 1A for single-vehicle rollovers. The commonly accepted probability of 0.05 was used to test the statistical significance of each factor.
Table 1.
Statistical Significance in Predicting Likelihood of Fatality: All Rollovers (“Yes” indicates a statistically significant factor.)
| Factor | Belted Non-/Partially Ejected Drivers |
|---|---|
| Driver Age | Yes (p<0.0001) |
| Driver Drinking | Yes (p = 0.004) |
| Driver Gender | No (p = 0.80) |
| Vehicle Age | No (p = 0.59) |
| Calendar Year | No (p = 0.95) |
| Presence of SIRS | No (p = 0.61) |
Table 1A.
Statistical Significance in Predicting Likelihood of Fatality: Single-Vehicle Rollovers (“Yes” indicates a statistically significant factor.)
| Factor | Belted Non-/Partially Ejected Drivers |
|---|---|
| Driver Age | Yes (p<0.0001) |
| Driver Drinking | No (p = 0.07) |
| Driver Gender | No (p = 0.78) |
| Vehicle Age | No (p = 0.39) |
| Calendar Year | No (p = 0.73) |
| Presence of SIRS | No (p = 0.69) |
Driver age, driver drinking, and in some cases driver gender were identified as significant factors in predicting likelihood of fatality for all rollovers and for single-vehicle rollovers. The presence of SIRS was not a significant predictor of likelihood of fatality.
For the factors that were found to be significant, the “direction” of the likelihood of fatality or serious injury is as follows:
Age
Older drivers have higher likelihood of fatality or serious injury.
Drinking
Drivers with alcohol presence have higher likelihood of fatality or serious injury.
Gender
Female drivers have higher likelihood of fatality or serious injury.
Likelihood of Serious/Fatal Injury — The results of the statistical significance tests for factors included in the fatal/serious injury study are provided in Tables 2 and 2A for all rollovers and single-vehicle rollovers.
Table 2.
Statistical Significance in Predicting Likelihood of Fatal/Serious Injury: All Rollovers (“Yes” indicates a statistically significant factor.)
| Factor | Belted Non-/Partially Ejected Drivers |
|---|---|
| Driver Age | Yes (p<0.0001) |
| Driver Drinking | Yes (p = 0.006) |
| Driver Gender | Yes (p = 0.02) |
| Vehicle Age | No (p = 0.09) |
| Calendar Year | No (p = 0.68) |
| Presence of SIRS | No (p = 0.57) |
Table 2A.
Statistical Significance in Predicting Likelihood of Fatal/Serious Injury: Single-Vehicle Rollovers (“Yes” indicates a statistically significant factor.)
| Factor | Belted Non-/Partially Ejected Drivers |
|---|---|
| Driver Age | Yes (p<0.0001) |
| Driver Drinking | Yes (p = 0.005) |
| Driver Gender | Yes (p = 0.014) |
| Vehicle Age | No (p = 0.24) |
| Calendar Year | No (p = 0.81) |
| Presence of SIRS | No (p = 0.95) |
As Tables 2/2A show, driver age, driver drinking, and driver gender were identified as significant factors in predicting likelihood of serious/fatal injury. Once again, SIRS did not show up to be a significant predictor of likelihood of fatality/serious injury.
Relative Explanatory Power
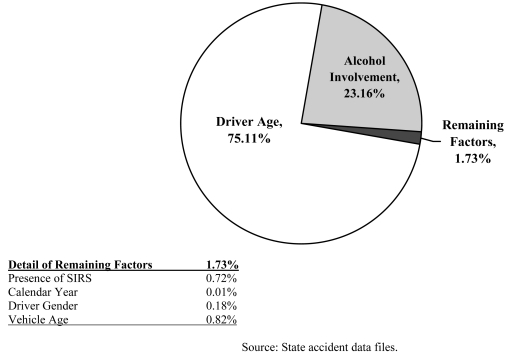
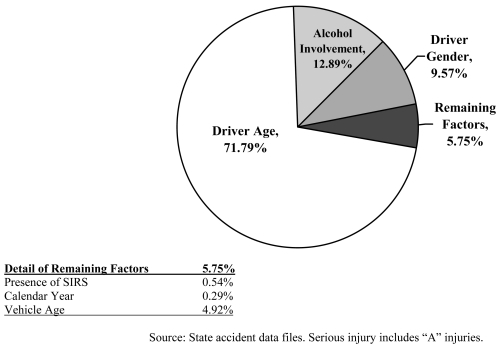
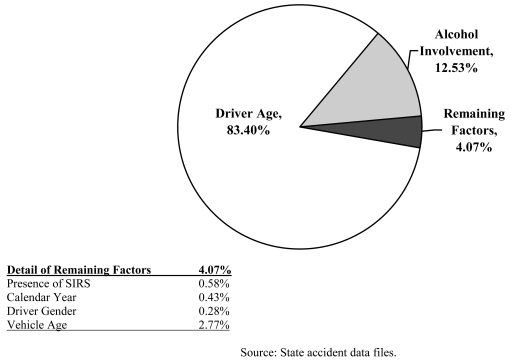
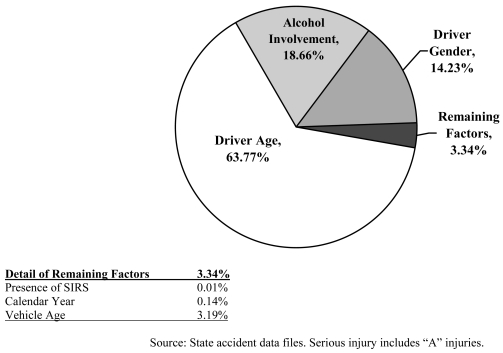
To further evaluate the relative importance of the factors influencing likelihood of fatality or fatal/serious injury, the relative explanatory power of each factor (derived from Wald Chi-Square) was derived, as shown in Figures 7 through 10. Figure 7 presents the relative explanatory power of various factors to likelihood of fatality, and Figure 8 presents the relative explanatory power of various factors to likelihood of fatal/serious injury for belted non-ejected and partially ejected drivers.
For belted non-ejected/partially ejected drivers, the factors of driver age and drinking explained about 98.3% of variation in likelihood of fatality among vehicle groups (Figure 7). These factors were also statistically significant. The remaining factors explained only 1.73% of variation in likelihood of fatality. In particular, presence of SIRS (as opposed to conventional belts) explained only 0.72% of the variation in likelihood of fatality in rollovers.
Figure 8 presents similar results for fatal/serious injury analyses. The figure shows that driver age, driver drinking, and driver gender explained about 94.3% of variation in likelihood of fatal/serious injury. These factors were also statistically significant. Presence of SIRS explained about 0.54% of the variation in likelihood of fatal/serious injury.
In summary, the results are consistent for fatal injury and fatal/serious injury analyses. Presence of SIRS (compared to conventional belts) is not a significant predictor of likelihood of fatality or of fatal/serious injury in rollovers, and it explains less than 0.72% of variation in likelihood of fatality and 0.54% of variation in likelihood of fatal/serious injury.
Figures 9 and 10 present corresponding results for single-vehicle rollovers, with Figure 9 showing the relative explanatory power of various factors to likelihood of fatality, and Figure 10 presenting the relative explanatory power of various factors to likelihood of fatal/serious injury for belted non-ejected and partially ejected drivers.
Figure 9 shows that for belted non-ejected or partially ejected drivers in single-vehicle rollovers, about 95.9% of variation in likelihood of fatality was explained by driver age and driver drinking. Of the remaining factors (4.07%), SIRS explained 0.58% of the variation in likelihood of fatality.
Figure 10 shows that driver age, gender, and drinking explained about 96.7% of variation in likelihood of fatal/serious injury. Of the remaining factors (3.33%), presence of SIRS explained only 0.01% of variation in likelihood of fatal/serious injury in single-vehicle rollovers.
CONCLUSION
Studies have repeatedly shown that belt use is the single most important factor in reducing the likelihood of fatality, fatal/serious injury, or ejection (complete or partial) in a rollover. Because belts perform such a valuable function in saving lives and reducing serious injury, the safety community has long examined issues associated with belt excursion/injury reduction and occupant containment in rollover crashes. To better understand what SIRS may contribute to occupant safety in rollover crashes, this study was undertaken to examine real world data on the relative performance of vehicles equipped with SIRS and conventional belts. The study relied on field data that is frequently used by NHTSA to address rollover safety performance. Accident databases for the selected states provide large volumes of data to permit meaningful comparisons of injury risks to drivers in vehicles equipped with conventional belts and SIRS.
Based on the rollover data examined:
There is no statistically significant difference in driver fatality or fatal/serious injury rates between vehicles with conventional belts and vehicles with SIRS.
There is no statistically significant difference in driver ejection (partial/complete) rates between vehicles with conventional belts and vehicles with SIRS.
Risk of fatality is low (less than one percent) for belted drivers in rollovers in vehicles with conventional belts and vehicles with SIRS.
Risk of partial ejection is low (less than one-half percent) for belted drivers in rollovers in vehicles with conventional belts and vehicles with SIRS.
Risk of partial/complete ejection is low (less than 0.8 percent) for belted drivers in rollovers in vehicles with conventional belts and vehicles with SIRS.
Statistical models show that presence of SIRS is not a statistically significant predictor influencing likelihood of fatality to belted drivers in rollovers.
Statistical models show that presence of SIRS is not a statistically significant predictor influencing likelihood of fatal/serious injury to belted drivers in rollovers.
ACKNOWLEDGEMENTS
The authors thank Ford Motor Company for funding this research.
Appendix A: Figures
Figure 1.
Percent of Registered Passenger Cars with Seat Integrated Restraint Systems, by Vehicle Model Year
Figure 2.
Percent of Registered Sport Utility Vehicles with Seat Integrated Restraint Systems, by Vehicle Model Year
Figure 3.
Percent of Registered Pickup Trucks with Seat Integrated Restraint Systems, by Vehicle Model Year
Figure 4.
Fatality Rates in All Rollovers:
Belted Drivers (SIRS vs. Conventional Belts; p=1.0)
Figure 4A.
Fatality Rates in Single-Vehicle Rollovers:
Belted Drivers (SIRS vs. Conventional Belts; p=1.0)
Figure 5.
Fatal/Serious Injury Rates in All Rollovers:
Belted Drivers (SIRS vs. Conventional Belts; p=0.196)
Figure 5A.
Fatal/Serious Injury Rates in Single-Vehicle Rollovers: Belted Drivers (SIRS vs. Conventional Belts; p=0.201)
Figure 6.
Risk of Partial Ejection in All Rollovers:
Belted Drivers (SIRS vs. Conventional Belts; p=0.857)
Figure 6A.
Risk of Partial Ejection in Single-Vehicle Rollovers:
Belted Drivers (SIRS vs. Conventional Belts; p=0.463)
Figure 6B.
Risk of Partial/Complete Ejection in Single-Vehicle Rollovers:
Belted Drivers (SIRS vs. Conventional Belts; p=0.797)
Figure 7.
Relative Explanatory Power of Variables to Likelihood of Fatality (All Rollovers):
Belted Non-Ejected and Partially Ejected Drivers
Figure 8.
Relative Explanatory Power of Variables to Likelihood of Fatal/Serious Injury (All Rollovers):
Belted Non-Ejected and Partially Ejected Drivers
Figure 9.
Relative Explanatory Power of Variables to Likelihood of Fatality (Single-Vehicle Rollovers):
Belted Non-Ejected and Partially Ejected Drivers
Figure 10.
Relative Explanatory Power of Variables to Likelihood of Fatal/Serious Injury (Single-Vehicle Rollovers):
Belted Non-Ejected and Partially Ejected Drivers
Appendix B: SIRS-Equipped Vehicles
Table B.1.
Model Years and Vehicles Included in the Statistical Study
| Model Years SIRS was Included | Make | Model | Model Years SIRS was Included | Make | Model |
|---|---|---|---|---|---|
| 1996–1999 | Bentley | Continental | 1998–2001 | Dodge | Ram 3500 Extended Cab |
| 2000–2004 | Buick | LeSabre | 2001–2004 | Ford | F-250/350 Supercab |
| 1997–2004 | Buick | Park Avenue | 1999–2004 | GMC | Sierra 1500 |
| 2000–2004 | Cadillac | Deville | 1999–2004 | GMC | Sierra 2500 |
| 1998–2004 | Cadillac | Seville | 2001–2004 | GMC | Sierra 3500 |
| 2001–2003 | Oldsmobile | Aurora | 2002–2004 | Cadillac | Escalade |
| 2000–2004 | Pontiac | Bonneville | 2000–2004 | Chevrolet | Suburban |
| 1999–2004 | Chevrolet | C/K 1500 | 2000–2004 | Chevrolet | Tahoe |
| 1999–2004 | Chevrolet | C/K 2500 | 2000–2004 | GMC | Yukon |
| 2001–2004 | Chevrolet | C/K 3500 | 2001–2004 | GMC | Yukon Denali |
| 2001–2004 | Ford | F-150 Supercab | 2002–2003 | Oldsmobile | Bravada |
| 1998–2001 | Dodge | Ram 1500 Extended Cab | 2000–2004 | GMC | Yukon XL |
| 1998–2001 | Dodge | Ram 2500 Extended Cab |
Table B2.
2006-Model-Year-and-Older Vehicles Equipped with SIRS as Standard Equipment in Front Outboard Seating Positions
| Model Years | Make | Model | Model Years | Make | Model |
|---|---|---|---|---|---|
| 2001–2006 | Ford | F-150 Supercab | 2002–2006 | Chevrolet | Avalanche |
| 2001–2006 | Ford | F-250 & F-350 Supercab | 2001–2003 | Oldsmobile | Aurora |
| 2005–2006 | Ford | F-150 Regular Cab | 2002–2003 | Oldsmobile | Bravada |
| 1996–2006 | Chrysler | Sebring Convertible | 2000–2006 | GMC | Yukon |
| 1998–2001 | Dodge | Ram Quad Cab | 2001–2006 | GMC | Yukon Denali |
| 2003–2006 | Isuzu | Ascender | 2000–2006 | GMC | Yukon XL |
| 2003–2006 | Hummer | H2 | 2002–2006 | GMC | Envoy |
| 1991–1997 | BMW | 8-Series | 2002–2006 | Cadillac | Escalade |
| 2000–2005 | Buick | LeSabre | 2003–2006 | Cadillac | CTS |
| 1997–2006 | Buick | Park Avenue | 2004–2006 | Cadillac | SRX |
| 2004–2006 | Buick | Rainier | 1998–2004 | Cadillac | Seville |
| 2000–2005 | Pontiac | Bonneville | 2000–2005 | Cadillac | Deville |
| 1999–2006 | Chevrolet | Silverado 1500 | 2000–2006 | BMW | 3-Series Convertible |
| 1999–2006 | Chevrolet | Silverado 2500 | 2005–2006 | BMW | 6-Series Convertible |
| 2001–2006 | Chevrolet | Silverado 3500 | 1990–2006 | Mercedes | SL Class |
| 1999–2006 | GMC | Sierra 1500 | 1996–2002 | Bentley | Azure |
| 1999–2006 | GMC | Sierra 2500 | 1996–2002 | Bentley | Continental |
| 2001–2006 | GMC | Sierra 3500 | 2004–2006 | Maybach | 57 & 62 |
| 2002–2006 | Chevrolet | Trailblazer | 2000–2002 | Rolls Royce | Corniche |
| 2000–2006 | Chevrolet | Suburban | 1995–2003 | Ferrari | 456 & 456M |
| 2000–2006 | Chevrolet | Tahoe | 2005–2006 | Ferrari | 612 |
Appendix C: Coding Status for All 50 States
| States | All Rollovers | SVA Rollovers | Comments | States | All Rollovers | SVA Rollovers | Comments |
|---|---|---|---|---|---|---|---|
| AL | X | X | MT | No VINs | |||
| AK | No VINs after 1996 | NB | X | X | |||
| AZ | Not available | NV | No VINs | ||||
| AR | X | No VINs for 1997 and later | NH | Not available | |||
| CA | Not available to public | NJ | No VINs | ||||
| CO | No VINs | NM | Not available | ||||
| CT | Not available | NY | X | X | |||
| DE | Not available | NC | X | X | |||
| FL | X | X | ND | No VINs | |||
| GA | No VINs until 2003 | OH | X | Stopped coding VINs in 1999 | |||
| HI | No VINs | OK | NO VINs | ||||
| ID | X | X | OR | Not available | |||
| IL | X | X | PA | X | X | ||
| IN | No VINs | RI | No VINs | ||||
| IA | Codes only injured drivers | SC | No VINs | ||||
| KS | X | SD | No VINs | ||||
| KY | Cannot link person and vehicle files | TN | No VINs | ||||
| LA | No VINs | TX | No VINs | ||||
| ME | Not available | UT | NOT available after 1995 | ||||
| MD | X | X | VT | No VINs | |||
| MA | Not available | VA | No VINs | ||||
| MI | No VINs until 2004 | WA | NOT available at the time of research | ||||
| MN | Not Available | WV | No VINs | ||||
| MS | Only codes VINs for fatals | WI | X | X | |||
| MO | X | X | WY | X | SVA rollovers only |
SVA=Single-Vehicle Accident.
REFERENCES
- Arndt MW, Mowry GA, Dickerson CP, Arndt SM. Evaluation of Experimental Restraints in Rollover Conditions. Society of Automotive Engineers, paper No. 952712, 39th Stapp Car Crash Conference; 1995.1995. [Google Scholar]
- Bahling GS, Bundorf RT, Kaspzyk GS, Moffatt EA, Orlowski KF, Stocke JE. Rollover and Drop Tests—The Influence of Roof Strength on Injury Mechanics Using Belted Dummies. Society of Automotive Engineers, paper No. 902314, 34th Stapp Car Crash Conference; Orlando, FL. 1990.1990. [Google Scholar]
- Herbst Brian, Forrest Stephan, Wang Philip, Chng David, Friedman Donald, Friedman Keith. The Ability of Three-Point Safety Belts to Restrain Occupants in Rollover Crashes. 15th Annual Technical Conference on Enhanced Safety of Vehicles, 96-S5-0-12; Melbourne. 1996. 1996. [Google Scholar]
- James MB, Allsop DL, Nordhagen RP, Decker RL. Injury Mechanisms and Field Accident Data Analysis in Rollover Crashes. Society of Automotive Engineers, paper No. 970396, SAE Transactions; New York, NY: 1997. 1997. pp. 588–599. [Google Scholar]
- Meyer Steven E, Davis Mark, Chng David, Herbst Brian, Forrest Stephen. Three-Point Restraint System Design Considerations for Reducing Vertical Occupant Excursion in Rollover Environments. Society of Automotive Engineers, paper No. 2000-01-0605, SAE Transactions, ; New York, NY. 2000.2000. pp. 784–788. [Google Scholar]
- Moffat Edward A, Padmanaban Jeya. NHTSA’s Benefit Model in the Proposed FMVSS 216 Roof Strength Standard. Rear Impact, Rollover and Side Impact Session paper 2007-01-0373, Society of Automotive Engineers World Congress & Exhibition; Detroit, Michigan. April 16–19, 2007.2007. [Google Scholar]
- Moffatt Edward A, James Michael B. Headroom, Roof Crush, and Belted Excursion in Rollovers. Society of Automotive Engineers, paper No. 2005-01-0942; April 2005.2005. [Google Scholar]
- Moffatt EA, Cooper ER, Croteau JJ, Parenteau C, Toglia A. Head Excursion of Seat Belted Cadaver, Volunteers and Hybrid III ATD in a Dynamic/Static Rollover Fixture. Society of Automotive Engineers, paper No. 973347, SAE Transactions; New York, NY. 1997.1997. pp. 4024–4040. [Google Scholar]
- Moffatt Edward A, Padmanaban Jeya. The Relationship Between Roof Strength and Occupant Injury in Rollover Accident Data; 1995. May, 1995. Report No. FaAA-SF-R-95-05–37. [Google Scholar]
- Moffatt Edward A, Padmanaban Jeya. The Relationship Between Vehicle Roof Strength and Occupant Injury in Rollover Crash Data. Association for the Advancement of Automotive Medicine (AAAM), 39th Annual Proceedings; October 1995.1995. [Google Scholar]
- National Highway Traffic Safety Administration. Request for Comments regarding Consumer Information Regulations – Rollover Prevention. Federal Register [65 FR 34998], Docket No. NHTSA-2000-6859-1; June 1, 2000.2000. [Google Scholar]
- Padmanaban Jeya, Moffatt Edward A, Marth Debora R. Factors Influencing the Likelihood of Fatality and Serious/Fatal Injury in Single-Vehicle Rollover Crashes. Report to Ford Motor Company, February 7, 2004; Roof Crush Resistance Docket, submission No. NHTSA-1999-5572-70; March 4, 2004.2004a. [Google Scholar]
- Padmanaban Jeya, Moffatt Edward A, Marth Debora R. Addendum to Docket Submission NHTSA-1999-5572-70, ‘Factors Influencing the Likelihood of Fatality and Serious/Fatal Injury in Single-Vehicle Rollover Crashes’. Roof Crush Resistance Docket, submission No. NHTSA-1999-5572-79; April 27, 2004.2004b. [Google Scholar]
- Rains Glen, Elias Jeff, Mowry Greg. Evaluation of Restraints Effectiveness in Simulated Rollover Conditions. 16th Annual Technical Conference on the Enhanced Safety of Vehicles, 98-S8-W-34; 1998. 1998. pp. 1897–1908. [Google Scholar]


