Abstract
This study examines the pattern of facial fractures in automotive collisions using the National Automotive Sampling System – Crashworthiness Data System. The database was examined for trends within collision and occupant descriptors among occupants sustaining facial fractures. Drivers and right front passengers were included in an analysis of frontal collisions. Side impacts were assessed separately by identifying occupants exposed to near and far side collisions. The distribution of facial bone fractures and injury sources were demonstrated for each impact configuration. Risk ratios were used to demonstrate the effects of restraint use and airbag deployment. Seatbelts were found to reduce the risk of sustaining a facial fracture by 74% in frontal impacts. Facial fractures are associated with severe impacts with a risk of 5% at a Delta-V of 40 km/h and 65 km/h for unbelted and belted occupants respectively.
INTRODUCTION
The four most common sources of facial trauma are Motor Vehicle Collision (MVC), assault, sports and falls (Lim 1993; Muraoka 1995; Jayamanne, Gillie 1996; Shaprio 2001; Gassner 2003). Facial fractures incurred due to a MVC are more likely to result in associated head injury; therefore, the identification of parameters associated with facial fracture will reduce the likelihood of more severe head injuries (Lim 1993). A study of over 3,000 hospital ER patients found that the zygoma is the most frequently fractured facial bone (Hackle 2001). Orbital blow-out fractures have also been shown to be among the most common facial fractures due to a MVC (Jayamanne, Gillie 1996; Hackle 2001). Studies examining the effects of restraint systems have found that the presence of an airbag and seatbelt use reduced the likelihood of sustaining a facial fracture (Murphy 2000; Shaprio 2001).
The majority of the previous statistical studies on facial fractures are limited to a review of a series of trauma cases (Arajarvi 1986; Beck, Blakeslee 1989; Vetter 1991; Worrall 1991; Alvi 2003). These studies can provide useful information regarding treatments and overall injury patterns from a wide variety of injury sources. However, these reviews lack important information specific to injuries caused by MVCs. Studies utilizing the National Automotive Sampling System – Crashworthiness Data System (NASS-CDS) can assess the influence of various automotive related factors on the occurrence of facial fractures. A study by Cox et al. (2004) utilized the NASS-CDS to assess the effects of restraint use and airbag exposure for crashes occurring between 1991 and 2000 (Cox 2004). This study did not consider the influence of crash severity, described by the Delta-V (ΔV) of the collision on the risk of facial fracture. Knowing the ΔV of impacts that cause facial fractures will help relate the occurrence of these injuries to testing performed by the NHTSA to evaluate vehicle performance using crash test dummies. This study will utilize the most recent NASS-CDS data available to determine the pattern of facial fractures in frontal and side impacts. Additional analyses will demonstrate the sources of facial fractures and the association with crash severity.
METHODS
The data for this study were obtained from the NASS-CDS database for years 1993 to 2007. These offer little or no information regarding the relationship between facial trauma and the collision event. The National Automotive Sampling System – Crashworthiness Data System (NASS-CDS) represents a sample of vehicular crashes in the United States that is weighted to represent national trends. Approximately half of the available cases provide information regarding the severity of the collision in terms of Delta-V (ΔV) and the Principal Direction of Force (PDOF). All data were processed using the Statistical Analysis Software (SAS Institute, Cary N.C). All analyses were limited to occupants 18 years of age or older. Events including a rollover or ejected occupants were excluded. Injuries within NASS are coded using the 2000 version of NASS Injury Coding Manual (AAAM 2000). The “system / organ” definition within the SAS data files was used to determine whether the occupant incurred a facial injury. Facial fracture was further determined using the “lesion” variable, with the exception of teeth fractures and rupture of the mucosal membranes of the nose which were not included in the analysis as a facial fracture. Frontal bone fracture does not have a specific AIS Code within NASS; therefore, these fractures were identified by the body region and aspect for each injury (AAAM 2000). A vault fracture with an anterior aspect is the designation for a frontal bone fracture and these were identified within the NASS dataset and included within the facial fracture variable. Frontal bone fractures and facial fractures were combined to create a single variable indicating whether or not a person incurred a facial fracture. The final dataset included a total of 93,339 occupants weighted to 43,325,675.
The influence of vehicle and occupant parameters on the risk of facial fracture was assessed using risk ratios. The risk ratios were derived from 2x2 contingency tables. Confidence intervals for risk ratios were determined using the unweighted data and risks were determined using weighted data. Using the unweighted data for risk ratios maintains the correct distribution of occupant and vehicle parameters, which is disturbed by weighting the data. Using the weighted data for the overall risk produces more conservative risks because low-severity impacts in the NASS-CDS database are underrepresented in the raw data. The correlation between variables was assessed using Pearson’s test for correlation. Statistical significance for all analyses was set at p < 0.05.
For frontal and rear impacts, occupants seated in the front outboard positions were analyzed separately. For side impacts, occupants seated in the outboard position of the front and rear seats were grouped into near and far side impacts. Variables describing the availability of side airbags and deployment status were combined to assess the effects of side airbags. The BAGAVOTH variable in the NASS database specifies the availability of other airbags besides a frontal airbag. The BAGDEPOT variable can then be used to determine if the denoted bag deployed during the event (NHTSA 1997). The variable RESTYPE identifies the type of airbags available within the vehicle; therefore, when combined with BAGAVOTH, the type of side airbag available to an occupant can be determined. Injury sources for occupants in frontal impacts were demonstrated separately for drivers and right front passengers. In order to normalize for collision severity when analyzing the effect of airbag deployments, frontal collisions with a ΔV less than 25 km/h were excluded for the injury source analyses. No methods were utilized to account for missing data. Observations missing data of interest were not utilized for that particular analysis.
Statistical models were created to estimate the risk of facial injuries and the influence on vehicle and occupant descriptors. Non-parametric models were created using the Consistent Threshold method described by Nusholtz and Mosier (Nusholtz, Mosier 1999). The CT method is designed to determine the risk of an outcome based on doubly censored data. The data obtained from NASS CDS are doubly censored because the only measure of exposure is a single number describing the change in velocity of the vehicle which is not a measure of the exact exposure level necessary to cause the injury. The methodology for calculating the CT risk function was implemented into a custom algorithm in Matlab (The Mathworks, Natick MA) to determine the risk of injury for various occupant groups as a function of ΔV. Survival analysis was also performed using a parametric approach for determining the risk of facial injury.
A Weibull model was chosen because of its increasing hazard model with severity and the closed form solution of its Cumulative Distribution Function (Lee 2003). The Weibull CDF is given by:
| (Equation 1) |
where λ and γ are the scale and shape parameters respectively and ΔV is the change in velocity of the vehicle. This function will provide an estimate of risk of injury using the maximum likelihood estimate of the scale and shape parameters. The LIFEREG procedure within SAS accounts for left and right censoring and, therefore will be used to determine the parameter estimates (Allison 1995; Cantor 2003).
RESULTS
Overall Trends
Overall trends in facial fractures were investigated by examining various parameters for all occupants, without regard for impact direction. This dataset contained 93,339 unweighted occupants, and was the largest dataset because of the lack for a need of a vehicle inspection to determine a ΔV. Overall, the most common facial injuries were abrasions (21%), contusions (32%), lacerations (32%) and fractures (11%). The average Body Mass Index (BMI) for males was 27 and 26 for females.
Belt use significantly reduced the risk of facial injury (Risk Ratio RR: 0.5, 95% Confidence Interval CI: 0.47–0.51) and facial fracture (RR: 0.36 CI: 0.34–0.39). There was no statistical difference in risk of facial fracture between drivers and right front passengers. Males over the age of 18 had a statistically higher risk of facial fractures (RR: 1.47 CI: 1.4–1.6). Within the adult population, age did not increase the likelihood of sustaining a facial fracture. This is consistent with previous research which demonstrated a lack of an age effect which was attributed to the composition of the skull being mostly cortical bone (Yoganandan 1988). As a point of interest, when considering younger occupants those less than 10 years of age had the lowest risk (p<0.0001) for facial fracture. This age group was not included in the preceding analysis, however, it is important to note the relatively smaller risk for children.
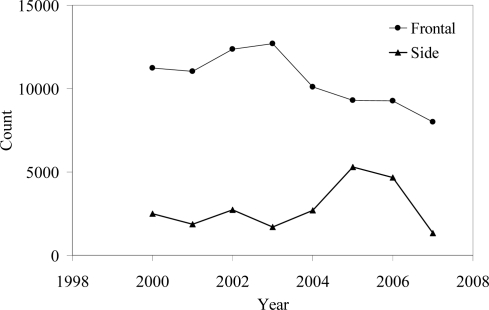
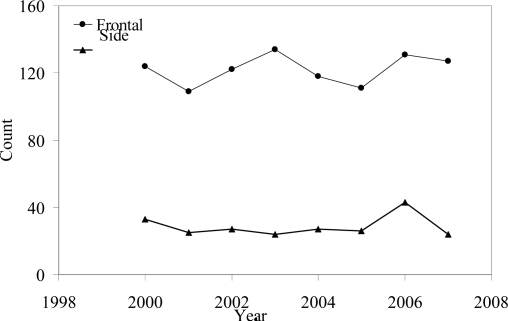
Accounting for direction, during 2007 there were 8000 weighted cases of facial fracture due to frontal impacts and 1350 during side impacts (Figure 1). The unweighted data demonstrated the same general trends as the weighted counts (Figure 2).
Figure 1.
Weighted number of facial fractures by year and impact direction.
Figure 2.
Unweighted number of facial fractures by year and impact direction.
Facial fracture was 1.5 times (p<0.0001) more likely in a frontal impact than a side impact and had an overall risk of 1% in the NASS-CDS database.
Frontal Impacts
Within the dataset containing known ΔVs, there were a total of 37,630 drivers (Table 1) and 8,700 right front passengers (Table 2). Frontal impacts posed the greatest risk of any facial injury (6%), facial injury of AIS 2+ (1%) and facial fracture (1%) compared to other impact severity. The most common facial fractures sustained by drivers (Figure 3) and right front passengers (Figure 4) were to the nose, mandible, orbit and maxilla. Restraint use had only marginal effects on the distribution of facial injuries to drivers in frontal impacts. Only 386 right front passengers incurred a facial fracture and, therefore, a detailed look at the distribution by restraint use was not performed.
Table 1:
Summary of counts for drivers in frontal impacts.
| Raw | Weighted | |
|---|---|---|
| Total | 37,630 | 17,073,744 |
| Facial Fractures | 1,166 | 128,017 |
| Frontal | 120 | 6,340 |
| Nasal | 545 | 78,992 |
| Maxilla | 270 | 19,125 |
| Mandible | 231 | 23,559 |
Table 2:
Summary of counts for right front passengers in frontal impacts.
| Raw | Weighted | |
|---|---|---|
| Total | 8,699 | 3,469,836 |
| Facial Fractures | 221 | 23,272 |
| Frontal | 16 | 561 |
| Nasal | 97 | 14,061 |
| Maxilla | 55 | 5,085 |
| Mandible | 53 | 3,565 |
Figure 3.
Distribution of facial bone fractures for adult drivers in frontal impacts using unweighted data.
Figure 4.
Distribution of facial bone fractures for adult right front passengers in frontal impacts using unweighted data.
Risk ratios were determined to illustrate the effects of various restraint combinations (Table 3). The data segment defines the occupant cohort used for the defined comparison; no additional adjustments were made to the data segment. Airbags were more effective in reducing the risk of facial injury (RR: 0.73 CI: 0.68–.0.79) in belted (RR: 0.5 CI: 0.42–.077) than unbelted (RR: 0.65 CI: 0.56–.075) occupants. If the risk ratio is less than one, the reference group has a lower risk than the comparison. The closer the risk ratio and confidence intervals are to 1, the smaller the difference between the reference and comparison groups. Seat position, BMI and gender did not have a significant influence on the risk of sustaining a facial injury.
Table 3.
Risk ratios by facial fracture for adult occupants in frontal impacts (all p values are < 0.0001).
| Data Segment | Comparison | Risk Ratio | 95% Confidence Interval | |
|---|---|---|---|---|
| All | Belted vs. Unbelted | 0.26 | 0.23 | 0.28 |
| Belted | Airbag vs. No Airbag | 0.51 | 0.43 | 0.59 |
| Unbelted | 0.65 | 0.57 | 0.76 | |
Injury Sources in Frontal Impacts
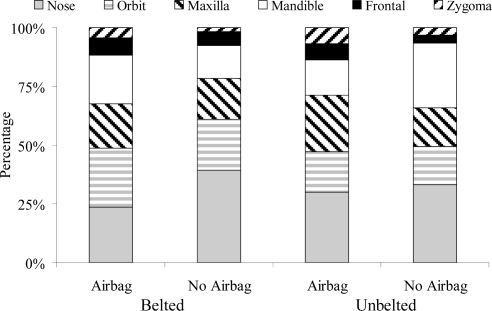
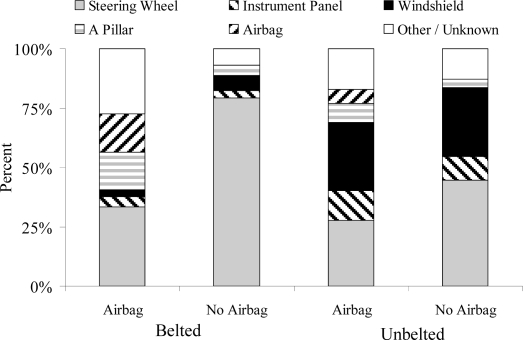
Injury sources were identified for drivers sustaining a facial fracture in frontal impacts (Figure 5). Among belted drivers sustaining a facial fracture that were exposed to an airbag, 7% were defined as having a “same occupant contact” and 4% sustained their facial fracture as a result of contact with the B pillar. Same occupant contact indicates that the injury source was attributed to contact with some part of the occupant incurring the facial fracture.
Figure 5.
Injury sources for drivers in frontal impacts with a facial fracture.
Risk of Facial Fracture in Frontal Impacts
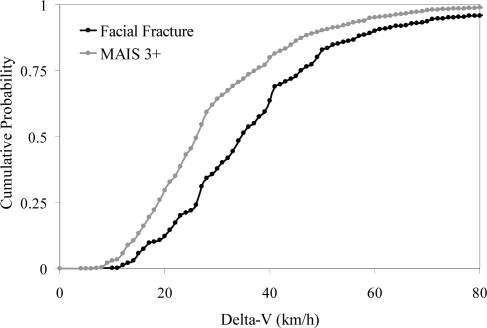
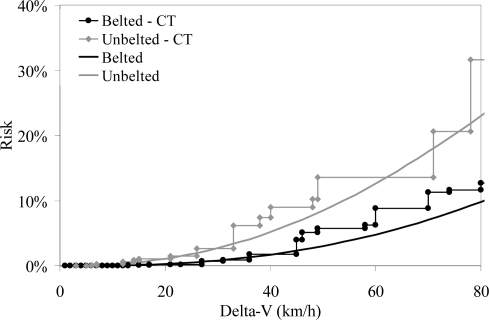
In frontal impacts, approximately 50% of the facial fractures occur at a ΔV less than 35 km/h (Figure 6). This speed is approximately 10 km/h higher than the ΔV at which 50% of the occupants incurred a maximum AIS of 3+, indicating that facial fractures are associated with higher severity crashes than other injuries. Vehicle ΔV was used to predict the risk of facial fracture for belted and unbelted drivers (Figure 7). These risks were generated using the weighted data within the NASS-CDS dataset.
Figure 6.
Cumulative distribution of facial fractures in frontal impacts.
Figure 7.
Risk of facial fracture in frontal impacts generated using CT and Weibull models.
The non-parametric CT method compares well with the parametric method assuming a Weibull distribution. Both models also demonstrate the relative effectiveness of restraint use. The large step size in the CT risks for the unbelted occupants at ΔVs above 50 km/h reflects the decreasing available data.
Side Impacts
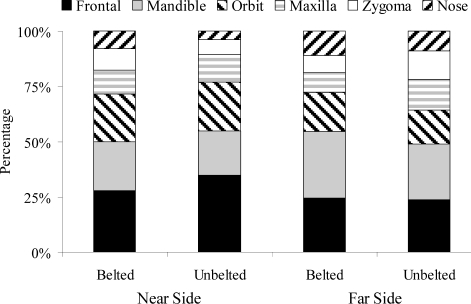
Side impacts were analyzed by dividing them into near (Table 4) and far (Table 5) side categories for outboard occupants in the first and second rows. There was no difference in the risk of minor (AIS 2+) or severe (AIS 3+) facial injury or facial fracture between near and far side occupants. Trends in facial bone fracture were examined by restraint and impact type. Each subset contained between 95 and 120 raw observations (Figure 8).
Table 4:
Summary of counts for occupants in near-side impacts.
| Raw | Weighted | |
|---|---|---|
| Total | 8,629 | 3,713,429 |
| Facial Fractures | 143 | 10,383 |
| Frontal | 17 | 1,724 |
| Nasal | 41 | 4,060 |
| Maxilla | 28 | 1,621 |
| Mandible | 57 | 2,978 |
Table 5:
Summary of counts for occupants in far- side impacts.
| Raw | Weighted | |
|---|---|---|
| Total | 8,104 | 3,417,347 |
| Facial Fractures | 144 | 17,324 |
| Frontal | 29 | 1,358 |
| Nasal | 46 | 11,166 |
| Maxilla | 22 | 1,153 |
| Mandible | 47 | 3,647 |
Figure 8.
Distribution of facial fractures in near and far side impacts.
Only 6% of near side impacts were classified as being equipped with some type of a side airbag. Approximately 50% of these side airbags were classified as being deployed; of these 43% deployed at a ΔV less than 16 km/h, 37% between 16 and 32 and 16% between 32 and 48 km/h. Side airbag deployment did not statistically alter the risk of facial injury or fracture. Belt use was found to play a significant role in reducing the risk of facial injuries and fracture in side impacts (Table 6). Belt use reduced the risk of sustaining a facial fracture by 64% in near side and 73% in far side impacts, both statistically significant (p < 0.0001).
Table 6.
Risk ratios by facial fracture for adult occupants in side impacts (all p values are < 0.0001).
| Data Segment | Comparison | Risk Ratio | 95% Confidence Interval | |
|---|---|---|---|---|
| Near Side | Belted vs. Unbelted | 0.36 | 0.28 | 0.46 |
| Far Side | Belted vs. Unbelted | 0.27 | 0.21 | 0.36 |
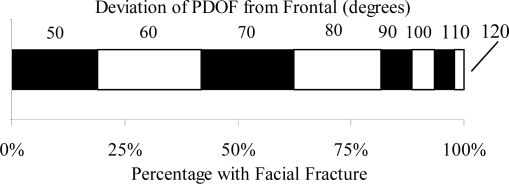
The PDOF associated with facial fractures in side impacts was assessed. Within the vehicles defined as having been involved in a side impact, the majority (81%) of the facial fractures occurred in vehicles that had some frontal component to the PDOF. The majority of facial fractures occurred in vehicles with higher degrees of a frontal component (Figure 9). For example, the vehicles with a PDOF of 50 degrees from frontal accounted for 20% of all facial fractures.
Figure 9.
Distribution of facial fractures in side impacts by PDOF.
Injury Sources in Side Impacts
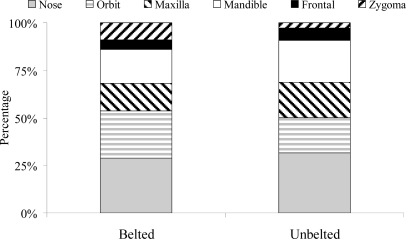
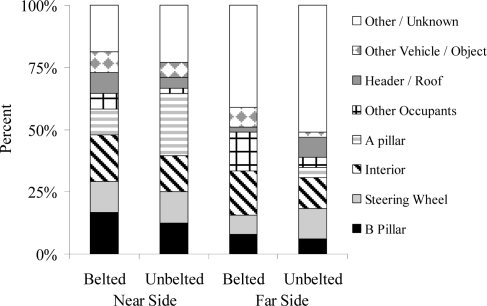
Injury sources were identified for occupants with a facial fracture by impact direction and belt status (Figure 10). For these distributions, contact with the instrument panel and contacts described as “interior” were both included under “interior”. Due to the wide range of injury sources, identification of the six most frequent injury sources did not encompass the majority.
Figure 10.
Injury source for adult occupants sustaining a facial fracture without brain injury in side impacts.
Risk of Facial Fracture in Side Impacts
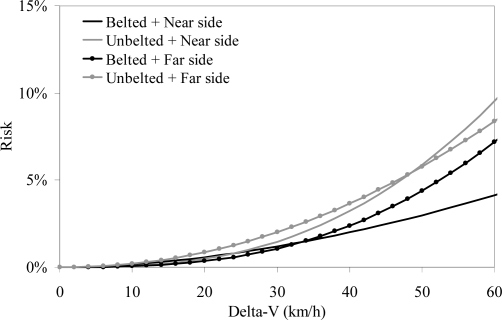
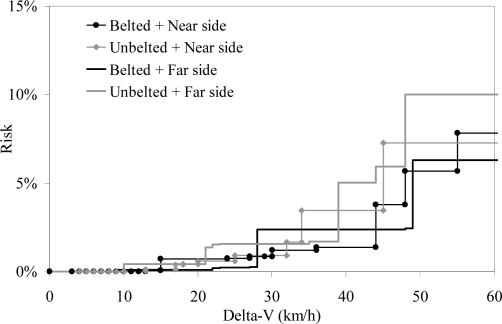
The risk of sustaining a facial fracture as a function of ΔV in near and far-side impacts was evaluated using the NASS-CDS database. The risk of facial fracture by ΔV and impact direction was determined using the raw and weighted data for belted and unbelted occupants. At a ΔV above 64 km/h, the risk estimates produced inconsistent results. For example, the risk to unbelted far side occupants decreased for the raw and weighted groups. As a result, risk curves were generated only using side impacts with a ΔV less than 64 km/h (Figure 11, Figure 12). Good agreement was achieved between the risks estimated using the Weibull and CT methods.
Figure 11.
Risk of facial fracture in side impacts using Weibull model.
Figure 12.
Risk of facial fracture in side impacts using the CT method.
The increasing step size exhibited by the CT method (Figure 12) after a ΔV of 35 km/h results from the decreasing sample size at the higher severity impacts.
DISCUSSION
The results of this study are similar to those of a study utilizing the NASS-CDS database to examine facial fractures in frontal impacts (Cox 2004). The previous study found that seatbelt use had a statistically significant influence on the risk of facial injury and fracture, but an airbag alone did not significantly reduce the risk of facial injury compared to unrestrained occupants. The current study compared the risk of facial fracture for unbelted occupants with and without airbag deployment and found that the airbag statistically reduced the risk of injury. The previous study (Cox 2004) included data up to 2000, while the current study contained NASS data up to 2007. The larger sample of airbag deployments in the current study is likely the major reason for the differences considering that the risk ratios of the previous study were similar in magnitude, but lacked the confidence to be statistically significant.
The results of this study demonstrate the importance of seat belt use in the mitigation of facial injuries. In frontal impacts the exposure to an airbag deployment did decrease the risk of facial injury or fracture, but its influence was greater for belted occupants (Table 3).
There were interesting differences in the distribution of facial fractures between frontal and side impacts. In frontal impacts, the nose was by far the most common bone fractured regardless of restraint use (Figure 3). This is consistent with the fact that the nasal bone is among the weaker structures of the face (Nahum 1975). Despite this, in side impacts the nasal bone was the least common bone fractured, and the frontal bone and mandible were the most frequently fractured bones. The more frequent occurrence of frontal bone fractures in side impacts is not surprising when considering that most side collisions classified as a side impact have a frontal component, as well (Figure 9).
Unbelted occupants most frequently incurred a facial fracture as a result of A-pillar contact in near side impacts and the interior in far-side impacts. The B-pillar was the most common injury source for belted occupants in near side impacts. The prevalence of impacts with a frontal component also explains the effectiveness in belt use (Table 6). The lack of a significant reduction in facial fracture with side airbag exposure may also be related to the frontal component present in the majority of cases. The low percentage (6%) of near side cases with a side airbag also reduces the likelihood of statistical significance.
Problems were encountered when calculating risks with respect to ΔV when raw sample sizes become small. As a result, risks of facial fracture in side impacts were only valid up to 64 km/h. When assessing the risk of an outcome at high ΔVs, one should examine the raw and weighted data to ensure that the weighting factors are creating a distribution that agrees with the raw data. This applies to all cases when the raw numbers are small because the weighting factors are applied to a smaller subset of data. Weight factors also appear to influence the total number of facial fractures for years 2005 and 2006. The raw numbers demonstrate a small increase in 2006, while the weighted counts increased during 2005 and 2006. The source of the increase for 2005 and 2006 is unclear. The average and maximum weight factor for these years was not statistically different than the other years.
A limitation of this study is the missing data associated with the use of ΔV as an injury predictor.
Overall, approximately 30% of the cases in this study did not have a reported ΔV. Within the cases with and without ΔV, the distribution of facial fractures was very similar with respect to the facial bones fractured and the effects of restraint use. Additional limitation results from the low number of cases within the higher ΔVs and within the side impact facial fracture sub groups.
CONCLUSION
This study demonstrates trends in the distribution of facial fractures, their source and association with restraint use in frontal and side impacts. Examining facial fracture incidence in frontal impacts by year demonstrated a decline over the past four years.
Regarding injury sources, the A-pillar was among the most common source for belted occupants exposed to an airbag in frontal impacts and unbelted occupants in near-side impacts. Windshield contact was more prevalent for right front passengers in frontal impacts than drivers. The majority of injury sources for occupants in side impacts were located toward the front of the vehicle. When evaluating the potential for facial fracture, particularly to the frontal bone, it is important to consider impacts not normally defined as frontal.
Facial fractures are more common in impacts with a frontal component and belt use is the most effective way to reduce an occupant’s risk of sustaining a facial fracture. In frontal impacts, airbags are more effective in reducing the risk of sustaining a facial fracture for belted occupants. The risk of sustaining a facial fracture was equal for drivers and right front passengers in frontal and side impacts. Overall, facial fractures are rare and are associated with more severe impacts and lack of restraints.
REFERENCES
- AAAM NASS Injury Coding Manual 1990. Edition (1998 Update), Veridian Engineering, 2000.
- Allison PD. Survival Analysis Using SAS: A Practical Guide. Cary: SAS Press; 1995. [Google Scholar]
- Alvi A, Doherty T, Lewen G. Facial Fractures and Concomitant Injuries in Trauma Patients. The Laryngoscope. 2003;113 doi: 10.1097/00005537-200301000-00019. [DOI] [PubMed] [Google Scholar]
- Arajarvi E, Lindqvist C, Santavirta S, Tolonen J, Kiviluoto O. Maxillofacial trauma in fatally injured victims of motor vehicle accidents. Br J Oral Maxillofac Surg. 1986;24(4):251–7. doi: 10.1016/0266-4356(86)90089-6. [DOI] [PubMed] [Google Scholar]
- Beck RA, Blakeslee DB. The changing picture of facial fractures. 5-Year review. Arch Otolaryngol Head Neck Surg. 1989;115(7):826–9. doi: 10.1001/archotol.1989.01860310064024. [DOI] [PubMed] [Google Scholar]
- Cantor AB. Analysis Techniques for Medical Research. Cary: SAS Press; 2003. [Google Scholar]
- Cox D, Vincent DG, McGwin G, MacLennan PA, Holmes JD, Rue LW., 3rd Effect of restraint systems on maxillofacial injury in frontal motor vehicle collisions. J Oral Maxillofac Surg. 2004;62(5):571–5. doi: 10.1016/j.joms.2003.12.005. [DOI] [PubMed] [Google Scholar]
- Gassner R, Tuli T, Hächl O, Rudisch A, Ulmer H. Cranio-Maxillofacial Trauma: A 10 Year Review of 9543 cases with 21067 Injuries. Cranial and Maxillofacial Surgery. 2003;31:51–61. doi: 10.1016/s1010-5182(02)00168-3. [DOI] [PubMed] [Google Scholar]
- Hackle W, Hausberger K, Sailer R, Ulmer H, Gassner R. Prevalence of Cervical Spine Injuries in Patients with Facial Trauma. Oral and Maxillofacial Surgery. 2001;92(4):370–376. doi: 10.1067/moe.2001.116894. [DOI] [PubMed] [Google Scholar]
- Jayamanne DGR, Gillie RF. Do Patients with Facial Trauma to the Orbito-Zygomatic Region also Sustain Significant Ocular Injuries. Coll Surg Eding. 1996;41:200–3. [PubMed] [Google Scholar]
- Lim LH, Lam LK, Moore MH, Trott JA, David DJ. Associated Injuries in Facial Fractures: A Review of 839 Patients. British J Plast Surg. 1993;46:365–38. doi: 10.1016/0007-1226(93)90191-d. [DOI] [PubMed] [Google Scholar]
- Muraoka M, Nakai Y, Nakagawa K, Yoshioka N, Nakaki Y, Yabe T, Hyodo T, Kamo R, Wakami S. Fifteen – Year Statistics and Observation of Facial Bone Fracture. Osaka City Med. J. 1995;41(2):49–61. [PubMed] [Google Scholar]
- Murphy RX, Birmingham KL, Okunski WJ, Wasser T. The Influence of Airbag and Restraining Devices on the Patterns of Facial Trauma in Motor Vehicle Collisions. Plast Reconstr Surg Vol. 2000;105:516–20. doi: 10.1097/00006534-200002000-00005. [DOI] [PubMed] [Google Scholar]
- Nahum AM. The Biomechanics of Facial Bone Fracture. Laryngoscope. 1975;85(1):140–56. doi: 10.1288/00005537-197501000-00011. [DOI] [PubMed] [Google Scholar]
- NHTSA NASS-CDS Data Collection, Coding, and Editing Manual. NCSA, 1997
- Nusholtz G, Mosier R.Consistent Threshold Estimate for Doubly Censored Biomechanical Data Society of Automotive Engineers Vol. SAE No. 1999-01-0714, 1999
- Shaprio AJ, Johnson RM, Miller SF, McCarthy MC. Facial Fractures in a Level I Trauma Centre: The Importance of Protective Devices and Alcohol Abuse. Injury Int J Care Injured. 2001;32:353–56. doi: 10.1016/s0020-1383(00)00245-x. [DOI] [PubMed] [Google Scholar]
- Vetter JD, Topazian RG, Goldberg MH, Smith DG. Facial fractures occurring in a medium-sized metropolitan area: recent trends. Int J Oral Maxillofac Surg. 1991;20(4):214–6. doi: 10.1016/s0901-5027(05)80177-8. [DOI] [PubMed] [Google Scholar]
- Worrall SF. Mechanisms, pattern and treatment costs of maxillofacial injuries. Injury. 1991;22(1):25–8. doi: 10.1016/0020-1383(91)90155-8. [DOI] [PubMed] [Google Scholar]
- Yoganandan N, Fintar F, Sances A, Myklebust J, Schmaltz D.Steering Wheel Induced Facial Trauma Proceedings of the 32nd Stapp Car Crash Conference Vol. SAE No. 881712, 1988


