Abstract
In a far-side crash configuration, the occupant can experience severe excursion from the seat space. Given this challenge, there are research efforts focused on alternate restraints, such as four-point belts. A potential implication of this geometry would be interaction of the belt with the occupant’s neck. This study examines the response of the carotid arteries using a Finite Element Model (FEM) in a far-side crash configuration with a reversed three-point restraint. A FEM of the carotid artery and neck fascia was developed and integrated with the Total Human Model for Safety (THUMS) version 1.44. This model was subjected to four test conditions simulating far-side crashes. Load conditions included a low velocity impact of approximately 4 m/s and a higher velocity impact of approximately 10 m/s. For each velocity, the model was restrained with a belt placed low on the neck and a belt placed higher on the neck. Strain data in each element of the carotid arteries was analyzed. The overall response of the vessel was examined to determine locations of high strain values. Low belt placement resulted in more head excursion, stretching the carotid on the non-struck side. High belt placement resulted in compression of the artery on the struck side due to direct loading of the vessel from the belt. Strain values in the carotid artery elements increased with increasing speed of impact. The lower and higher speed tests with a low belt configuration resulted in a maximum principal strains, at maximal belt engagement, of 0.223 and 0.459, respectively. Corresponding values for the high belt configuration were 0.222 and 0.563. In both belt configurations, the non-struck side vessel stretched more than the struck side vessel; however, the non-struck side vessel experienced higher compressive forces. Strain values measured during the simulations can be compared to a value of 0.31 to intimal failure in previous experimental tests. These results quantitatively illustrate the two primary mechanisms of injury to the carotid artery: tension and intima-to-intima contact of the vessel. Based on the study, low belt placement and limiting head excursion is recommended to reduce both stretching and compression of the carotids in side impact.
INTRODUCTION
In a far-side crash, a three-point belt configuration is not always effective in restraining the occupant’s upper torso. This belt design can allow the upper torso to slip from under the restraint and the occupant can experience excursion into adjacent occupant spaces (Fildes et al., 2003). Possible countermeasures for this problem are four-point belts or three-point belts with additional two-point belts. The advantage of these configurations is to limit occupant excursion (Bostrom and Haland 2003). A potential harmful effect of these belt configurations is interaction between the belt and the neck, creating the potential for carotid artery injury.
Blunt carotid or vertebral artery injury, also known as blunt cerebrovascular injury (BCVI), is a rare but potentially fatal injury that can occur as a result of a motor vehicle crash (MVC). Approximately 1% of trauma admissions with blunt head and neck trauma are diagnosed with BCVI; however, more aggressive screening techniques can increase the number of patients identified with this injury (Biffl et al., 2001; Miller et al., 2001; Miller et al., 2002).
The literature describes two primary mechanisms of injury for this vessel: tension and pinching. In tension, the vessel is stretched until a component of the vessel fails. This failure can be in the intimal layer, resulting in a dissection injury, or a medial or advential failure, which can result in rapid blood loss (Fabian et al., 1990; Fabian et al., 1996; Martin et al., 1991; Sinson et al., 2003). The pinching mechanism of injury occurs when the vessel is compressed until there is intima-to-intima contact. This contact can result in intimal disruption and potential carotid artery dissection (Rozycki et al., 2002).
Injury to the vessels can be particularly hard to detect after a dissection of the intimal layer of the artery. Given this injury mechanism, the patient can be asymptomatic until the expanding hematoma has sufficiently occluded the lumen of the vessel or a portion of the hematoma has become dislodged and blocked a smaller vessel. This occult injury can be undiagnosed or diagnosed only after significant complications have occurred (Miller et al., 2002; Sinson et al., 2003).
The purpose of this study was to examine how the vessels of the neck were affected by a blunt seatbelt loading scenario. The vessel is strongly tethered in the thorax and the head. In contrast, the middle of the vessel can freely move with the fascia of the neck. Injuries most commonly occur in the neck because there is minimal carotid tethering in the neck, and relative protection of the vessel in the thorax and head. Given this common injury location, this model will elucidate how the location of carotid artery injury on the vessel changes given a change in the location of neck loading by the seatbelt.
METHODS
This study integrates a Finite Element Model (FEM) of the carotid artery model into an existing total body FEM. This integrated model was then subjected to a far-side loading configuration to determine possible interactions between the neck fascia, the carotid arteries, and an inboard belt configuration. The carotid artery model was evaluated for overall response to the impact as well as strain information from the elements that composed the model.
Model configuration
The computer simulations were performed using LS-DYNA version 971 (LSTC, Livermore, CA), double precision. All simulations were completed on a high performance computing cluster with four CPUs allocated per simulation.
The base model for this modeling effort is THUMS version 1.44 (Iwamoto et al., 2002). This model was used as the base because it has already been validated in frontal and side impact scenarios and demonstrates a biofidelic total body response. Using the THUMS, a regional model of the neck fascia and carotid artery was substituted in the place of the existing THUMS neck fascia. The response of the THUMS head is controlled by beam elements representing the major muscle groups in that region and the spine components. Neither of these mechanisms for head control were changed with the addition of the new neck fascia.
The carotid artery model used in the regional neck model was previously created and validated against experimental data. The geometry of the artery was obtained from a computed tomography (CT) scan of a 57-year-old male. The geometry was then meshed using parametric elements in order to simplify density changes (Gayzik et al., 2006a). The material properties used in the finite element modeling process were derived from a paired organ level experimental test to a FEM simulated test. This test utilized a fluid filled section of carotid artery subjected to a blunt impactor (Gayzik et al., 2006b). From these matched experimental and computational tests, Gayzik et al. (2006b) developed a material model of the tissue.
The carotid artery material model described above has several specific characteristics that allow it to behave in a biofidelic manner. The material type is a simplified rubber model, the LS-DYNA material type is *MAT_181 or *MAT_SIMPLIFIED_RUBBER. This material is a rubber model defined by a single axis load curve which defines the force versus the change in specimen length. Additionally, the mass density, linear bulk modulus, damping coefficient, and shear modulus must be defined (LSTC 2003). These coefficients were determined by Gayzik et al. (2006b) through parameter studies comparing the model results to the experimental results of the organ level testing with values of: density = 1.00×10⁻³ g/mm3, bulk modulus = 2.71×10³ N/mm2, and shear modulus = 5.20 N/mm2.
The replacement neck fascia model used has geometry that is similar to the existing THUMS neck fascia. This geometry was created to facilitate integration of the carotid model within the total body model and to maintain the proper shape of the neck at the interface between the neck and the shoulder. A significant change in this interface would affect the interaction between the belt and the neck and shoulder; therefore, the outer skin geometry was maintained. The material model used in the neck was slightly different from the original THUMS model. The material was changed from a *MAT_VISCOELASTIC to *MAT_ELASTIC model for stability. The values for material properties were chosen to replicate the material properties of general muscle (Duck 1991).
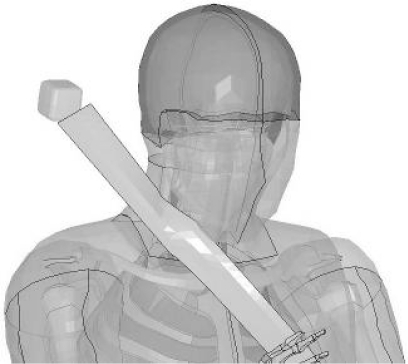
The final step in preparing this model for simulations was integrating the neck, carotid and THUMS models. The carotid and neck models were coupled through the use of shared nodes between the neck fascia and the carotid. A contact was added so the carotid could not penetrate itself during pinching. In LS-DYNA, this contact was defined as a single surface contact (*CONTACT_SINGLE_SURFACE). Once the carotid arteries were coupled to the neck, the neck was coupled to the THUMS model. Figure 1 illustrates the new neck fascia, carotid artery and existing THUMS head and shoulder geometry.
Figure 1:
Carotid neck model integrated with the existing THUMS neck model.
The first step in adding the new neck fascia was removing the existing neck fascia from THUMS. The new neck was placed and coincident nodes were combined. To prevent gaps from forming at the head-neck and neck-shoulder interface, a tied contact was defined on the interfacing surfaces of the two components using *CONTACT_TIED_SURFACE_ TO_SURFACE, with segment sets to define the surfaces. Additionally a contact was defined between the vertebral bodies and the inner aspect of the neck fascia to prevent vertebral body penetration of the neck fascia using the keyword *CONTACT_ AUTOMATIC_SURFACE_TO_SURFACE. This contact was defined through a segment set on the inner surface of the neck and a segment set on the outer surface of the vertebral bodies. Once these changes were complete, the model was used to simulate several loading scenarios.
Loading Scenarios
The boundary conditions for the simulations were obtained from Post-Mortem Human Subject (PMHS) testing conducted at the Medical College of Wisconsin (Pintar et al., 2007). Table 1 is the test matrix describing the four loading conditions simulated with the model with descriptions of the belt positions and delta-V. During this testing, six subjects were placed in a variety of testing configurations. The two subjects the test matrix describes are PMHS three and PMHS four. PMHS three was placed in four low belt loading conditions: low and high speeds with an inboard and outboard belt. PMHS four was subjected to the same four configurations except a high belt load was used.
Table 1:
Test matrix for the simulations.
| PMHS Test No. | Belt Position | Delta-V |
|---|---|---|
| 134 | Low | Low (∼4 m/s) |
| 135 | Low | High (∼10 m/s) |
| 140 | High | Low (∼4 m/s) |
| 141 | High | High (∼10 m/s) |
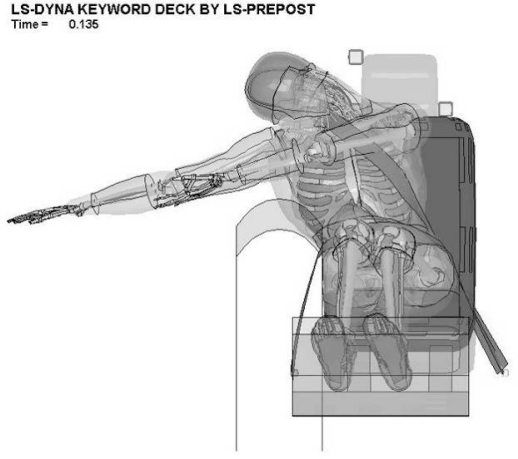
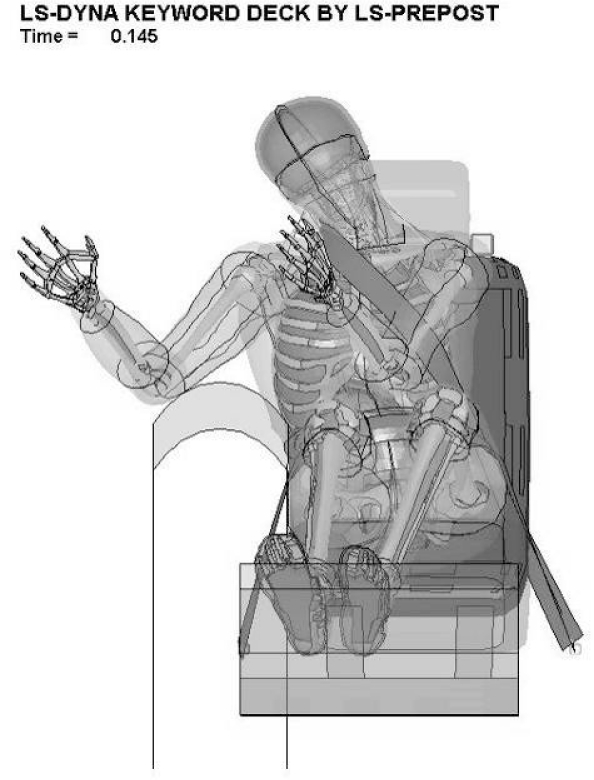
The low delta-V configuration represents a sled velocity change of approximately 4 m/s over 70 ms. The high delta-V represents approximately 10 m/s over 130 ms. All simulations were conducted for 150 ms. The low belt position was an initial orientation of an inboard shoulder belt placed on the shoulder of the PMHS. The high belt position was achieved by placing the belt directly across the neck of the occupant prior to the start of the test. Figure 2 and Figure 3 illustrate these belt positions on the THUMS model.
Figure 2:
Low belt configuration on the THUMS integrated model.
Figure 3:
High belt configuration on the THUMS integrated model.
The last step in the preparation of the model for these simulations was placing the integrated model into a configuration that was representative of the test sled used by MCW. On the MCW test sled, there was a plate to restrain the pelvis as well as a lower plate to restrain the lower leg. The PMHS torso was restrained using a belt configuration with adjustable shoulder height positions. The belts were fitted to the FE model using measurements from the experimental tests. The different delta-V conditions were applied to the test sled model as an acceleration applied to the seat. The seat and the paneling were constrained to move together throughout the simulation.
For comparison with our modeling results, the injury results of the experimental testing included a left external carotid intimal tear in PMHS Four. Since this subject was subjected to four tests before injury assessment was complete, the test that caused the injury is unknown. Pintar et al. (2007) postulated this intimal tear was due to loading from the inboard high belt, the configuration tested in the current study, due to stretching of the vessel on the contralateral side. Additionally, there were abrasions and contusions on the right neck from contact with the high belt. From the modeling effort, the comparisons were made with strain values for the carotid artery elements. These were written as part of the output and used in the model analysis step.
Data Analysis
To determine the severity of the insult and the possible mechanism of injury to the vessel, the responses of the model in each loading scenario were qualitatively examined. Strain values experienced during the simulation were queried for a quantitative assessment of potential injury. To minimize the possibility of accentuating one element with unrealistically high strains because of short-duration numerical noise, this value was the average of elements in a high strain area. The first step in this analysis was determining the time at which the highest strain in any element was experienced during the simulation. This element was identified and all elements contacting its edge or corner, for a total of eight or nine surrounding elements, were selected. Strain time histories for each of these elements were filtered to CFC 600, and then the strain time histories were averaged. These steps were completed using the post-processing tools available in LS-Prepost (LSTC, Livermore, CA).
Another aspect of this study was to determine the time of maximal bending in the neck, maximal compression of the neck fascia, and maximal strain in the vessel. The time of maximum engagement with the belt occurred when the neck reached the point of maximum lateral bending. Since this neck angle was maintained for several time steps, it was the first time step in this configuration. The maximal compression of the neck was measured between two nodes on the neck fascia. The first node was on the side of the neck that interacted with the seatbelt and the second node was on the interior aspect of the neck that interacted with the spinal column. The maximum strain during the simulation was identified using a plot of all of the strain time histories for all of the carotid artery elements. For each simulation, there was a clear maximum element that could be easily identified. It was postulated that these factors were related; therefore, they would all occur at a similar time during the simulation. Based on this hypothesis, the time of the maximal instance and corresponding maximum strain value was found and compared across simulations.
RESULTS
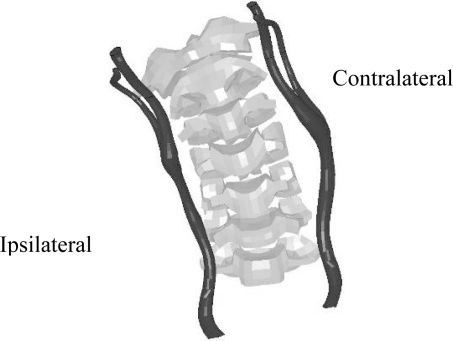
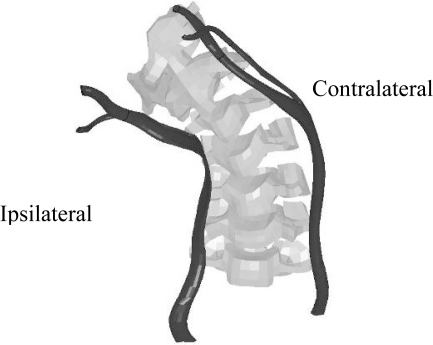
The resulting neck model illustrated several trends in the response of the carotid artery under lateral impact with variable speeds and belt positions. The primary trend seen in the results was compression of the vessel underneath the belt, the ipsilateral vessel, and stretching of the vessel opposite the belt, the contralateral side. Another trend in the data was that as the speed of impact was increased, the extension of the vessel also increased. Finally, the location of the pinching of the vessel was directly related to the placement of the belt. The high belt configurations had a pinching of the vessel at an area around the junction of C3 and C4. In contrast, the vessel was pinched at the level of C4 and C5 for the low belt configurations. The amount the vessel was compressed increased with increasing speed. These general vessel responses can be seen in Figure 4 to Figure 7, which illustrates the carotid geometry at the time of maximum engagement with the belt system.
Figure 4:
Isolated carotid artery and spinal column, low belt and low delta-V.
Figure 7:
Isolated carotid artery and spinal column, high belt and high delta-V.
As discussed previously, there were three time points of interest where these strain values were investigated: time of maximum strain, time of maximum belt engagement, and time of maximum neck compression. The first metric examined was the maximum strain experienced by any element during the simulation. In Table 2, these values and the corresponding times of maximal strain are listed under the “maximum strain” heading. All of the maximal strain values occurred in the carotid artery on the belt engagement side of the neck. The time of maximum strain during the simulation was lower for higher impact speeds. Additionally, the time of maximum strain occurred later in the simulation for the low belt configurations than the high belt configurations. The maximum strain values showed a greater dependence on speed of the impact than on belt configuration. For all metrics, the location of the highest strains were consistent across simulations. The high strain was located at the carotid bifurcation in the inferior portion of the external carotid artery branch.
Table 2:
Listing of strain values and time of maximum strain for the three times of interest.
| Maximum Strain | Maximum Belt Engagement | Maximum Neck Compression | ||||
|---|---|---|---|---|---|---|
| Load Case | Time (sec) | Strain (unitless) / Location | Time (sec) | Strain (unitless) / Location | Time (sec) | Strain (unitless) / Location |
| Low Belt, Low Delta-V | 0.146 | 0.226 / Ipsilateral | 0.135 | 0.223 / Ipsilateral | 0.120 | 0.206 / Ipsilateral |
| Low Belt, High Delta-V | 0.143 | 0.551 / Ipsilateral | 0.120 | 0.459 / Contralateral | 0.135 | 0.434 / Ipsilateral |
| High Belt, Low Delta-V | 0.069 | 0.252 / Ipsilateral | 0.120 | 0.222 / Ipsilateral | 0.115 | 0.232 / Ipsilateral |
| High Belt, High Delta-V | 0.066 | 0.930 / Ipsilateral | 0.130 | 0.563 / Ipsilateral | 0.065 | 0.909 / Ipsilateral |
The next time point of interest for strain comparison was the time of maximal belt engagement. The results for this comparison are in Table 2, under the “maximum belt engagement” heading. Additionally, for a qualitative comparison, simulation screen captures of the model at the time of maximal belt engagement are included in Appendix 1. It was postulated that this time point would be at a similar time to the maximum strain value time described above. Instead, these results indicate that the time of maximal belt engagement occurs earlier in the simulation for the low belt configurations and a later for the high belt simulations. The time for both the high and low speed tests does not show the differentiation between the scenarios as in the case of maximum strain. Instead, the values are approximately the same for each scenario. The strain values at the time of maximum belt engagement increased with increasing speed and are larger for the high belt configurations than the low belt. This metric captured the only instance of a maximum strain in an element on the contralateral side of the neck. This contralateral maximum was for the low belt and high delta-V scenario. Also, this case had the largest extension of the spine and the contralateral carotid artery.
The next metric that was compared for the simulations was the time of maximum neck compression and the resulting maximum strains at this time. The results for this comparison are in Table 2, under the “maximum neck compression” heading. It was postulated that this time would correlate to the maximum strain value for the simulation as a whole. For the high delta-V cases, the time of maximum compression and the resulting strains were similar. However, for the low delta-V cases, there was no correlation between the time of maximum strain and the time of maximum neck compression. The strain values followed the same trends seen in the other two metrics. Specifically, a high delta-V resulted in a higher maximum strain value.
The values reported to this point are only the peak values for each configuration. There was a wide range of values for each test and the majority of the elements in the carotid, on both sides of the neck, did not achieve strain values close to these maximum recorded strains. To contrast these values with the peak values described above, Table 3 displays a range of these unfiltered strain values. Some of these values are higher than the strain values listed above due to the averaging and filtering steps used for the maximum strain values in Table 2. For the values in Table 3, the top end of the range represents the point beyond which there are only isolated elements that exceed that strain value. The bottom end of the range is the point at which approximately half of the elements are below that strain value.
Table 3:
Maximum principal strain ranges.
| Belt Position | Delta-V | Maximum Principal Strain |
|---|---|---|
| Low | Low | 0.125–0.225 |
| Low | High | 0.250–0.400 |
| High | Low | 0.200–0.300 |
| High | High | 0.400–0.600 |
DISCUSSION
The overall response of the model demonstrated a tension force in the vessel on the contralateral side of the neck with respect to the loading belt. Sufficient strain on the contralateral side could result in injury to vessel layers. The ipsilateral side of the neck demonstrated the pinching mechanism of injury to the vessel. For the high belt configuration, the vessel was severely compressed. A possible result of this type of compression is intima-to-intima contact, which can result in carotid artery dissection initiated by the intimal damage caused by this contact.
One of the purposes of this study was to elucidate the relationship between the location of the insult and the location of the high strain in the vessel. Our results demonstrate that the areas of highest compression were adjacent to the belt impact location. On the opposite side, there was a fairly even distribution of the strain in the vessels with some concentrations around the geometry of the bifurcation. Further investigation into these localized areas of high strain is needed to determine if these are a real effect or an artifact of the geometry and element construction of the model.
Based on Stemper et al. (2005), the engineering strain to failure for the intima is 0.36 and to total vessel failure is approximately 0.60. In Stemper’s study, the human carotid arteries were harvested from previously frozen PMHS. The vessels were cut into I-shaped samples for placement in an electrohydraulic testing device. In the device, they were stretched until catastrophic vessel failure. To directly compare our results with the results from Stemper et al. (2005), we had to convert their engineering strain values to true strain values. The converted strain to intimal failure is 0.31 and to ultimate failure it is 0.47. Based on these values, at least one element in both high delta-V cases exceeded the limit for intimal failure.
The strain values calculated for the high belt and high delta-V case were significantly higher than the experimental values reported by Stemper et al. (2005). This discrepancy is most likely caused by some of the simplifying assumptions used to create the model. Future iterations of the model that address the limitations of the model listed below would result in better agreement between the strain values. However, these strain values allow for a comparison of the differences in the model response given changes in the belt location and the delta-V of the test. The model response demonstrated the same trends as the MCW PMHS testing with the more severe cases resulting in higher strain values.
Another similarity between our results and the MCW results was the location of the intimal tear in the external carotid artery. This was the common location for high strain concentrations in our simulations.
Another result from this study was the relationship between time of maximal compression of the neck fascia, lateral bending of the neck, and strain in the vessel. The general trend was that the maximum strains in the vessel lagged the maximum compression of the neck. Additionally, the model response demonstrated that the maximal engagement of the belt, as measured by the lateral bending of the head, did not correlate to the time of maximal neck compression. In three of the four cases, the maximal engagement lagged the maximum neck compression. Additionally, in three of the four cases, the maximum strain in the vessel lagged the maximal belt engagement. These trends can be explained by the loading characteristics of the model. The neck could be completely compressed, yet the belt could still be exerting force on the neck. This force would continue to be transmitted through the compressed neck fascia to interact with the spinal column and affect the response of the head.
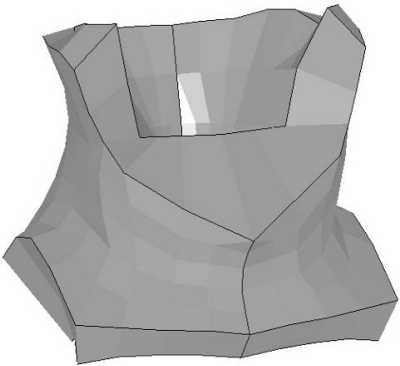
One of the limitations of the current model is the interface between the head structure of the THUMS and the fascia created. The new neck geometry has a level surface on the superior aspect to allow the carotid artery to travel throughout the full neck, as shown in Figure 8. In contrast, the THUMS model has an indentation in the front where the neck joins to the face, as shown in Figure 9.
Figure 8:
Modified carotid neck fascia.
Figure 9:
Original THUMS neck fascia.
The new neck geometry did not have this indentation in the anterior aspect of the neck. Instead, the fascia continued along the contour of the neck to the base of the head. This difference in geometry resulted in unrealistic response of the outer and upper neck fascia elements; however, the carotid arteries were not affected. In future versions of the model, the two fascia geometries could be combined in a different manner to maximize length of the carotid artery and interface with the THUMS head in a more natural manner.
Another limitation of the current model is there is no fluid in the lumen of the vessel. This simplification was implemented in this version of the model since it was hypothesized that the response of the vessel would be most dependent on the movement of the fascia with minimal resistance from the fluid in the vessel. Future versions of the model could include fluid to fully capture the pressure effects of the compressed fluid in the vessel. Because of the pinching mechanism, an Arbitrary Lagrange Eulerian (ALE) or mesh-free approach must be utilized to model the fluid, an effort beyond the scope of the current study.
CONCLUSION
To determine the possible effect of alternate restraint styles in a far-side crash configuration, a regional model of the neck and carotid artery was created. This model computed the strain in the carotid arteries given a range of impact severities and seatbelt configurations. The model illustrated that an increase in the delta-V of the simulation increased the strain in the vessel. The placement of the belt affected the model response in two ways. The first effect was in the qualitative response of the vessel. The low belt allowed for greater extension of the neck and more stretching of the contralateral vessel, with respect to the belt. The second effect was the high belt increased the strain value computed in the elements of the ipsilateral vessel. Based on these results, low belt placement and limiting head excursion are recommended.
Figure 5:
Isolated carotid artery and spinal column, low belt and high delta-V.
Figure 6:
Isolated carotid artery and spinal column, high belt and low delta-V.
Acknowledgments
The authors would like to acknowledge Dr. Brian Stemper, Dr. Frank Pintar, and Josh Tan for their assistance. The funding for this research has been provided in part by an Australian Research Council linkage grant and by private parties, who have selected Dr. Kennerly Digges and FHWA/NHTSA National Crash Analysis Center at the George Washington University to be an independent solicitor of and funder for research in motor vehicle safety, and to be one of the peer reviewers for the research projects and reports.
APPENDIX:
Illustrations of maximal engagement of the model with the belt for each simulation.
Figure A1:
Time of maximal belt engagement for the low delta-V, low belt configuration.
Figure A2:
Time of maximal belt engagement for the high delta-V, low belt configuration.
Figure A3:
Time of maximal belt engagement for the low delta-V, high belt configuration.
Figure A4:
Time of maximal belt engagement for the high delta-V, high belt configuration.
REFERENCES
- Biffl WL, Moore EE, Offner PJ, Burch JM. Blunt carotid and vertebral arterial injuries. World J Surg. 2001;25:1036–1043. doi: 10.1007/s00268-001-0056-x. [DOI] [PubMed] [Google Scholar]
- Bostrom O, Haland Y. Benefits of a 3+2 point belt system and an inboard torso side support in frontal, far-side and rollover crashes. 18th Enhanced Safety of Vehicles. 2003 [Google Scholar]
- Duck FA. Physical Properties of Tissue, A comprehensive reference book. London: Academic Press; 1991. [Google Scholar]
- Fabian TC, George SM, Croce MA, Mangiante EC, Voeller GR, Kudsk KA.Carotid artery trauma: management based on mechanism of injury J Trauma 30953–961.; discussion 961–953.1990 [DOI] [PubMed] [Google Scholar]
- Fabian TC, Patton JH, Croce MA, Minard G, Kudsk KA, Pritchard FE.Blunt carotid injury. Importance of early diagnosis and anticoagulant therapy Ann Surg 223513–522.; discussion 522–515.1996 [DOI] [PMC free article] [PubMed] [Google Scholar]
- Fildes BN, Bostrom O, Haland Y, Sparke L. Countermeasures to address farside crashes: First results. 18th Enhanced Safety of Vehicles. 2003 [Google Scholar]
- Gayzik FS, Tan J, Duma S, Stitzel JD. Mesh development for a finite element model of the carotid artery. Biomedical Sciences Instrumentation. 2006a;43:187–192. [PubMed] [Google Scholar]
- Gayzik FS, Bostrom O, Ortenwall P, Duma SM, Stitzel JD. An experimental and computational study of blunt carotid artery injury. Annu Proc Assoc Adv Automot Med. 2006b;50:13–32. [PMC free article] [PubMed] [Google Scholar]
- Iwamoto M, Kisanuki Y, Wantanabe I, Furusu K, Miki K, Hasegawa J. Development of a Finite Element Model of the Total Human Model for Safety (THUMS) and Application to Injury Reconstruction. IRCOBI Conference. 2002 [Google Scholar]
- LSTC LS-Dyna Keyword User’s Manual. Livermore Software Technology Corporation, v. 970, 2003
- Martin RF, Eldrup-Jorgensen J, Clark DE, Bredenberg CE.Blunt trauma to the carotid arteries J Vasc Surg 14789–793.; discussion 793–785.1991 [DOI] [PubMed] [Google Scholar]
- Miller PR, Fabian TC, Bee TK, Timmons S, Chamsuddin A, Finkle R, Croce MA.Blunt cerebrovascular injuries: diagnosis and treatment J Trauma 51279–285.; discussion 285–276.2001 [DOI] [PubMed] [Google Scholar]
- Miller PR, Fabian TC, Croce MA, Cagiannos C, Williams JS, Vang M, Qaisi WG, Felker RE, Timmons SD.Prospective screening for blunt cerebrovascular injuries: analysis of diagnostic modalities and outcomes Ann Surg 236386–393.; discussion 393–385.2002 [DOI] [PMC free article] [PubMed] [Google Scholar]
- Pintar FA, Yoganandan N, Stemper BD, Bostrom O, Rouhana SW, Digges KH, Fildes BN. Comparison of PMHS, WorldSID, and THOR-NT responses in simulated far-side impact. Stapp Car Crash J. 2007;51:313–360. doi: 10.4271/2007-22-0014. [DOI] [PubMed] [Google Scholar]
- Rozycki GS, Tremblay L, Feliciano DV, et al. A prospective study for the detection of vascular injury in adult and pediatric patients with cervicothoracic seat belt signs J Trauma 52618–623.; discussion 623–614.2002 [DOI] [PubMed] [Google Scholar]
- Sinson GP, Yoganandan N, Pintar FA, Morgan RM, Maiman DJ, Brasel KJ, Gennarelli TA. Carotid artery trauma in motor vehicle crashes: Investigation of the local tensile mechanism. IRCOBI Conference. 2003:207–216. [Google Scholar]
- Stemper BD, Stineman MR, Yoganandan N, Pintar FA, Sinson GP, Gennarelli TA. Mechanical Characterization of Internal Layer Failure in the Human Carotid Artery. IRCOBI Conference. 2005:269–277. [Google Scholar]


