Abstract
Crash protection for an aging population is one of the primary drivers of contemporary passive safety research, yet estimates of the potential benefit of age-optimized systems have not been reported. This study estimates the number killed and injured in traffic crashes due to the age-related reduction in tolerance to loading. A risk-saturation model is developed and calibrated using 2000–2007 data for the age distribution of crash-involved adult occupants and drivers and the number of those injured and killed in 2006. Nonlinear functions describing the relationships between age and risk, adjusted for several confounders are developed using 10 years of NASS-CDS data and considered along with published risk functions for both mortality and injury. The numbers killed and injured as a result of age-related fragility and frailty are determined by setting the risk at all ages equal to the risk at age 20 (i.e., risk is assumed to “saturate” at age 20). The analysis shows that risk saturation at age 20 corresponds to 7,805–14,939 fewer driver deaths and 10,989–21,132 fewer deaths to all occupants. Furthermore, 1.13–1.32 million fewer occupants would be injured (0.80–0.93 million fewer drivers) per year. In other words, that number of deaths and injuries can be attributed to age-related reductions in loading tolerance. As the age of risk saturation increases, the benefit decreases, but remains substantial even in the age regime typically considered “elderly”. For example, risk saturation at age 60 corresponds to 1,011–3,577 fewer deaths and 73,537–179,396 fewer injured occupants per year. The benefit of risk saturation is nearly log-linear up to approximately age 70, but drops off quickly thereafter due to the low exposures in the oldest age range. The key contribution of this study is the quantification of deaths and injuries that can be attributed to aging and the development of functions describing the relationship between age of risk saturation and the number of deaths and injuries averted.
INTRODUCTION
An increase in mean population age has been well documented for many developed nations, including the United States. By 2030, 25% of the U.S. population will be age 65 or older (OECD 2001) and the average age of the U.S. population is projected to increase through 2100 (2000 U.S. Census). People are also tending to drive later in life. Protecting an older occupant in a collision presents a unique set of challenges. It is well documented that, in general, older people are more susceptible to injury than younger, and that the morbidity, mortality, and treatment costs for a given injury are higher (e.g., Martinez et al. 1994, Miltner and Salwender 1995, Peek-Asa et al. 1998, Miller et al. 1998, Bulger et al. 2000, Evans 2001). Motivated by these changing demographics and by the particular challenge of protecting an older and more frail occupant, crash protection for an aging population is one of the primary drivers of contemporary passive safety research (e.g., Rouhana et al. 2003, Bostrom and Haland 2003, Forman et al. 2006). Despite this focus, estimates of the potential benefit of age-optimized systems have not been reported. The purpose of this study is to estimate the number of automotive deaths and injured occupants in the U.S. that can be attributed to the well-documented age-related reduction in tolerance to loading and thus quantify an upper limit on the benefits that can be realized by safety systems optimized for older occupants.
Fragility, Frailty, and Environment as Independent Aspects of Aging
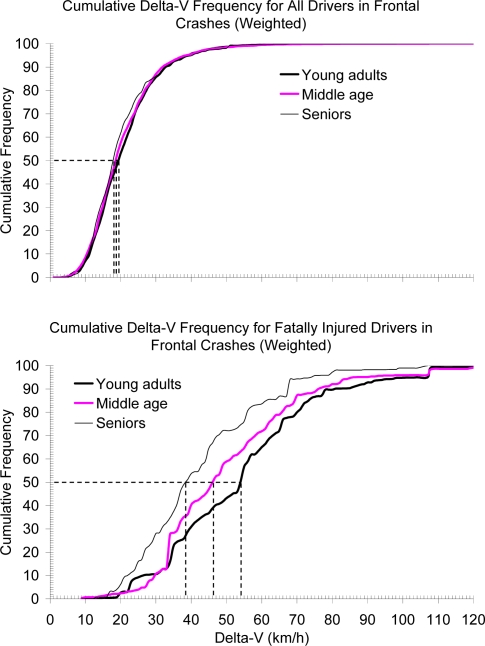
Older occupants differ in several respects from young or even middle-aged occupants in terms of both crash exposure and outcomes (see e.g., Islam and Mannering 2006). Morris et al. (2002, 2003) and Kent et al. (2005) identified several characteristics of older-driver crashes in the United Kingdom and in the United States, including their tendency to sustain greater injury for a given crash severity, and for chest injuries to be disproportionately important for older drivers. These macro-scale differences in population outcomes reflect independent aspect of aging. First, older people are more fragile than younger: they tend to sustain a greater level of injury for a given magnitude of loading. This is reflected, for example, in a higher probability of injury at a given AIS level for a specified crash condition (delta-V, restraint use, etc.). Second, older people are more frail than younger: they tend to have worse outcomes for the same injury. Both fragility and frailty contribute, for example, to the age-related shift in delta-V distribution in fatal frontal crashes (Figure 1, Kent et al. 2005). Finally, older people have different exposure patterns than younger. For example, NHTSA (Cerelli 1998) found that older drivers have slightly higher belt usage than younger and Viano and Ridella (1996) concluded that older drivers are over-represented in lateral impacts at intersections.
Figure 1.
Cumulative delta-V distribution of all drivers (top) and of fatally injured drivers (bottom) in frontal crashes (Kent et al. 2005).
All of these aspects (fragility, frailty, and environment) are important to consider as the population ages and remains mobile later in life. This paper attempts to quantify the number of deaths and injuries that can be attributed to increased fragility and frailty of older people involved in crashes. A risk-saturation model is developed and calibrated using 2000–2007 data for the age distribution of crash-involved adult occupants and drivers and the number of those injured and killed. Nonlinear functions describing the distribution of risk by age, adjusted for several confounders are developed using 10 years of NASS-CDS data and considered along with published risk distributions for both mortality and injury. The relationship between the assumed age of risk saturation and the number of deaths and injuries averted is then determined to quantify potential gains for safety countermeasures targeted at certain age groups.
METHODS
Governing Equations
The number of people who die or sustain an injury in crashes each year, N, can be described as a sum over two distributions:
| [1] |
Where R̂ is the risk distribution by age and Ê is the crash exposure distribution by age. Recognizing that
| [2] |
where R̂rel is the relative risk distribution by age and R20 is the absolute risk at age 20, and that
| [3] |
where P̂ is the proportional age distribution of crash-involved people and E is the total number of people exposed to a crash, the following equation can be written:
| [4] |
Determination of Exposures, Outcomes, and Age Distributions
Drivers and all occupants (including drivers) were considered separately. For this study, exposure and outcome data for calendar year 2006 were used. The values shown in Table 1 were used for N and E. The number of drivers in all crashes was taken from Traffic Safety Facts (2006) less 1% to remove motorcycle drivers from the total. An analogous figure for all occupants is not published, so it was estimated from the ratio of drivers to all occupants in the tow-away crashes sampled in 2006 for the NASS-CDS database (ratio = 1/1.301, weighted).
Table 1.
Estimates of N and E in the United States, Calendar Year 2006
| Number in crashes, E | Number killed, N | Number injured, N | |
|---|---|---|---|
| Drivers | 10.452 million1 | 22,8302 | 1.666 million2 |
| All occupants | 13.599 million3 | 32,0922 | 2.375 million2 |
Table 63 in Traffic Safety Facts (2006) less 1% for motorcycle drivers
Table 53 in Traffic Safety Facts (2006)
Number of drivers multiplied by 1.301 (see text)
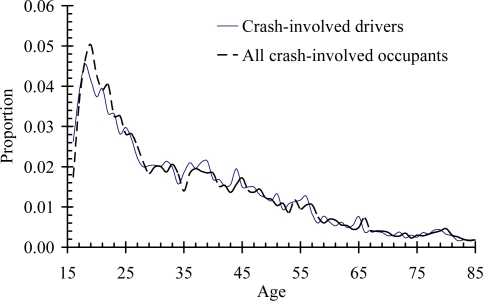
The age distributions, P̂, for drivers and for all occupants were taken from the NASS-CDS database for the calendar years 2000–2007 with the weighting variable RATWGT used to estimate a nationally representative distribution (Figure 2).
Figure 2.
Age distributions of crash-involved adults (age ≥16) in NASS-CDS 2000–2007.
Estimation of Fatality Risk Distribution
With N, E, and P̂ defined as described above, the only remaining unknowns in Equation [4] are R̂rel and R20. Decomposing the distribution into these components facilitates comparison with other studies that have assessed age-related changes in risk using different methods, age ranges, or populations. The relative fatality risk distribution used in this paper was estimated from two sources. The first is from Evans (2001), who estimated risks using a double-pair comparison approach on data for over 250,000 people killed in traffic crashes. Twenty-eight combinations of gender, restraint use, helmet use, and seating location were considered and a consistent non-linear increase in fatality risk with age was observed. The risk of death was found to increase at a compound rate of 2.52±0.08 percent per year for males and 2.16±0.10 percent per year for females.
For comparison with the Evans findings, the NASS-CDS data files for the calendar years 1992–2002 were analyzed to develop a fatality risk distribution by age.
Since relative risk estimation was the goal of the study, a well-defined population with relatively large exposure was chosen, viz. adult drivers age >15 years in a planar frontal (principal direction of force 10:00–2:00) crash without a fire. Drivers with unknown or unreported injury outcome or restraint usage or with a belt other than a lap-shoulder belt were excluded from the data set. Females in the 2nd or 3rd term of pregnancy were excluded as they were considered a special at-risk group that was beyond of the scope of this investigation. The mortality outcome was used in its dichotomous mode (died = 1 and survived = 0). Adjusted statistical models were developed to account for the confounders Delta-V (km/h), vehicle body type (0=passenger car, 1=light truck), vehicle curb weight (kg), vehicle age (years, defined as the calendar year of the crash minus the model year of the vehicle), occupant gender (1=female), occupant height (cm) and weight (kg), airbag deployment (1=present and deployed), and belt use (1=belt in use). The weighting variable RATWGT was used to get national estimates. Multiple logistic regression models were used to adjust for the confounders and to calculate the logit estimates and the probability of death. These probabilities were calculated via the maximum likelihood method of logistic regression models. The logit multivariate regression model is written as
| [5] |
| [6] |
| [7] |
where loge is the natural log (logit estimate). P(Yi=1) is the probability of the event occurring (i.e., when Yi=1 for a dichotomous outcome) given χij. β0 is the model intercept (Log odds (Yi= 1), given all χs = 0). χij are the selected predictors (covariates) within the model. βij are the coefficient’s estimates for the included covariates within the logistic regression model. For the set of model parameters described above, Equation [7] can be written specifically as
| [8] |
where Yi=1 if the measurable event occurred and β1, 2,......10 are the coefficients for each included covariate.
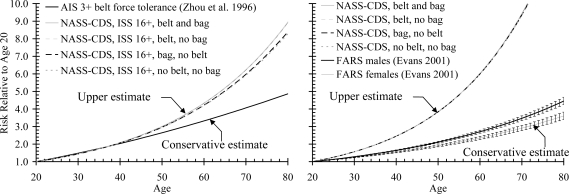
From Equation [8] the relative risk distribution can be determined by normalizing the probability function to its value when driver age is set to 20 years. The relative fatality risk distributions based on the Evans (2001) study and on the NASS-CDS study are shown in Figure 3.
Figure 3.
Relative risk distributions, R̂rel, for injury (left) and for death (right) using different populations and methodologies.
Estimation of Injury Risk Distribution
The relative risk of death cannot be used for the injury portion of the study. The risk of death is determined by the combined effects of two factors that both change with aging. First, the risk of death depends on the risk that an injury is sustained in the first place (fragility). Second, the risk of death depends on the risk of a person dying given a certain injury (frailty). Both fragility and frailty increase with aging and the relative death risk distributions described above include both of those factors. The risk of an injury occurring is by definition the first of those two factors (fragility) and is unaffected by the second (frailty), so it is to be expected that the distribution of injury risk with aging should be different than the distribution of fatality risk. In fact, since frailty is known to increase with aging, the relative risk of injury would be expected to increase at a somewhat lower rate than the relative risk of death.
One estimate of the relative risk distribution, R̂rel, for injury as an outcome can be made using the NASS-CDS data and analysis described above with an injury outcome measure other than fatality. For the development of this relative risk function, Yi was defined as equaling 1 if the driver sustained an injury severity score (ISS) ≥ 16. Other definitions of injury were considered, but the shape of the relative risk distribution with age was found to be relatively insensitive to the definition of injury (i.e., the degree to which risk increased with age was not strongly dependent on the severity of injury chosen for consideration).
Another estimate of the relative risk distribution can be derived from the analysis of Zhou et al. (1996). This study makes for a particularly interesting comparison with the NASS-CDS approach since cadavers in a controlled laboratory setting, rather than living humans in the field, were used to define the risk increase associated with aging. Zhou and colleagues divided into three age ranges (16–35, 36–65, 66–85 years) a cohort of 107 cadavers exposed to 3-point seatbelt loading, 24 cadavers exposed to anterior blunt impacts, and 29 cadavers exposed to lateral blunt impacts and determined the age-associated reduction in AIS 3+ injury tolerance. The force tolerance for the subjects exposed to belt loading was found to decrease by approximately half from the youngest age group to the middle age group while the force tolerance of the oldest age group was 28% of the youngest. The chest deformation tolerance under blunt loading was found to decrease much less dramatically with aging, with the middle age group retaining about 82% of the chest deflection tolerance of the youngest group and the oldest group retaining about 75%. For the current study, the inverse of the tolerance reduction was plotted at the midpoint of each age range and a 2nd order polynomial was fit to the three data points for the belt loading case and then normalized to have the value of 1 at age 20. The blunt impact condition was not used in the current study since the criterion used to define injury threshold, chest deflection, depends on both the intrinsic characteristics of the cadaver and on the severity of the extrinsic loading. For this reason, several studies in addition to the Zhou blunt hub experiments, which relied upon chest deformation to quantify age-related changes in risk, were also excluded (e.g., Kent and Patrie 2003, Laituri et al. 2005). In contrast, if belt force is used to define the tolerance reduction, then the relative risk function describes the risk change associated with aging for a similar severity external load. The relative injury risk distributions based on the Zhou et al. (1996) study and on the NASS-CDS study described above are shown in Figure 3.
Analytical Approach
Once relative risk distributions are defined, the only remaining unknown in Equation [4] is the absolute risk term R20. The analytical approach taken here included four steps:
Solve for R20 for the baseline case (N, E, and P̂ known, a range of values for R̂rel estimated from the literature).
Set R̂rel = Î to represent the situation where there is no increase in relative risk associated with aging.
Recalculate N with R20, E, and P̂ unchanged.
The difference between the baseline value of N (derived from 2006 field data) and the value of N determined in Step 3 is the number of killed or injured people that can be attributed to the age-related reduction in tolerance to external loading.
For calculating N, the relative risk of drivers age 16–19 was assumed to be one (i.e., there was assumed to be no age-related reduction in tolerance between age 16 and age 20). The 4-step algorithm described above yields estimates of the total number of killed or injured occupants that can be attributed to the age-related reduction in tolerance to external loading. This is the number that could be averted if the crash environment could be modified such that there was no increase in relative risk for ages greater than 20 years. In other words, this is the number that could be averted if risk saturated (became constant) at age 20.
Sensitivity to Risk Saturation Age
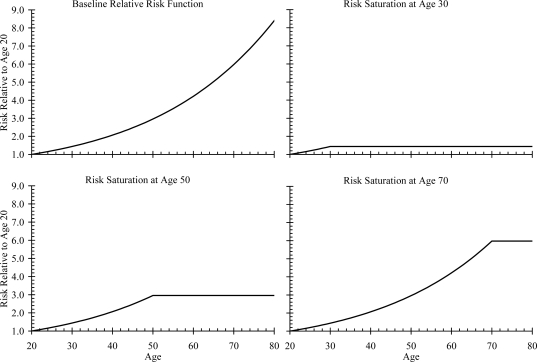
Of course, attaining a crash environment in which risk does not increase beyond age 20 is an extremely ambitious and perhaps unrealistic goal, so it may be more useful to quantify the numbers if risk were to saturate at ages greater than age 20. For example, it may be a more realistic short-term goal to create a crash environment where risk saturates at age 80 (i.e., risk for all occupants older than 80 years becomes equal to the risk at age 80). In fact, the number of killed or injured occupants can be determined for any risk saturation age. To determine this relationship, the relative risk distribution R̂rel was simply assumed to become constant at the age of risk saturation and to remain unchanged at all ages less than that (Figure 4). Steps 3 and 4 above were then performed with the relative risk curve saturated at each year of age. The resulting number of injured or killed occupants who would be saved can then be plotted against the age of risk saturation to define the sensitivity.
Figure 4.
Illustration of changes to a relative risk distribution, R̂rel, to reflect risk saturation at ages 30, 50, and 70.
Fragility vs. Frailty
The NASS-CDS analysis is also useful for apportioning the contributions of fragility and frailty to the increased death risk associated with aging. If the relative risk of injury is indeed insensitive to either the environment or to the particular definition of injury, then that relative risk defines the increase in fragility with age:
| [9] |
Furthermore, the conditional probability of death given an injury, assuming they are independent events, can be considered as a definition of “frailty”. The injury and death probability functions determined from the NASS-CDS data can be used to determine how frailty changes with aging through a simple conditional probability relationship:
| [10] |
where P (A/B) is the conditional probability of death (A) given an injury (B), P (A and B) is the probability of injury and death, which is the probability function of Equation [8] with the death outcome, and P (B) is the probability of injury but not death.
Equation [10], then, gives the conditional probability of death given a certain injury, B. In order to determine the conditional probability of death for any injury, it is necessary to normalize the injury probability function. This can be accomplished by recognizing that
| [11] |
where the subscript indicates the age. The left-hand side of Equation [10] can then be divided by the left-hand side of Equation [11], and the right-hand side by the right-hand side to yield
| [12] |
RESULTS
A wide range in the relative risk distributions by age was found when the different methods for estimating them were compared. The injury risk at age 70 relative to age 20 ranged from 4.06 based on the Zhou et al. (1996) study to 6.22 in the NASS-CDS analysis of belted occupants with an airbag. The NASS-CDS-based fatality risk functions exhibited a sharper increase with aging than the injury risk functions, as expected due to the combined effects of fragility and frailty discussed above. The relative risk of death at age 70 based on the NASS-CDS analysis was 9.42. The double-pair comparison study of Evans (2001) suggested a much less pronounced increase with aging, with the relative risk at age 70 being only 2.91 for females (the most conservative estimate found). As a result of this discordance in the literature, the estimated numbers of killed and injured exhibited a large range of uncertainty.
Drivers and All Occupants Injured and Killed as a Result of Aging
Of the 10.452 million drivers involved in crashes in the U.S. in 2006, 1.666 million were injured and 22,830 were killed. If the age of risk saturation is set to 20 years (i.e., if there was no age-related increase in risk), those totals drop to 739,552–869,801 injured and 7,891–15,025 killed. In other words, 47.8%–55.6% of injured drivers and 24.3%–46.5% of driver deaths can be attributed to the age-related increase in risk that starts at age 20 (Table 2).
Table 2.
Estimated Annual Lives Lost and People Injured as a Result of Aging
| Injured annually | Percent of all injured | Killed annually | Percent of all killed | |
|---|---|---|---|---|
| Drivers | 796,199–926,449 | 47.8%–55.6% | 7,805–14,939 | 24.3%–46.5% |
| All occupants age ≥ 16 | 1,133,242–1,327,607 | 47.7%–55.9% | 10,989–21,132 | 34.2%–65.8% |
The percentages are slightly greater when all adult occupants are considered. This is a result of the age distribution for all adult occupants being shifted slightly to the right compared to drivers (Figure 2). Of the 13.559 million adult occupants involved in crashes in the U.S. in 2006, 2.375 million were injured and 32,092 were killed. If the age of risk saturation is set to 20 years, those totals drop to 1.047–1.242 million injured and 10,960–21,103 killed. In other words, 47.7%–55.9% of injured adult occupants and 34.2%–65.8% of occupant deaths can be attributed to the age-related increase in risk that starts at age 20 (Table 2).
Risk Saturation
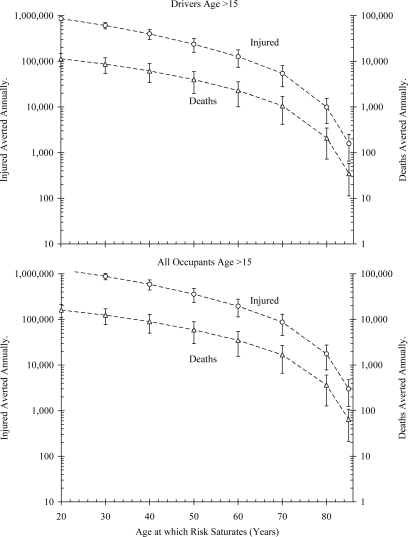
As expected due to the drop-off in exposure as age increases, the number of killed and injured that are averted when risk saturates also drops off as the age of risk saturation increases. The decrease is nonlinear on a log-linear scale (Figure 5). From the approximately 10,000 deaths and 1,000,000 injuries that could be averted by saturating risk at age twenty, the benefit of risk saturation decreases to approximately 200,000 injured and 3,500 deaths prevented with risk saturation at age 60, and 3,000 injuries and 100 deaths with saturation at age 85. The benefit to risk saturation increases rapidly as the age of saturation decreases. Beyond the trend with age, however, the results indicate that substantial benefits can be gained with relatively modest reductions in risk for the oldest occupants. For example, approximately 100 annual deaths could be prevented if occupants over the age of 85 had the risk of an 85-year old. If the crash environment could be modified in such a way that all occupants over age 70 had the risk of a 70-year-old, the expected benefit is the elimination of some 90,000 injured occupants and 1,700 deaths.
Figure 5.
Number of averted deaths and injured drivers (top) and all occupants (bottom) as a function of the age at which risk saturates. Error bars represent the conservative and upper estimates of relative risk (see Figure 3).
Fragility vs. Frailty
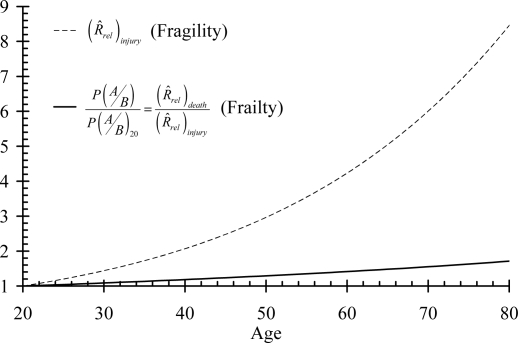
The changes in fragility and in frailty with aging, using the definitions of Equations [9] and [12], are plotted in Figure 6. This shows that fragility is the dominant factor, increasing by a factor of over eight from age 20 to age 80, while frailty increases by a factor of less than two over that range.
Figure 6.
Frailty and fragility with increasing age. Fragility is defined as the probability of an injury occurring and frailty is defined as the conditional probability of death given an injury. Both are normalized to age 20.
DISCUSSION
Crash exposure clearly decreases with aging beyond the teen years (see Figure 2). This fact may be used to justify prioritization of other at-risk populations. It is important to realize, however, that the number of people killed or injured is the product of both the exposure and the risk, that risk increases significantly with age, and that the U.S. population will continue to age for decades. The fundamental purpose of the current study was to quantify the interplay between exposure and risk as a function of occupant age. Based on the analysis presented here, it is reasonable to conclude that frailty and fragility related to aging are responsible for approximately half of all injured and killed occupants. Even the most conservative estimates of risk distribution indicate that intrinsic aspects of aging are responsible for at least 10,989 deaths and 1.13 million injured occupants every year in the United States.
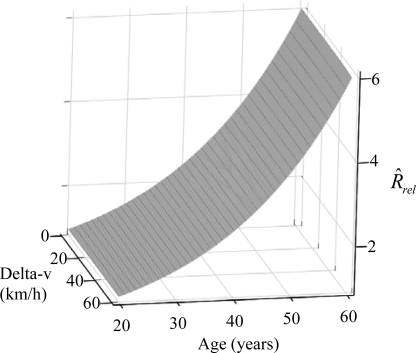
As described in the Introduction, aging is associated with changes in the crash environment in addition to intrinsic changes in frailty and fragility. Interestingly, Evans (2001) concluded that his relative risk distribution by age was insensitive to the specifics of the blunt trauma that generated the death, even suggesting that the relationship between age and relative risk in automotive crashes could be applied generally to blunt trauma (e.g., falls). The NASS-CDS analysis presented here is consistent with that conclusion in that the relative risk functions are insensitive to restraint condition, delta-v, and other confounders that were considered in the statistical model (Figure 3, Figure 7). For the purposes of the study presented in this paper, a relative risk distribution that is independent of environment or exposure (crash severity, restraint use, etc.) is a fortuitous finding since it allows the increased risk that is due to fragility (injury outcome) or the combination of fragility and frailty (death outcome) to be isolated from the environmental aspects of risk (changing restraint usage, increase in side impacts, etc.). The fact that both the Evans distribution and the NASS-CDS-based distribution were insensitive to environmental factors such as restraint use and crash severity suggests that the net effect of environment on the age-related change in risk is relatively small and that the numbers of deaths and injured occupants that were found to result from aging actually represent primarily the fragility and frailty aspects of aging, not any change in crash environment. The apportionment exercise indicates that both fragility and frailty increase with aging, but that frailty increases by much less. One interpretation of this finding is that injury mitigation efforts for older drivers have a greater potential benefit than improved treatment in terms of preventing automotive deaths.
Figure 7.
Illustration of insensitivity of NASS-CDS-based relative risk distribution to crash severity. The distribution is similarly insensitive to occupant parameters, vehicle parameters, and restraint use (see Figure 3 for sensitivity to restraint).
The studies used here to define the range of relative risk distributions employed different methods. Evans (2001) used a double-pair comparison approach with occupants grouped by selected environmental factors that affect risk (helmet use, restraint use, gender). Zhou et al. (2006) considered cadavers that were tested in a controlled laboratory setting where the environment was well defined and the parameter defining injury tolerance (belt force) innately accounts for variability in impact severity. The NASS-CDS study presented here controlled for several environmental factors within a logistic regression model in order to isolate the part of the risk that is attributed to aging independently of environment. Each method has strengths and limitations. The double pair comparison method proposes to compare rates (of fatality in this case) between subjects who have been exposed to similar crash severities. In fact, this could be viewed as a case-control type of method whether there is matching for crash severity for the cases (i.e., those who died) and the control (i.e., those who did not). This method has been used in a number of motor vehicle safety-related publications aiming to assess the effectiveness of different safety measures (e.g., safety belts, airbags, vehicle mass) and it is superior to the situation where no other information on the severity of the crash is available and effectiveness estimates could be confounded as a result. There is no evidence that this method is superior to performing multivariate analysis where crash severity has been controlled for as a covariate. More importantly, using multivariate regression models allows for additional control for other possible confounders, such as those considered in our NASS-CDS model. The use of cadavers in the Zhou study is limited in the nature and range of injuries that can be sustained by an ex vivo model (in the current case injury was defined exclusively by rib fractures). Logistic regression models of NASS-CDS data are limited by the sampling and documentation accuracy of the database as well as by the restrictions imposed by the use of a linear logit function and by the particular parametric form chosen (logistic). As a result of the limitations inherent in all of the relative risk distributions available for study, a conservatively wide range was considered.
CONCLUSIONS
This study has attempted to quantify the number of killed and injured occupants that can be related to aging. Exposure data for the U.S. in 2006 were combined with estimates of age-related risk from a variety of sources. Risk was then saturated (made constant) at different ages to elucidate the potential savings in terms of the number of injured and killed occupants who would be saved. If the relative risk distribution is set to one for all ages (i.e., there is no age-related increase in injury or death risk), then 47.8%–55.6% of injured drivers and 24.3%–46.5% of driver deaths would be eliminated and 47.7%–55.9% of injured adult occupants and 34.2%–65.8% of deaths among all adult occupants would be eliminated. In other words, on the order of half of the injured or killed are so as a result of decreased tolerance due to aging. The benefit of saturating risk drops off quickly with increasing age, but the potential benefits to even modest targets for risk saturation are worth pursuing. For example, if the crash environment could be modified in such a way that all occupants over age 70 had the risk of a 70-year-old, the expected benefit is the elimination of some 90,000 injured occupants and 1,700 occupant deaths each year in the U.S. Conditional probability analysis suggests that most of these deaths are due to increased fragility associated with aging rather than increased frailty.
Acknowledgments
Basem Hanary assisted in the development of the NASS-CDS risk functions. Thanks also to Jeff Crandall and Jason Kerrigan for helpful discussions on the methods employed in this paper and to Ola Bostrom for insights on crash protection for older people.
REFERENCES
- Bulger E, Arneson M, Mock C, Jurkovich G. Rib fractures in the elderly. The Journal of Trauma. 2000;48:1040–1047. doi: 10.1097/00005373-200006000-00007. [DOI] [PubMed] [Google Scholar]
- Bostrom O, Haland Y. Benefits of a 3+2 point belt system and an inboard torso side support in frontal, far-side and rollover crashes. Paper 451, Proc. 18th Technical Conference on the Enhanced Safety of Vehicles (ESV); Nagoya, Japan. 2003. [Google Scholar]
- Cerelli E. National Highway Traffic Safety Administration. U.S. Department of Transportation; Washington, DC: 1998. Research Note: Crash data and rates for age-sex groups of drivers, 1996. [Google Scholar]
- Evans L. Age and fatality risk from similar severity impacts. Journal of Traffic Medicine. 2001;29(1–2):10–19. [Google Scholar]
- Forman J, Prasad P, Rouhana S, Kent R. Thoracic response in low-speed frontal impacts. Stapp Car Crash Journal. 2006;50:191–216. doi: 10.4271/2006-22-0009. [DOI] [PubMed] [Google Scholar]
- Islam S, Mannering F. Driver aging and its effect on male and female single-vehicle accident injuries: Some additional evidence. Journal of Safety Research. 2006;37:267–276. doi: 10.1016/j.jsr.2006.04.003. [DOI] [PubMed] [Google Scholar]
- Kent R, Patrie J. Chest deflection tolerance to blunt anterior loading is sensitive to age but not to load distribution. Forensic Science International. 2004;149(2–3):121–128. doi: 10.1016/j.forsciint.2004.04.086. [DOI] [PubMed] [Google Scholar]
- Kent R, Henary B, Matsuoka F. On the fatal crash experience of older drivers. Proc of the Association for the Advancement of Automotive Medicine. 2005;49:371–391. [PMC free article] [PubMed] [Google Scholar]
- Laituri T, Prasad P, Sullivan K, Frankstein M, Thomas R. Paper 2005-01-0297, Society of Automotive Engineers. Warrendale, PA: 2005. Derivation and evaluation of a provisional, age-dependent, AIS 3+ thoracic risk curve for belted adults in frontal impacts. [Google Scholar]
- Martinez R, Sharieff G, Hooper J. Three-point restraints as a risk factor for chest injury in the elderly. Journal of Trauma – Injury, Infection, and Critical Care. 1994;37:980–984. doi: 10.1097/00005373-199412000-00019. [DOI] [PubMed] [Google Scholar]
- Miller T, Lestina D, Spicer R. Highway crash costs in the United States by driver age, blood alcohol level, victim age, and restraint use. Accident Analysis and Prevention. 1998;30:137–150. doi: 10.1016/s0001-4575(97)00093-6. [DOI] [PubMed] [Google Scholar]
- Miltner E, Salwender H-J. Influencing factors on the injury severity of restrained front seat occupants in car-to-car head-on collisions. Accident Analysis and Prevention. 1995;27:143–150. doi: 10.1016/0001-4575(94)00039-o. [DOI] [PubMed] [Google Scholar]
- Morris A, Welsh R, Frampton R, Charlton J, Fildes B. An overview of requirements for the crash protection of older drivers. Proc AAAM. 2002;46:141–56. [PubMed] [Google Scholar]
- Morris A, Welsh R, Hassan A. Requirements for the crash protection of older vehicle passengers. Proc AAAM. 2003;47:165–80. [PMC free article] [PubMed] [Google Scholar]
- OECD . Ageing and Transport – Mobility Needs and Safety Issues. Organization for Economic Co-operation and Development; Paris, France: 2001. [Google Scholar]
- Peek-Asa C, Dean B, Halbert R. Traffic-related injury hospitalizations among California elderly, 1994. Accident Analysis and Prevention. 1994;30:389–395. doi: 10.1016/s0001-4575(97)00104-8. [DOI] [PubMed] [Google Scholar]
- Rouhana S, Bedewi P, Kankanala S, Prasad P, Zwolinski J, Meduvsky A, Rupp J, Jeffreys T, Schneider L. Biomechanics of 4-point seat belt systems in frontal impacts. Stapp Car Crash Journal. 2003;47:367–400. doi: 10.4271/2003-22-0017. [DOI] [PubMed] [Google Scholar]
- Traffic Safety Facts 2006. National Highway Traffic Safety Administration, U.S. Department of Transportation, Washington, DC (http://www-nrd.nhtsa.dot.gov/Pubs/TSF2006FE.PDF).
- Viano D, Ridella S.1996. Significance of intersection crashes for older drivers. Paper 960457, Society of Automotive Engineers, Warrendale, PA.
- Zhou Q, Rouhana S, Melvin J.1996. Age effects on thoracic injury tolerance. Paper 962421, Society of Automotive Engineers, Warrendale, PA.


