Abstract
Alcohol involvement in fatal crashes (any driver with a blood alcohol concentration [BAC] = .01g/dL or greater) in 2007 was more than three times higher at night (6 p.m.–6 a.m.) than during the day (6 a.m.–6 p.m.) (62% versus 19%). Alcohol involvement was 35% during weekdays compared to 54% on weekends. Nearly one in four drivers (23%) of personal vehicles (e.g., passenger cars or light trucks) and more than one in four motorcyclists (27%) in fatal crashes were intoxicated (i.e., had a BAC equal to or greater than the .08 g/dL illegal limit in the United States). In contrast, only 1% of the commercial drivers of heavy trucks had BACs equal to .08 g/dL or higher. More than a quarter (26%) of the drivers with high BACs (≥.15 g/dL) did not have valid licenses. The 21- to 24-age group had the highest proportion (35%) of drivers with BACs≥.08 g/dL, followed by the 25- to 34-age group (29%). The oldest and the youngest drivers had the lowest percentages of BACs≥ .08 g/dL: those aged 75 or older were at 4%, and those aged 16 to 20 were at 17%. Utah had the lowest rate of intoxicated drivers in fatal crashes at one in every eight drivers (12%), followed by Kentucky, Indiana, Iowa, New Hampshire, and Kansas, all at 17%. Montana (31%), South Carolina (31%), and North Dakota (39%) all had more than 3 in 10 drivers in fatal crashes who were intoxicated in 2007. The United States enjoyed a remarkable downward trend in alcohol-related crashes between 1982 and 1995, which has since leveled off. That trend coincided with a period during which per capita national alcohol consumption declined, the number of young drivers decreased, and the proportion of female drivers increased. Those factors alone, however, did not appear to account for the overall reduction. This provides further evidence that impaired-driving laws and safety program activity may have been responsible for at least some of the decline. However, there was a general worldwide decline in alcohol-related crashes during the same period, and other socioeconomic factors may have played a role. Proven effective strategies that could reduce impaired driving further in the United States include more frequent highly publicized enforcement efforts, such as sobriety checkpoints; lowering the illegal BAC limit for driving to .05g/dL; and mandating alcohol ignition interlocks for all convicted impaired drivers.
INTRODUCTION
Motor vehicle crashes became a public safety problem in the United States at the beginning of the 20th century. Alcohol has been associated with traffic crashes for more than 100 years, as indicated by the publication of the first scientific report on the effect of drinking by operators of “motorized wagons” in 1904 [Editorial, 1904]. The Federal Highway Administration (FHWA) estimated that 172 people died in motorized vehicle crashes in 1904 [NCSA, 2004]. In 2007, the National Highway Traffic Safety Administration (NHTSA) estimated that 17,036 (41.5%) of the 41,059 traffic fatalities were alcohol related [NHTSA, 2009a]. NHTSA has also estimated that an additional 512,000 people are injured in alcohol-related crashes each year and that alcohol-related crashes cost the U.S. society $51 billion annually [Blincoe, Seay, Zaloshnja, et al., 2002]. That societal cost estimate accounts for the underreporting of alcohol by police and includes reported and unreported injury crashes.
The basic scientific foundations for the relationship of alcohol to highway crashes were established more than 70 years ago. The classic work of Widmark (1932) in Sweden was the first to establish the basic relationship between alcohol consumption and blood alcohol concentration (BAC), and Heise (1934) published the first-known research on the association of alcohol to crashes. Borkenstein invented the first practical alcohol breath-testing device in 1954 [Borkenstein and Smith, 1961] and conducted a study that determined the relationship between BAC and crash risk a decade later [Borkenstein, Crowther, Shumante, et al., 1964]. Despite the scientific progress, the effect of this knowledge on the public and public policy in the United States was modest.
Perhaps as significant for traffic safety as the limited framework for impaired-driving law enforcement was the lack of public understanding of the specific problem presented by drinking and driving and, for that matter, the traffic crash problem in general. As Ross (1992) noted, during the first half of the 20th century, crashes were attributed to “driver error.” The term for such events was “accident,” implying that they were chance events. The term “accident proneness” was developed to explain why some individuals were involved in more accidents than others.
Although states, beginning with New York in 1910, had all passed impaired-driving laws, they were generally termed “drunk-driving laws,” suggesting that only very heavy drinking was illegal.
The U.S. Congress established the National Highway Safety Bureau (the precursor to the National Highway Traffic Administration [NHTSA]) as part of the new Department of Transportation (DOT) in 1966. A little while later, Haddon (1970), a public health physician active in alcohol research, described a matrix approach to traffic safety. The matrix showed that three elements were involved in crashes—the driver, the vehicle, and the environment (roadway)—and that safety programs could be developed for each element in three periods—pre-crash, crash, and post-crash. That formulation not only highlighted the complexity of the crash problem, but also took it out of the realm of chance events and stressed the need for research to produce effective interventions. Haddon’s work strongly influenced the safety field, and he was appointed head of the new federal traffic safety agency when it was established.
In 1968, the Alcohol and Highway Safety Report to Congress [U.S. DOT, 1968] summarized what was known about the relationship of alcohol consumption to crash risk and focused on the “problem drinker” as a primary contributor to the problem. The early work on enforcement, adjudication, and treatment procedures assisted states and communities in improving their laws and enforcement programs. This resulted in an increase in driving while intoxicated (DWI) or driving under the influence (DUI) arrests at the end of the 1970s [Federal Bureau of Investigation, 2004]. Unfortunately, there was no concurrent evidence of a reduction in alcohol-related crashes in the late 1970s. The Fatality Analysis Reporting System (FARS) was established by NHTSA in 1975; however, the current system for estimating the number of alcohol-related fatalities was not established until 1982 [Rubin, Schafer and Subramanian, 1998]. Consequently, there are no comparable data on alcohol-related crashes before 1982.
In the early 1980s, the U.S. public’s attitude toward drinking and driving was substantially transformed. Citizen activism is generally given credit for this change. In 1978, Remove Intoxicated Drivers (RID), the first citizen activist group dedicated to fighting drunk driving, was established in New York State. In 1980, five days after her daughter’s death due to a drunk driver, Candy Lightner and some friends in California decided to start an organization to fight against drunk drivers. The organization that evolved is called “Mothers Against Drunk Driving (MADD)” [Weed, 1987]. More than 25 years later, MADD is considered by many to be the leading organization in the United States dedicated to eliminating drunk driving.
The traffic safety field has benefited from the availability of a strong statistical base. For the last half century, states have been maintaining relatively detailed information on highway crashes. These data have provided information for the scientific study of factors that produce highway injuries. Perhaps more importantly, however, these data have provided legislators, local governments, police departments, and motor-vehicle agencies with key information that assists them in developing and evaluating policies. The value of traffic statistical records has been demonstrated by their widespread use, not only by those in safety research, but also by those in public health. These data have been particularly useful to researchers in the public health arena who deal with the problems surrounding unhealthy use of alcohol and drugs. An outstanding example of the influence of traffic safety statistics on the public health issue is the adoption by the U.S. Congress of age 21 as the minimum legal drinking age (MLDA) in the United States. The primary evidence for the effectiveness of that law in reducing alcohol problems was drawn from the records of alcohol-related crashes involving youth aged 15 to 20 [Wagenaar and Toomey, 2002].
Many types of measures are used to evaluate programs. Their significance varies, not only with what is measured (e.g., crashes, drivers in crashes, injuries, deaths), but also with the method used to normalize or compare these measures (e.g., vehicle miles of travel, number of licensed drivers) over time or between jurisdictions.
This paper presents some basic characteristics of recent alcohol-related fatal crashes, followed by a discussion of alcohol-related crash trends over the last three decades in the United States. The relative risk of crash involvement at various BACs is briefly discussed next. Finally, estimates of the number of alcohol-related fatal crashes that could be prevented if United States policies were effective in deterring all driving by individuals on our roadways with BACs higher than an established limit are presented and discussed.
METHODS
Information on alcohol-related crashes at the national level in the United States is derived from two principal sources: FARS and the General Estimates System (GES) of the National Automotive Sampling System (NASS) program, both of which are maintained by NHTSA’s National Center for Statistics and Analysis (NCSA). Only data analyses using FARS data are presented here [NHTSA, 2009a]. While the GES contains some information on alcohol involvement, it is not complete because very few drivers are tested for BAC and there is no imputation of BACs in the data file. Therefore, GES was not used in the current analyses.
The FARS is a census of all fatal crashes (defined as a death of a participant within 30 days of the crash event) occurring on U.S. public roadways and reported to the police. FARS analysts are stationed in each of the 50 States, the District of Columbia, and Puerto Rico. They collect data in more than 100 categories from several state data sources (including state crash report records, driver records, death certificates, vehicle registration files, and other sources), which they enter into a local computer database. These data are quality controlled and transferred to the national FARS file. Alcohol involvement is documented through BAC test results collected by police or coroners. Where such data are not available, the BACs of drivers, pedestrians, and cyclists are statistically imputed using crash characteristics (such as a police report of driver impairment) to obtain more complete and accurate alcohol data [Subramanian, 2002]. Data are entered daily into a file that is finalized at the end of the following year (end of 2008 for the 2007 file year). These data reflect the initial summary analysis for 2007 in NHTSA’s Traffic Safety Facts annual report [NHTSA, 2009b].
The FARS contains the BACs of “active road users” defined as “drivers, pedalcyclists, and pedestrians,” individuals who are hypothesized to contribute to the occurrence of a fatal crash. BACs of passengers, who are viewed as not contributing to the occurrence of a crash, are not used to define “alcohol-related” crashes. The BAC file contains the actual measured value when that is available. In 2007, measured BACs were available on 64.1% of fatally injured drivers and 23.2% of surviving drivers in fatal crashes [NHTSA, 2009a]. The imputation system for producing estimated BACs for cases without measured values [Subramanian, 2002] is used to complete the BAC file. This imputation is available in FARS for each year from 1982 through the current year. It provides a BAC value for every driver, pedalcyclist, and pedestrian in the FARS file. Historically, two BAC levels have been of interest: (1) alcohol-related crashes involving an active road user with a BAC greater than zero (BAC ≥.01 g/dL) and (2) alcohol-impaired fatal crashes where one or more of the drivers, pedestrians, or pedalcyclists had a BAC at or higher than the illegal limit. This alcohol-impaired criterion changed from a BAC ≥.10 g/dL to a BAC ≥.08 g/dL in the last 5 years with the adoption by all states of a .08 g/dL illegal per se law. Currently, NHTSA uses the fatalities as a result of crashes where a driver had a BAC≥.08 g/dL. In 2007, that number was 12,998 or 31.7% of 41,059 total traffic fatalities [NCSA, 2008].
Although the fatalities per vehicle miles traveled (VMT) rate has often been proposed as a measure of progress in traffic safety, this measure is affected by several factors not directly related to traffic safety. O’Neill and Kyrychenko (2006), for example, highlighted some of the factors that can potentially influence the number of VMT. They analyzed state-level data to determine the relationship of VMT to demographic and socioeconomic factors. They derived relationships between traffic deaths per billion miles of travel and three measures of urbanization. The three measures clearly indicated that rural states have higher mileage death rates than urban states. Similar data on the relationship of state socioeconomic data and the crash fatality rate were also derived. Their study concluded that urbanization and demographics account for 59% of the variation among states in VMT fatality rates, suggesting that more than half of that measure is unrelated to vehicle, highway, and driver safety programs.
A limitation of the VMT measure, which is calculated using gas tax receipts among other data, is that it does not distinguish between miles driven after drinking and miles driven with zero BACs. The limitation in calculating an alcohol-related fatal crash/VMT rate plus the strong relationship of VMT to urban location and driver demographics suggests that alcohol-related crashes are best measured using data from the crash record system. An example would be the number of alcohol-related crashes divided by total crashes (i.e., percentage that is alcohol related) or the CIR (crash incidence ratio = alcohol-related crashes divided by non-alcohol-related crashes). These two measures assume that exposure can be measured indirectly through the number of non-alcohol-related crashes. Both the crash measure and the exposure measure come from the same source and therefore share a common set of data elements that can be used to help normalize comparisons between groups. Although the factors that may influence crash involvement are unlikely to be identical for drinking and nondrinking drivers in fatal crashes, when examining certain groups of interest (e.g., comparing fatality rates of drivers with different ethnic backgrounds) where VMT rates for specific subgroups may not be available, such relative measures may provide the best data for analysis [Voas, Tippetts, Romano, et al., 2007; Klein, 1989]. Although the percentage of all crashes (or fatalities) may be the measure that is best understood by the public, the CIR may provide the better method for measuring progress in safety programs because it contrasts alcohol-related with non-alcohol-related events directly.
With this as background, the Statistical Package for Social Sciences [SPSS Inc., 1997] software was used to analyze the FARS data to determine the important characteristics of alcohol-related fatal crashes.
RESULTS
Drinking Drivers Involved in Fatal Crashes
Alcohol involvement of drivers involved in fatal crashes varies substantially by vehicle type. In 2007, approximately one in five drivers of personal vehicles (e.g., passenger cars or light trucks) and more than one in four motorcyclists in fatal crashes had a BAC higher than the .08 g/dL legal limit. In contrast, only 1% of the commercial drivers of heavy trucks had an illegal BAC.
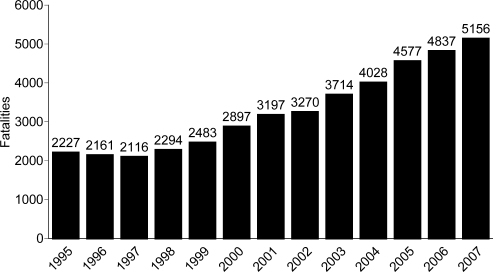
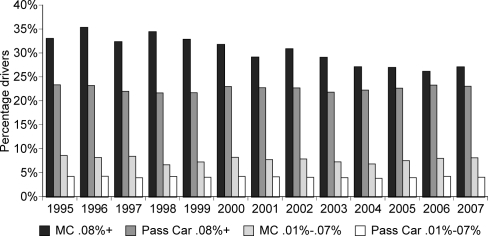
As shown in Figures 1 and 2, drinking and riding a motorcycle is a stubborn problem in which total alcohol-related crashes are increasing while the proportion of all motorcycle fatal crashes that are alcohol-related appears to be declining. After an extended downward trend through the 1990s, the number of fatal motorcycle crashes began to climb starting in 1998 and have risen each year since (Figure 1). Fatal motorcycle crashes have increased 144% over 10 years, from a low of 2,116 fatalities in 1997 to a high of 5,156 fatalities in 2007. Twenty-seven percent of motorcyclists had illegal BACs (≥.08 g/dL) contrasted with 23% of passenger car drivers in 2007 (Figure 2) [NHTSA, 2009a].
Figure 1.
Motorcycle fatalities, FARS 1995–2007
[Source: NHTSA, 2009a]
Figure 2.
Driver BACs in motorcycle and passenger car fatal crashes, FARS, 1995–2007
[Source: NHTSA, 2009a]
Because the VMT estimates from the FHWA for motorcycles have remained essentially the same since 1997, the upward trend remains when fatalities are divided by VMT as an exposure measure. The number of registered motorcycles increased, however, by 51% (from 3,826,373 to 5,780,870) between 1997 and 2004. Further, the number of new motorcycles sold yearly increased by 268% from 1997 to 2003. Consequently, the assumption has been that the increase in motorcyclist fatalities has been due, at least in part, to an increase in exposure. For various reasons, traditional measures of exposure (VMT, registrations, and licensed operators) are not providing an accurate measure of exposure for motorcyclists [Shankar.and Varghese, 2006].
Figure 2 shows that the percentages of fatal motorcycle crashes where the rider had been drinking have actually fallen slightly over recent years until about 2004, both for motorcyclists with higher BACs (≥.08 g/dL) and with lower BACs (.01 – .07 g/dL), before rising again the past few years. During the same period, the percentages of crashes involving alcohol for other vehicle types have remained stable (e.g., passenger cars). Nevertheless, the proportion of crashes involving alcohol is significantly higher for motorcycles than for any other type of vehicle. The number of alcohol-involved fatal crashes at BACs lower than .08 g/dL is also significantly higher for motorcycles (8%) than for other vehicle types (e.g., 4% for passenger cars). This might suggest that motorcycle operation is sufficiently complex, compared to passenger cars, that riders’ skills are more impaired at lower BACs than drivers of passenger cars. In any case, the fairly large difference between alcohol involvements in fatal motorcycle crashes compared to other vehicle types suggests that there is substantial room for improvement in this area.
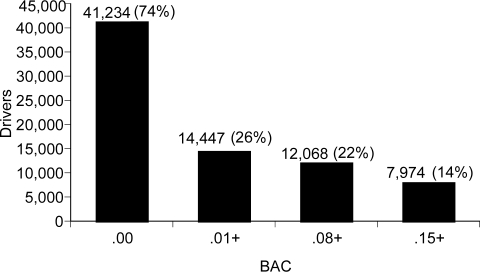
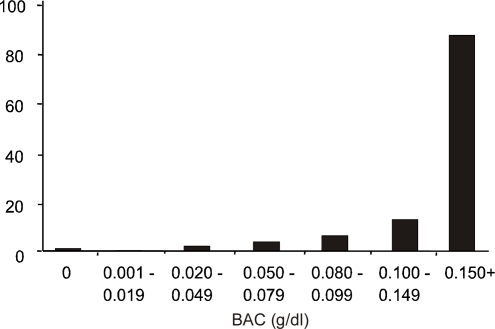
There were 55,681 drivers involved in fatal crashes in 2007 that resulted in 41,059 deaths. Twenty-two percent of these drivers were illegally intoxicated (BAC ≥.08 g/dL), whereas 14% had BACs exceeding .15 g/dL (see Figure 3). Thirteen percent of these intoxicated drivers were driving a motorcycle or an off-road vehicle in the fatal crash. Only 7.5% of these intoxicated drivers had a prior conviction for DWI within the past 3 years. It is believed, however, that this percentage would be much higher if the look-back period for prior offenses went beyond 3 years (e.g., 5 to 10 years). Over 10% of these impaired drivers were younger than 21, ages in which any drinking of alcohol and driving is illegal in every State.
Figure 3.
Drivers involved in fatal crashes by BAC level, FARS 2007 (N=55,681)
[Source: NHTSA, 2009a]
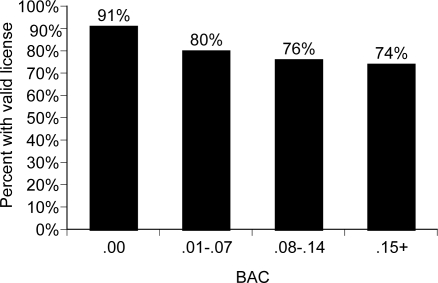
When examining all of the 55,681 drivers involved in fatal crashes, the percentage who did not have a valid license (suspended, revoked, etc.) increased by the BAC level of the driver. More than a quarter of the drivers with high BACs (≥.15 g/dL) did not have valid licenses (Figure 4). Many of these licenses were suspended as a result of prior DWI convictions, yet these offenders continued to drive.
Figure 4.
Drivers involved in fatal crashes by license status, FARS 2007 (N=55,681)
[Source: NHTSA, 2009a]
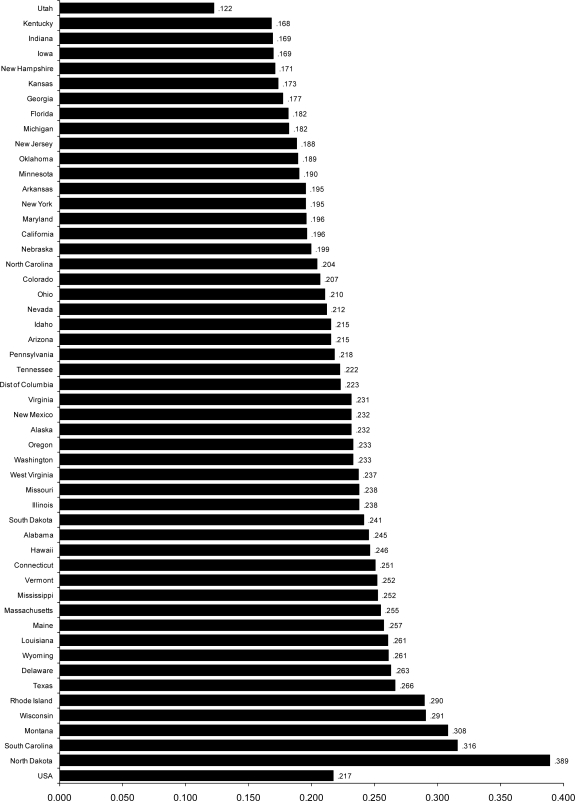
The 21- to 24-age group had the highest proportion (34.5%) of drivers with BACs≥.08 g/dL, followed by the 25- to 34-age group (29.2%). The oldest and the youngest drivers had the lowest percentages of BACs≥.08 g/dL: those aged 75 or older were at 4.1%, and those aged 16 to 20 were at 17.4%. Overall, 21.7% of drivers of all ages in fatal crashes had BACs≥.08 g/dL. Figure 5 shows the extreme variability of the proportion of drivers involved in fatal crashes who were intoxicated (BAC≥.08 g/dL) in 2007 by state. Utah had the lowest rate at 12% while North Dakota (39%) had more than three times the lowest rate.
Figure 5.
Proportion of drivers involved in fatal crashes in 2007 with BACs .08+
[Source: NHTSA, 2009a]
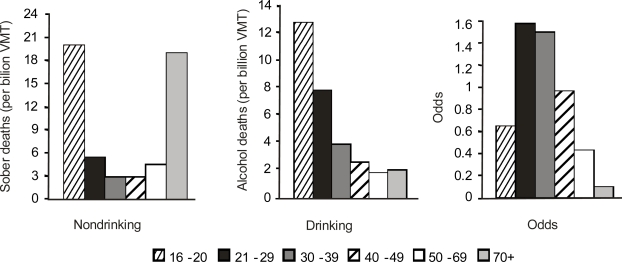
To better understand the role of alcohol, it is useful to compare drinking and nondrinking drivers in fatal crashes. This is illustrated in Figure 6, with FARS data from 1990 to 1994 [Tippetts and Voas, 2002]. The first graph shows the age distribution of non-alcohol-related fatal crash involvements as a function of VMT as reported by the 1990 FHWA National Personal Transportation Survey. That graph takes the traditional U-shape with underage and elderly drivers having the highest non-alcohol-related crash rates per mile driven. The common explanation for this relationship is the inexperience and risk-taking of youthful drivers; the deterioration of driving skills; and perhaps more importantly, the greater fragility of elderly drivers because of their greater susceptibility to fatal injury under certain crash conditions.
Figure 6.
Drinking and nondrinking driver fatal crash rates by driver age and the odds of drinking to nondrinking driver rates, 1990–1994 [adapted from Tippetts and Voas, 2002]
When, as in the second graph of Figure 6, alcohol-related rates per VMT are plotted, an L-shaped curve results with drinking-driver rates per mile driven being the highest among youthful drivers and gradually dropping with age, with the elderly least involved. The common explanation is that the driving skills of underage drivers are more vulnerable to alcohol. A somewhat different impression is provided when alcohol-involvement rates are considered as a ratio (drinking-driver rates/non-drinking-driver rates) by age group (third graph in Figure 6). This takes the shape of an inverted “U.” Thus, when the involvement of underage drinking drivers in fatal crashes is related to mileage driven, their risk level is high. This is in part because their risk when sober is high. When the effect of their high risk when sober is accounted for by using that measure to normalize the data to compare across age groups, drivers 21 to 49 have a higher relative risk (odds) when drinking than do underage drivers.
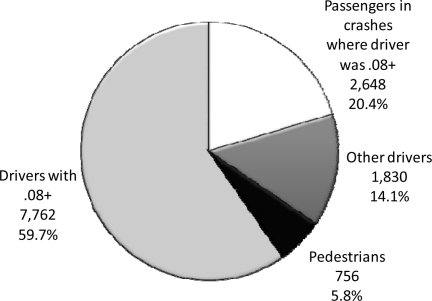
Almost 32% (12,998) of the 41,059 traffic fatalities in 2007 resulted from a crash where at least one driver had an illegal BAC (≥.08 g/dL) (Figure 7). As shown, almost two-thirds of these fatalities are the impaired drivers themselves.
Figure 7.
Fatalities in crashes involving drunk drivers (BAC≥.08 g/dL), 2007 (N=13,036)
[Source: NHTSA, 2009a]
Trend in Alcohol-Related Crashes in the United States
Alcohol has historically been involved in a substantial proportion of fatal crashes in the United States. Over the past 25 years, however, progress has clearly been made in reducing the problem. A qualitative estimate of the influence of various countermeasures on the impaired-driving problem can be deduced from the recent trend in alcohol-related fatal crashes. Based on the NHTSA BAC imputation method where the BAC of the active participant is estimated if it is not known [Subramanian, 2002], alcohol-related traffic fatalities have declined from 26,173 in 1982 to 17,036 in 2004, a 35% decrease; while non-alcohol-related traffic fatalities have gradually increased from 17,772 in 1982 to 24,023 in 2007, a 35% increase [NHTSA, 2009a].
Beginning in 1982, the percentage of all traffic fatalities that were alcohol-related declined from 59.6% to 41.5% in 2007, a 30% relative reduction. The percentage of all fatally injured drivers (where the testing for BAC is relatively high in FARS) who were higher than the current illegal limit in the United States (BAC ≥.08 g/dL) dropped from 53% in 1982 to 35.5% in 2007, a 33% relative decline. A similar decline occurred for fatally injured drivers with extremely high BACs (≥.20 g/dL).
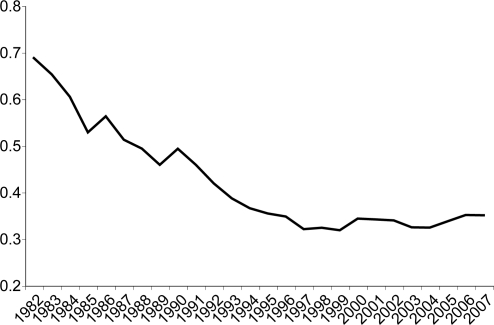
The ratio of drinking drivers to nondrinking drivers in fatal crashes (the CIR measure used to evaluate the effectiveness of various impaired-driving countermeasures) declined from .69 in 1982 to .35 in 2007, a 51% decline in that measure (Figure 8).
Figure 8.
Ratio of drinking drivers to nondrinking drivers in fatal crashes, 1982 to 2007 (−51%)
[Source: NHTSA, 2009a]
DISCUSSION
The large reductions in alcohol-related crash measures between 1982 and 2007 suggest that safety program interventions may have had some effect. Before accepting that conclusion, however, it is necessary to evaluate the alternative explanations for the observed reductions. Among the possible non-impaired-driving program explanations are (1) a reduction in per capita alcohol consumption, (2) a reduction in the number of high-risk young males in the population, and (3) a general worldwide decline in alcohol-related crashes associated with roadway and vehicle improvements and an increase in traffic congestion. For a summary of the contribution of many of these factors on the reductions in alcohol-related traffic fatalities, see Dang [2008].
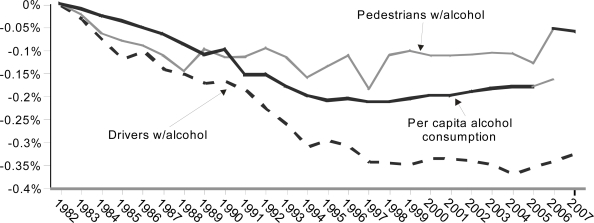
From1982 to 1995, per capita alcohol consumption in the United States declined [Lakins, Williams, Yi, et al., 2005]. Figure 9 shows the annual decline in per capita consumption of alcohol along with the annual decline of fatally injured drinking drivers and fatally injured drinking pedestrians from 1982 through 2007. Substantial declines are seen in all three rates between 1982 and 1995, with a leveling off in the past decade. The reduction in the percentage of fatally injured drinking drivers was substantially greater than for fatally injured pedestrians. The percentage of reduction in fatally injured drinking drivers also was greater than the reduction in per capita alcohol consumption. This suggests that the change in national alcohol consumption that might have produced much of the reduction in fatally injured drinking pedestrians did not totally account for the larger reduction in deaths of drinking drivers.
Figure 9.
Percentage of reduction in fatally injured drinking drivers and pedestrians and per capita alcohol consumption in the United States, from the 1982 baseline year to 2003
[Source: NHTSA, 2009a, and Lakins, LaVallee, Williams, et al., 2008]
Because most countermeasure programs in the last 25 years have targeted drivers, not pedestrians or drinking in general, this difference supports the hypothesis that these programs had an effect on drinking-driver deaths and injuries beyond that which might be accounted for by the observed reduction in alcohol consumption.
Although alcohol-related fatal crashes were substantially reduced between 1982 and 1995, there has been little change over the past 10 years [Stewart, Fell and Sweedler, 2004]. A frequent argument for the current importance of offenders with very high BACs is that the decrease in alcohol-related crashes in the last 10 years resulted from a reduction in impaired driving by the “easy to deter” social drinking drivers, whereas the high BAC drinking drivers remain to be controlled. Thus, this argument suggests we hit the “wall” in the mid-1990s after most social drinkers changed their behavior. Evidence, however, does not indicate a change in the characteristics of crash-involved drinking drivers during the last 20 years. The reduction in the percentage of fatally injured drivers with high BACs of .15 g/dL or greater from 1982 to 2003 was 37%, the same as for drivers at BACs of .08 g/dL or greater [McCartt and Williams, 2004].
Driving Exposure by Alcohol-Involved Drivers
Measures of alcohol-involved fatalities that are “standardized” for gross population exposure, such as aggregate fatality rates per VMT (not discriminating between VMT of “drinking-miles” versus “sober-miles”), might actually understate the relative risk of alcohol-involved fatalities. Data from the 2007 National Roadside Survey indicates that for drivers on the road on weekend nights (the highest risk time for alcohol-involved crashes), the higher the BAC, the fewer miles driven. Computing mileage for the evening for each driver, we find that those drivers whose BAC is higher than the legal limit of .08 g/dL report driving 25% fewer miles on the weekend evening/ night in question compared to sober drivers [Lacey, Kelley-Baker, Furr-Holden, et al., 2009, under review].
Relative Risk of Crash Involvement
As previously acknowledged, it has been recognized that alcohol is a factor in crashes since the beginning of the 20th century. A key issue, however, is whether this association relates to the characteristics of high-risk individuals who become involved in crashes or whether the acute effects of alcohol at the time of the event is a causal factor in the crash. Men drive more than women; men have more crashes than women; and men drink more than women. Thus, crash-involved drivers are more likely to have been drinking. The mere association of alcohol with crash involvement does not demonstrate a causal influence unless all other relevant factors can be eliminated.
More direct evidence of a causal relationship is provided by demonstrating that crash probability is directly related to the amount of alcohol in the driver’s body. Relative risk studies attempt to refine the influence of alcohol on crashes by comparing drivers in crashes with similar drivers using the road at the times and places were crashes have occurred. One powerful approach to estimating relative risk of a crash due to alcohol involves “case-control” investigations that, for each crash-involved driver (case), select one or more non-crash-involved drivers (control) for comparison. (Case-control studies actually estimate the comparative likelihood of crash involvement using an odds ratio. This measure closely approximates relative risk for incidents whose probability is extremely rare – which is the case here, for likelihood of crashing relative to trips taken. Subsequent mentions of estimated relative risk from case-control studies are thus approximations using odds ratios.) The key to such studies is to ensure that the comparison driver is selected so that the only distinction between the two is the involvement in a crash. In concept, this is achieved by going to the same location where the crash occurred at the same time of day on the same day of the week and randomly selecting comparison drivers (non-crash-involved drivers) operating vehicles in the same direction on the road as the crash-involved driver. Although eight studies of this type have been conducted over the last 70 years, in practice, this level of control has rarely been achieved.
The classic Borkenstein study has recently been superseded by the most complete, detailed case-control study to date. This latest study was conducted with NHTSA funding by Blomberg, Peck, Moskowitz, et al. (2005) at two sites—Long Beach, California, and Fort Lauderdale, Florida—from June 1997 to April 1999. Five 2-person research teams at each site consisting of a police officer and a research assistant operating from a police car traveled to crash sites and interviewed and breath tested the drivers involved in those crashes between 4 p.m. and 2 a.m. in Long Beach and 5 p.m. and 3 a.m. in Fort Lauderdale. One week following the crash, the research team returned to the crash site on the same day and at the same time that the crash occurred and stopped and interviewed two drivers heading in the same direction as the crash-involved driver. A breath test and brief interview were obtained from two comparison drivers for each crash-involved driver. At the two sites, 4,316 crash-involved drivers were contacted and compared with 10,066 control drivers. The study achieved a high level of participation with 88% of the crash-involved drivers and 93% of the comparison drivers providing a complete set of data.
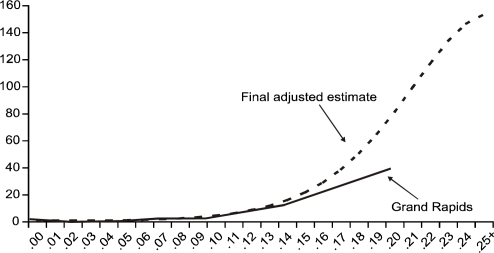
The final relationship derived from the Blomberg et al. (2005) analysis is contrasted with the classical Borkenstein et al. (1974) Grand Rapids estimated relative risk curve in Figure 10. The Blomberg et al. (2005) study found a statistically significant relative risk of a crash at BAC ≥.04 g/dL that increased exponentially at BACs of .10 g/dL and higher. The Blomberg et al. (2005) relative risk curve eliminates the infamous “Grand Rapids Dip” at BACs in the .02–.03 g/dL range. This dip had been shown by Allsop (1966) and Hurst, Harte, and Frith (1994) to be an artifact of the data due to the lack of covariates. There is no evidence that low levels of alcohol consumption actually reduce crash risk.
Figure 10.
Relative crash risk by BAC from Blomberg et al. (2005) and Borkenstein (1974)
Attributable Risk
Case-control studies that provide odds ratios estimating relative risk can also provide the basis for estimating the influence of reducing the number of drivers at or higher than specific BACs on our highways. This may be useful in considering at what point the per se BAC limit should ultimately be established. For example, based on the Blomberg et al. (2005) data in Figure 10, a driver at .08 BAC is 2.69 times more likely to be in a crash than if that driver was at a zero BAC. Along with other evidence, this provides a solid basis for making driving at or higher than that level illegal. But that does not indicate how many crashes would be avoided if, in fact, there were no drivers higher than .08 g/dL BAC on the roads. That estimate is commonly called “attributable risk” in the public health field and can be derived from two sets of data: (1) the estimated relative risk (odds ratio) from the case-control studies and (2) the frequency of crashes in the population for which the risk curve was developed [Coughlin, Benichou and Weed, 1994]. Applying their formula (p. 51) to traffic safety (crashes) can be presented as
where P© is the probability of a fatal crash in the United States and P/C/E is the hypothetical probability of a fatal crash ignoring exposure.
An example of applying this calculation of the attributable risk to drinking drivers in fatal crashes has been provided by Lund (2006) who used relative risk curves calculated by Zador, Krawchuk, and Voas (2000) based on the FARS and the 1996 National Roadside Survey [Voas, Wells, Lestina, et al., 1997]. Although not a typical case-control study, Zador Krawchuk, and Voas (2000) selected crash data from the FARS that matched the weekend hours and the months in 1996 when the national survey was conducted. The relative risk levels developed by Zador and colleagues are shown in Figure 11. Lund (2006) applied those relative risk values to an estimation of the savings in driver fatalities if new vehicle “technologies” succeeded in preventing drivers at certain BACs from driving (Table 1).
Figure 11.
Passenger vehicle driver relative risk of fatal crash involvement by BAC (RR @ .00 g/dL BAC = 1) [adapted from Zador, Krawchuk, and Voas, 2000]
Table 1.
Potential lives saved in 2004 if driver BACs had been limited to < .08 g/dL [adapted from Lund, 2006]
| Driver BACs (g/dL) | Fatalities 2004 | Estimated reduction |
|---|---|---|
| .150+ | 8,629 | 6,540 |
| .100 – .149 | 3,430 | 1,143 |
| .080 – .099 | 1,083 | 203 |
| ALL | 13,142 | 7,886 |
Table 2 shows the hypothetical savings from setting the BAC limit in the United States at five different levels. As shown, this calculation suggests that if BAC limits were perfectly enforced, the recent reduction from the .10 to .08 g/dL national BAC limit would save a thousand lives. A reduction in BAC limits to the levels enforced in the European Union and Australia (.05 BAC) [Fell and Voas, 2009] would save an additional 2,500 lives. That difference between the .10 g/dL limit and the .08 g/dL limit is not just due to the deterrence of drivers with BACs between .08 and .099 g/dL, but to drivers at all BAC levels. The hypothetical reductions produced by perfect enforcement of the .08 law at the two BAC levels higher than .08 g/dL (<.10 g/dL and <.15 g/dL) are also shown in Table 2.
Table 2.
Potential lives saved in 2004 if driver BACs had been limited to specified levels [adapted from Lund, 2006]
| Permitted BAC (g/dL) | Lives saved |
|---|---|
| < .15 | 4,794 |
| < .10 | 6,855 |
| < .08 | 7,886 |
| < .05 | 10,493 |
| < .02 | 12,319 |
An important piece of information not shown in this simple calculation is how many persons would have to be “treated” (i.e., denied licenses, put in jail, or subjected to some other control to ensure that no driver would be on the road with a BAC higher than that limit). Although keeping all drivers off the road at BACs higher than a specified limit is currently impractical, the number that required “treatment” would permit an estimate of the number that would be required to reduce over-the-limit-drivers by a more realistic 10% or 20%. That number would provide safety advocates and legislators with an indication of the cost of implementing a reasonably effective program to enforce the .08 g/dL or any other BAC limit. To make that calculation, it is necessary to consider the exposure to risk that was not in the simplified formula given hereinbefore. This requires an additional set of data on the proportion of vehicle miles that are driven by individuals at various BACs. This also requires traffic counts that provide the means to determine the total number of drivers at each BAC in the geographical area of interest, in addition to roadside survey estimates of the proportions of drivers at various BACs. These data are not currently available.
Research over the past decade has demonstrated that certain programs and policies are effective in reducing the number of alcohol-involved drivers in fatal crashes. For example, frequent high-visibility checkpoints conservatively reduce alcohol-involved drivers by about 10% [Shults, Elder, Sleet, et al., 2001; Fell, Lacey and Voas, 2004], and lowering the BAC limit from .10 to .08 g/dL also showed an approximate 8% reduction in drinking drivers involved in fatal crashes [Wagenaar, Maldonado-Molina, Ma, et al., 2007; Tippetts, Voas, Fell, et al., 2005]. Assuming that these effect sizes could be achieved from additional enforcement efforts and from lowering the BAC limit from .08 to .05, we might expect a further reduction of drinking drivers involved in fatal crashes of between 10% and 20% [Fell and Voas, 2009].
The basic rates of alcohol involvement in fatal crashes, as well as the sheer number of fatal crashes, fatalities, and drivers involved, has remained remarkably constant in recent years. In the 3 years from 2005 to 2007, there has been an average of 42,426 fatalities per year, with 17,455 of these being alcohol-involved. By attributing fatalities equally to drivers involved in those crashes, we find that drivers with BACs of .08 g/dL or higher are “responsible” for about 1.205 fatalities each, compared to only 0.584 fatalities per non-alcohol-involved driver, and only 1.044 fatalities per driver at BACs of .01–.079 g/dL.
Therefore, if additional enforcement and legislation initiatives were to reduce alcohol-involved drivers by 10% to 20% (with the majority of those coming from higher BAC levels, who account for more fatalities per driver), we might see a further reduction of 1,700 to 3,400 fatalities per year at the 2007 driving exposure levels.
CONCLUSIONS
Traffic safety researchers have benefited from the extensive records of crashes maintained by NHTSA and the states. These data files have provided the basis for analyzing the characteristics of alcohol-related crashes and for the evaluation of impaired-driving laws and programs. Not fully appreciated by the public and some safety activists is the complexity of the data on alcohol-related crashes. In part, this complexity is derived from the richness of the data that allow the reporting of similar sounding but quite different variables, such as “alcohol-related crashes,” “drinking drivers in crashes,” and “alcohol-related fatalities.” Additional complexity arises from the limited availability of BAC measures of active road users involved in crashes. Only 64% of fatally injured drivers and 23% of surviving drivers in fatal crashes are tested for alcohol in the United States. This requires imputing BACs for those cases where this measure is lacking or using surrogate measures based upon other information, such as single-vehicle nighttime crashes. Another area of complexity is the choice of a normalizing or exposure variable, such as population or VMT, upon which to properly compare different groups.
Alcohol involvement in fatal and injury crashes is strongly patterned. Crashes involving only one vehicle, occurring at night and on weekends, are much more likely to involve a drinking driver. The type of vehicle also plays a role: drivers of commercial vehicles are much less likely to be involved in an alcohol-related crash than drivers of private vehicles or motorcyclists. Men are more involved as drinking drivers than women and young men more than the elderly, but these simple differences conceal much more complex relationships. Many are based primarily on the extent of exposure, where men, for example, may drive more than women during high-risk evening hours.
The United States enjoyed a remarkable downward trend in alcohol-related crashes between 1982 and 1995, which has since leveled off. That trend coincided with a period during which per capita national alcohol consumption declined and the number of young drivers decreased, but those factors alone did not appear to account for the overall reduction. This provides evidence that safety program activity may have been responsible for at least some of the decline. This conclusion, however, must be accepted with some caution because there was a general worldwide decline in alcohol-related crashes during the same period. Furthermore, other socioeconomic factors may have played a role. However, previous studies have shown that certain laws (e.g., lowering the per se limit to .08; administrative license revocation [ALR]) and enforcement programs (e.g., high-visibility checkpoints) can significantly reduce the number of alcohol-involved drivers in fatal crashes by effect sizes in the 7% to 10% range per intervention. Further, lowering of the per se BAC limit (e.g., from .08 to .05 g/dL), coupled with increased enforcement efforts, might feasibly save as many as 1,700 to 3,400 more lives per year. Alcohol ignition interlock devices on the vehicles of convicted DWI offenders have been shown to reduce recidivism by those offenders by about 60% [Voas, Marques, Tippetts, et al., 1999]. It remains to be seen how many lives could be saved if all convicted DWI offenders were sanctioned with interlocks for at least one year. Currently, nine States require alcohol interlocks for all DWI convicted offenders in the United States.
During this last decade, a new and more detailed case-control study of the odds ratio estimating relative risk of a crash at various BAC levels has been conducted that took into account two groups of crash-involved drivers not previously measured: drivers who hit-and-run and drivers who refuse to provide a breath test. That study [Blomberg, et al., 2005] confirmed earlier research that indicated that significant increased risk occurs at BACs as low as .04 g/dL and demonstrated that risk levels rise much more rapidly at BACs higher .08 g/dL.
Relative risk estimates from odds ratios in case-control studies provide the basis for calculating attributable risk estimates of the number of lives saved if all drivers over a given BAC were removed from the road. With the addition of information on the number of VMT for the hour of the day and day of the week, under conditions of various BAC levels, it would be possible to calculate how many individuals would need to be intercepted (e.g., encountered by law enforcement or locked out via an interlock) to prevent any driver from being on the road at a BAC higher than the limit. This, in turn, could lead to estimates of the costs of various safety interventions.
REFERENCES
- Allsop RE. Alcohol and Road Accidents (Road Research Laboratory Report No. 6) Harmondsworth, England: Road Research Laboratory, Ministry of Transport; 1966. [Google Scholar]
- Blincoe LJ, Seay A, Zaloshnja E, et al. The economic impact of motor vehicle crashes, 2000 (DOT HS 809 446) Washington, DC: U.S. Department of Transportation, National Highway Traffic Safety Administration; May, 2002. [Google Scholar]
- Blomberg RD, Peck RC, Moskowitz H, et al. Crash risk of alcohol involved driving: A case-control study. Stanford, CT: Dunlap & Associates, Inc.; 2005. [Google Scholar]
- Borkenstein RF, Crowther RF, Shumante RP, et al. The role of the drinking driver in traffic accidents. Bloomington, IN: Department of Police Administration, Indiana University; 1964. [Google Scholar]
- Borkenstein RF, Crowther RF, Shumate RP, et al. The role of the drinking driver in traffic accidents. Blutalkohol. 1974;11(Supplement 1):1–132. [Google Scholar]
- Borkenstein RF, Smith HW. The breathalyzer and its application. Med Sci Law. 1961;1:13. [Google Scholar]
- Coughlin SS, Benichou J, Weed DL. Attributable risk estimation in case-control studies. Epidemiol Rev. 1994;16(1):51–64. doi: 10.1093/oxfordjournals.epirev.a036144. [DOI] [PubMed] [Google Scholar]
- Dang JN. Statistical analysis of Alcohol-Related Driving Trends, 1982–2005 (DOT HS 810 942) Washington, DC: National Highway Safety Administration; 2008. [Google Scholar]
- Editorial. Qtr J Inebriety. 1904;26:308–309. [Google Scholar]
- Federal Bureau of Investigation . Crime in the United States 2004. Clarksburg, WV: U.S. Department of Justice; 2004. [Google Scholar]
- Fell JC, Lacey JH, Voas RB. Sobriety checkpoints: Evidence of effectiveness is strong, but use is limited. Traffic Inj Prev. 2004;5(3):220–227. doi: 10.1080/15389580490465247. [DOI] [PubMed] [Google Scholar]
- Fell JC, Voas RB. Reducing illegal blood alcohol limits for driving: Effects on traffic safety. In: Verster JC, Pandi-Perumal SR, Ramaekers JG, de Gier JJ, editors. Drugs, Driving and Traffic Safety. Basel, Switzerland: Birkhäuser Verlag AG; 2009. pp. 415–437. [Google Scholar]
- Haddon WJ.A logical framework for categorizing highway safety phenomena and activity Proceedings of the Tenth International Study Week in Traffic and Safety Engineering, World Touring and Automobile Association, Permanent International Association of Road CongressesRotterdam, NetherlandsSeptember 9, 19701970. [Google Scholar]
- Heise HA. Alcohol and Automobile Accidents. JAMA. 1934;103:739–741. [Google Scholar]
- Hurst PM, Harte D, Frith WJ. The Grand Rapids dip revisited. Accid Anal Prev. 1994;26(5):647–654. doi: 10.1016/0001-4575(94)90026-4. [DOI] [PubMed] [Google Scholar]
- Klein TM. Changes in alcohol-involved fatal crashes associated with tougher state alcohol legislation (DOT HS 807 511) Washington, DC: National Highway Traffic Safety Administration; 1989. [Google Scholar]
- Lacey J, Kelley-Baker T, Furr-Holden CD, et al. 2007 Roadside Survey of Alcohol- and Drug-involved Driving: Alcohol Results Washington, DC: National Highway Traffic Safety Administration; 2009. under review. [Google Scholar]
- Lakins NE, LaVallee RA, Williams GD, et al. Alcohol Epidemiologic Data System. Apparent Per Capita Alcohol Consumption: National, State, and Regional Trends, 1970–2006 (Surveillance Report #85) Bethesda, MD: National Institute on Alcohol Abuse and Alcoholism, Division of Epidemiology and Prevention Research; Nov, 2008. [Google Scholar]
- Lakins NE, Williams GD, Yi H, et al. Surveillance report #73: Apparent per capita alcohol consumption: National, state, and regional trends, 1977–2003. Bethesda, MD: NIAAA, Division of Epidemiology and Prevention Research, Alcohol Epidemiologic Data System; Aug, 2005. [Google Scholar]
- Lund AK. International Technology Symposium. Albuquerque, NM: 2006. Eliminating alcohol-impaired driving: Potential effects of technology applied to the general population, Insurance Institute for Highway Safety. [Google Scholar]
- McCartt A, Williams AF. Characteristics of fatally injured drivers with High Blood Alcohol Concentrations (BACs) In: Oliver, Williams, Clayton, editors. Proceedings of the 17th International Conference on Alcohol, Drugs & Traffic Safety. Glasgow, Scotland: 2004. [Google Scholar]
- National Center for Statistics and Analysis . Fact Sheet. Motor vehicle traffic fatalities and fatality rate: 1899–2003. Washington, DC: National Highway Traffic Safety Administration; 2004. [Google Scholar]
- National Center for Statistics and Analysis . Traffic Safety Facts 2007 Data: Alcohol-Impaired Driving (DOT HS 810 985) Washington, DC: National Highway Traffic Safety Administration; 2008. [Google Scholar]
- National Highway Traffic Safety Administration Fatality Analysis Reporting System (FARS). U.S. Department of Transportation, National Highway Traffic Safety AdministrationAvailable online at ftp://ftp.nhtsa.dot.gov/fars/(Last accessed on March 30, 2009); 2009a
- National Highway Traffic Safety Administration . Traffic Safety Facts 2007: A Compilation of Motor Vehicle Crash Data from the Fatality Analysis Reporting System and the General Estimates System (DOT HS 811 002) Washington, DC: National Center for Statistics and Analysis, U.S. Department of Transportation; 2009b. [Google Scholar]
- O’Neill B, Kyrychenko SY. Use and misuse of motor vehicle crash death rates in assessing highway safety performance, Insurance Institute for Highway Safety. Traffic Inj Prev. 2006;7(4):307–318. doi: 10.1080/15389580600832661. [DOI] [PubMed] [Google Scholar]
- Ross HL. Confronting drunk driving: Social policy for saving lives. New Haven, CT: Yale University Press; 1992. [Google Scholar]
- Rubin DB, Schafer JL, Subramanian R. Multiple imputation of missing blood alcohol concentration (BAC) values in FARS. Washington, DC: National Highway Traffic Safety Administration; 1998. [Google Scholar]
- Shankar U, Varghese C. Recent trends in fatal motorcycle crashes: An update (DOT HS 810 606) Washington, DC: National Highway Traffic Safety Administration; Jun, 2006. [Google Scholar]
- Shults RA, Elder RW, Sleet DA, et al. Reviews of evidence regarding interventions to reduce alcohol-impaired driving. Am J Prev Med. 2001;21(4 Suppl):66–88. doi: 10.1016/s0749-3797(01)00381-6. [DOI] [PubMed] [Google Scholar]
- SPSS Inc . SPSS Missing Value Analysis 7.5. Chicago, IL: MaryAnn Hill/SPSS Inc.; 1997. [Google Scholar]
- Stewart K, Fell J, Sweedler B. Trends in impaired driving in the United States: How to resume progress. In: Oliver J, Williams P, Clayton A, editors. Proceedings of the 17th International Conference on Alcohol, Drugs and Traffic Safety, August 8–13, 2004. Glasgow, UK: X-CD Technologies; 2004. [Google Scholar]
- Subramanian R. Transitioning to multiple imputation - A new method to estimate missing blood alcohol concentration (BAC) values in FARS (DOT HS 809 403) Washington, DC: Mathematical Analysis Division, National Center for Statistics and Analysis, National Highway Traffic Safety Administration, U.S. Department of Transportation;; Jan, 2002. [Google Scholar]
- Tippetts AS, Voas RB. Odds that an involved driver was drinking: Best indicator of an alcohol-related crash? In: Mayhew DR, Dussault C, editors. Proceedings of the 16th International Conference on Alcohol, Drugs and Traffic Safety. Montreal, Canada: Société de l'assurance automobile du Québec; 2002. pp. 67–71. [Google Scholar]
- Tippetts AS, Voas RB, Fell JC, et al. A meta-analysis of .08 BAC laws in 19 jurisdictions in the United States. Accid Anal Prev. 2005;37(1):149–161. doi: 10.1016/j.aap.2004.02.006. [DOI] [PubMed] [Google Scholar]
- U.S. Department of Transportation . 1968 Alcohol and highway safety Report to the US Congress. Washington, DC: U.S. Government Printing Office; 1968. [Google Scholar]
- Voas RB, Marques PR, Tippetts AS, et al. The Alberta Interlock Program: The evaluation of a province-wide program on DUI recidivism. Addiction. 1999;94(12):1849–1859. doi: 10.1046/j.1360-0443.1999.9412184910.x. [DOI] [PubMed] [Google Scholar]
- Voas RB, Tippetts AS, Romano E, et al. Alcohol involvement in fatal crashes under three crash exposure measures. Traffic Inj Prev. 2007;8(2):107–114. doi: 10.1080/15389580601041403. [DOI] [PubMed] [Google Scholar]
- Voas RB, Wells J, Lestina D, et al. Drinking and driving in the US: The 1996 National Roadside Survey. In: Mercier-Guyon C, editor. Proceedings of the 14th International Conference on Alcohol, Drugs and Traffic Safety - T97, Annecy, 21 – 26 September 1997. Annecy, France: Centre d’Etudes et de Recherches en Médecine du Trafic;; 1997. pp. 1159–1166. [Google Scholar]
- Wagenaar A, Maldonado-Molina M, Ma L, et al. Effects of legal BAC limits on fatal crash involvement: Analyses of 28 states from 1976 through 2002. J Safety Res. 2007;38:493–499. doi: 10.1016/j.jsr.2007.06.001. [DOI] [PubMed] [Google Scholar]
- Wagenaar AC, Toomey TL. Effects of minimum drinking age laws: Review and analyses of the literature from 1960 to 2000. J Stud Alcohol. 2002;(Supplement No. 14):206–225. doi: 10.15288/jsas.2002.s14.206. [DOI] [PubMed] [Google Scholar]
- Weed FJ. Grass-roots activism and the drunk driving issue: A survey of MADD chapters. Law and Policy. 1987;9:259–278. [Google Scholar]
- Widmark EMP. Principles and applications of medicolegal alcohol determination. Davis, CA: Biomedical Publications; 1932. [Google Scholar]
- Zador PL, Krawchuk SA, Voas RB. Alcohol-related relative risk of driver fatalities and driver involvement in fatal crashes in relation to driver age and gender: An update using 1996 data. J Stud Alcohol. 2000;61(3):387–395. doi: 10.15288/jsa.2000.61.387. [DOI] [PubMed] [Google Scholar]


