Abstract
Pulmonary contusion (PC) is the most common injury following blunt thoracic trauma with an associated mortality of 10% to 20%. The purpose of this study is to determine how crash parameters correlate to the volume of pulmonary contusion. The Crash Injury Research Engineering and Network (CIREN) database was queried to extract data on all occupants sustaining PC in a near-side crash. The selected CIREN data included all completed cases from 2005 through 2010. Cases involving a roll-over or without a thorax CT uploaded to the database were excluded. After all cases had been examined the study had 64 occupants with varying volumes of PC. Specific crash characteristics compiled included change in velocity due to the impact, energy, occupant characteristics, side airbag deployment, and crush profile measurements. Crush metrics quantifying the area of the crush profile and the location of the crush relative to the occupant were calculated. The thoracic CT scans from these cases were downloaded and segmented to determine the percent volume of high attenuation lung and PC as compared to the total volume of the lung. The results of the general linear model analysis suggest that maximum crush was the best predictor of high attenuation lung and lung location best predicted PC. An analysis of NASS and CIREN demonstrated that crashes with PC tended to have crash parameters that indicated higher severity. These correlations can be used in the future to develop an injury criterion for PC using finite element metrics.
INTRODUCTION
Motor vehicle crashes (MVCs) are the leading cause of blunt chest trauma [Shorr, Crittenden, Indeck et al., 1987], and pulmonary contusion (PC) is the most common injury following this type of insult [Clark, Schecter and Trunkey, 1988; Allen and Coates, 1996]. Over 38% of the Abbreviated Injury Scale (AIS) 3+ thoracic injuries were identified as some form of PC in a recent National Automotive Sampling System (NASS) study [Stitzel, Kilgo, Weaver et al., 2010]. The associated mortality rate for this injury ranges from 10% to 20% of affected individuals [Hoff, Shotts, Eddy et al., 1994]. Additionally, even non-fatal occurrences of this injury can result in long-term diminished respiratory function [Kishikawa, Yoshioka, Shimazu et al., 1991]. Miller et al. correlated the percent injured lung to the possibility of developing acute respiratory distress syndrome (ARDS) [2001]. In this study, patients with isolated PC were evaluated, and the percent PC was calculated from computed tomography (CT) scans. The results indicated that if 20% of the lung was injured, the incidence of ARDS sharply increased with 82% of these patients developing ARDS [Miller, Croce, Bee et al., 2001]. The significance of these findings is that the volumetric measurement of PC can predict possible clinical outcomes.
PC is not a well-understood injury. In MVC impact scenarios, the initial injury mechanism is a mechanical insult to the chest. The inflammatory response of the lungs also determines the extent of the injury [Windsor, Mullen and Fowler, 1993; Marshall, 2001]. Due to this secondary response, the ultimate size of the lesion is not maximal until 24 to 48 hours after the impact [Cohn, 1997]. Understanding the effect of the initial response as well as the subsequent inflammatory response is critical in the identification of risk factors that predispose an individual to PC.
Previous studies correlating crash parameters to the possibility of PC have demonstrated that higher severity crashes and crashes involving near-side impact, defined as an impact to the side closest to the occupant, were more likely to result in PC [O'Connor, Kufera, Kerns et al., 2009]. Because this lesion has a delayed onset, knowing which crash factors can predispose a patient to higher volumes of PC could be clinically relevant. The purpose of this study was to correlate the volume of PC to crash parameters using real-world crash data.
METHODS
The Crash Injury Research and Engineering Network (CIREN) database was selected as the data source for this study because it contains extensive medical data in addition to the crash data. CIREN cases are selected from MVC occupants who were admitted to a level 1 trauma center at an enrolling CIREN center. Adult case occupants must sustain an AIS 3 or higher injury to be considered for the study, with limited exceptions for AIS 2 injuries in multiple body regions or injuries of interest to the National Highway Traffic Safety Administration (NHTSA). The focus is on newer model-year vehicles; therefore, the model year must be within six years unless NHTSA grants approval of an older vehicle. Extreme cases with catastrophic impacts, collisions with two severe impacts, large vertical or extended gradient changes, and fire damage are excluded. Different inclusion criteria apply for case occupants 12 years old or younger [NHTSA, 2010].
All cases selected for this study have undergone a full case review with medical, engineering, and crash reconstruction specialists to determine injury causation. Additionally, these cases have medical imaging studies (Digital Imaging and Communications in Medicine, DICOM, data) uploaded to the database. The selection parameters for study inclusion were the presence of PC, a left or right side impact, and the impact on the same side as the occupant (a near-side impact). Near-side impacts were selected because previous studies have found higher instances of PC in side impact and a correlation between the side impacted and the location of the injury [Gayzik, Martin, Gabler et al., 2009].
Subject Identification
CIREN cases between 2005 and 2011 were selected for this analysis and downloaded on January 3rd, 2011. This narrowing by year was necessary because DICOM images were only available for 2005 and later. There were 1657 available cases in this time frame.
Cases with PC were identified by the AIS code. AIS codes used for this include codes from the 1998 and 2008 updates because recent CIREN cases used the new injury coding manual [AAAM, 1998; AAAM, 2008]. The PC codes selected from the 1998 manual were: contusion not further specified (NFS) - 4414023, unilateral PC- 4414063, bilateral PC- 4414104, and flail chest with PC- 4502644. The codes from the 2008 manual were: unilateral PC NFS- 4414062, unilateral minor PC with <1 lobe- 4414072, unilateral major PC ≥ with lobe - 4414083, bilateral PC NFS- 4414103, bilateral minor PC with <1 lobe - 4414113, and bilateral major PC with ≥ 1 lobe in at least one lung - 4414124. Of the 1657 cases, there were 526 PC codes; however, some cases had repeated codes, so the number of cases is lower than the number of PC codes.
Once all PC codes were identified, the next step was determining the location of the impact relative to the occupant. The occupant seat location was compared to the impact location to determine if it was a near-side impact. Only near-side cases (both vehicle-to-vehicle and pole-type impacts) were used for this analysis; this comparison further reduced the number of PC codes to 252. Cases with multiple PC codes were counted as a single case to yield a total of 136 cases of PC in near-side impacts. Incomplete cases in the database were discarded for a total of 104 complete, near-side, PC cases.
Once all cases were identified, the DICOM data were downloaded from the CIREN database and cases without thorax chest CTs were excluded. Additionally, all cases were examined to discard rollovers, cases where the near-side impact was not the cause of the PC, and cases that did not have a “complete” status in the database. The final dataset had 64 cases. All data selection and statistical analysis was performed using JMP software (Version 8, SAS Institute Inc., Cary, NC).
Lung Segmentation
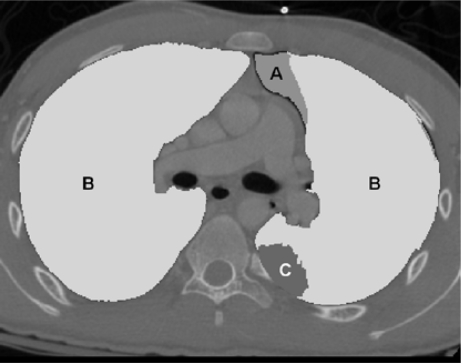
Using the radiologic studies from CIREN case occupants, the percent volume of high attenuation lung was quantified in Mimics (Materialise, Leuven, Belgium) using the method developed by the Virginia Tech / Wake Forest University Center for Injury Biomechanics and described by Weaver et al. [Weaver, Gayzik and Stitzel, 2009]. This semiautomated method of segmentation relies on the difference in Hounsfield units (HU) between air in the lungs and high attenuation injured tissue. Uninjured tissue was clearly delineated, with HU values between −1024 and −562 HU. High attenuation tissue had a HU value greater than −562 and could be caused by various pathologic conditions, including atelectasis, aspiration, or PC. Figures 1, 2, and 3 illustrate the lung as seen on medical imaging, a sample slice of a lung segmentation, and the final three-dimensional reconstruction of the segmentation process. Figure 1 and 3 show similar areas of high attenuation lung tissue.
Figure 1:
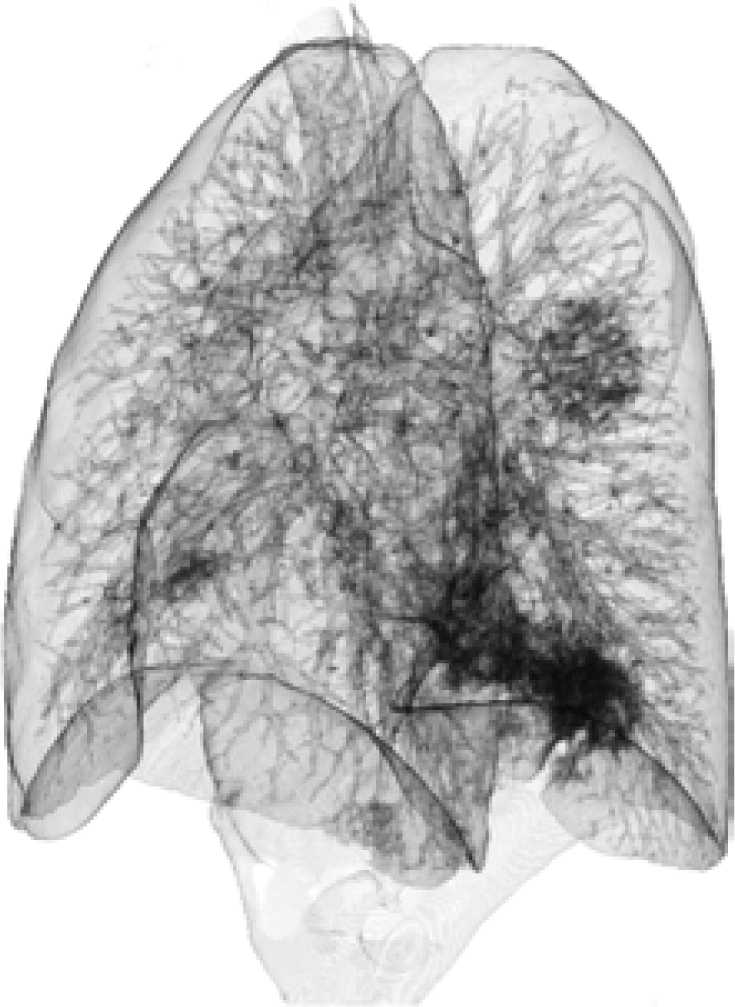
Three-dimensional reconstruction from medical images (oblique view) where the high attenuation tissue is the darker areas within the lung.
Figure 2:
Sample segmentation of the lung tissue on one transverse slice of the CT scan. The area marked A is pneumothorax, B is the healthy lung area, and C is high attenuation lung. The areas highlighted for B and C are also included in the total lung area.
Figure 3:
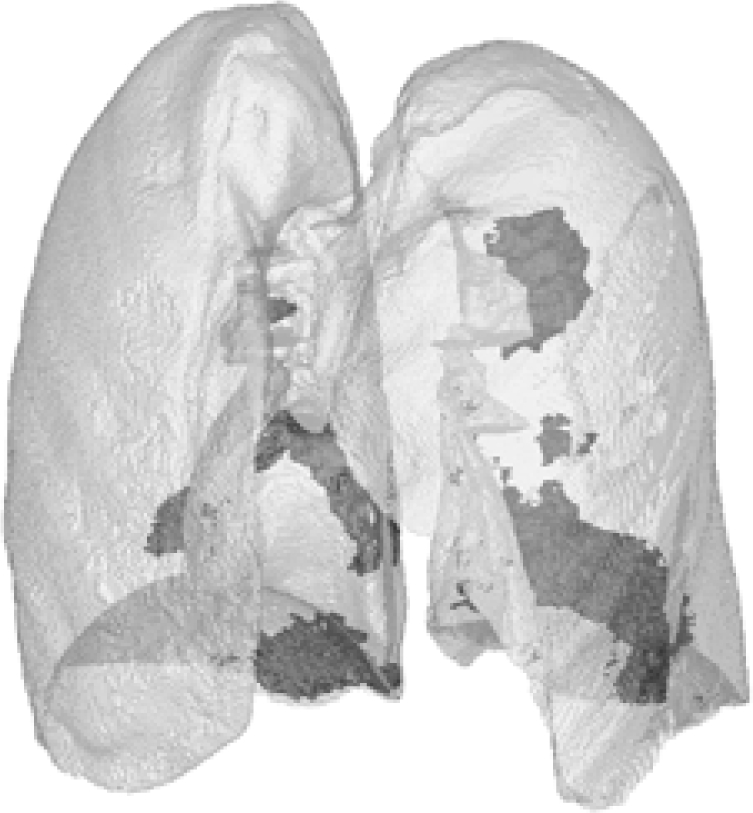
Three-dimensional reconstruction (oblique view) of the same segmentation as Figure 2 with areas of high attenuation shown as darker areas within the lung.
The first step in this process was the selection of pneumothorax and air trapped in the chest wall, when present. This area was automatically selected based on the low HU value of air outside of tissue (HU values −1064 to −855). Next, all lung tissue was selected using the automatic thresholding command in the software. A pixel with HU value of −562 was selected from the healthy lung tissue. This selection was expanded by including all adjacent pixels, starting from the original pixel, with a range of values from −452 to −352 HU. Areas of pneumothorax and trapped air were subtracted from the total lung area. The total lung was manually adjusted to remove areas that were not lung parenchyma, such as large bronchioles and blood vessels at the lung hilum. Additionally, areas of high attenuation tissue within the lung were manually added into the total lung. During this phase of manual segmentation, fluid trapped outside of the lung but within the pleural space was not considered part of the total lung area. Next, the areas of high attenuation lung were identified in a similar fashion, through automatic segmentation followed by manual editing. The automatic range for the high attenuation lung was −562 to 3071 HU. Areas of high attenuation lung within the total lung area were selected and then manually edited to remove blood vessels. The final result was three areas (total lung, healthy lung, and high attenuation lung) on each of the two-dimensional slices of the CT scan (Figure 2). The percent volume of PC was calculated based on the ratio of high attenuation lung to total lung. These volumes can be three-dimensionally displayed, as shown in Figure 3.
Once the initial segmentation was complete, the scans were examined to locate probable locations of PC. A thoracic radiologist evaluated each subject and identified areas of probable PC. While some individuals had areas that could not be positively identified as PC, most had CT evidence that the high attenuation tissue was PC. The evidence considered in identification of PC were the presence of pneumatoceles, high attenuation tissue near rib or spinal fractures, high attenuation tissue that crossed interlobar fissures, and high attenuation tissue along the periphery of lung or in the apical regions [Wagner, Crawford and Schimpf, 1988]. After the areas of PC were identified there were two groups: cases with isolated PC and cases with PC mixed with other lung pathologies. The time from the impact to the CT was considered in the analysis. For this data set, 60 of 64 cases had the scan within the first hospital day.
Crash Parameter Selection and Calculation
All crash parameters were obtained from the CIREN database using the CIREN SQL interface and SQL developer (Oracle, Redwood Shores, CA). The data fields extracted from CIREN that described crash severity were: change in velocity (delta-V), average crush profile values (C1 to C6), average maximum crush, side airbag deployment, energy absorbed, and barrier equivalent speed.
Database parameters that described the occupant and were potential contributing factors to the analysis were: height, weight, gender, age, Injury Severity Score (ISS), and number of rib fractures. In the cases with no delta-V calculation available, the barrier estimate speed was used [NHTSA, 2010].
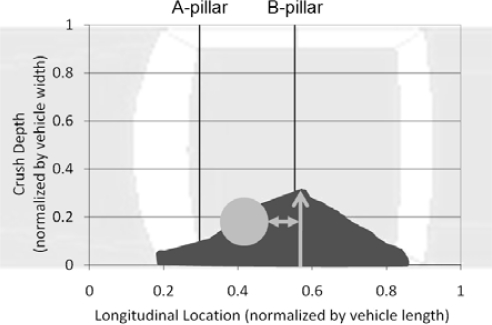
The calculated parameters from the database fields are the area of crush and the location of the max crush relative to the occupant. Area of crush was based on the shape of the crush profile and was calculating by summing the area under the profile. In addition to the area of the crush, the location of the lung in relation to the maximum crush was calculated (Figure 4).
Figure 4:
A sample illustration of the crush metrics. The occupant location is denoted with a grey circle. The black section is the area of the crush as defined by the crush profile data. The gray arrow with the single head is the measured maximum crush. The double headed arrow is the distance from the occupant to the maximum crush location.
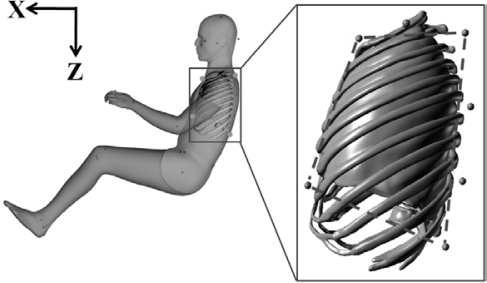
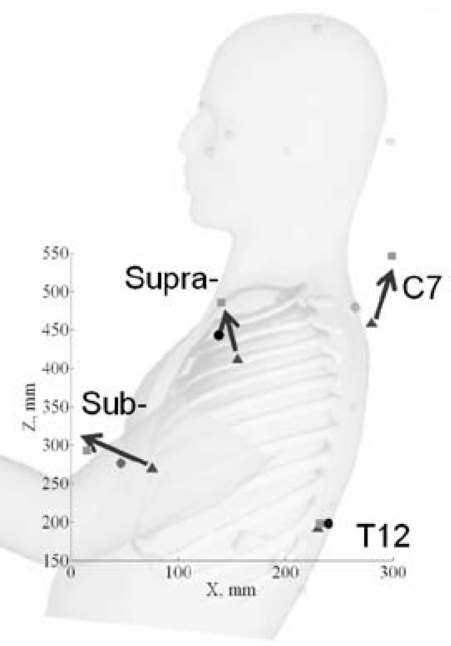
First, the lung location in relation to the vehicle frame of reference was determined. From an existing dataset of Faro arm measurements, point locations bounding the ribcage of six subjects, 3 male and 3 female, selected as representative of the 5th, 50th and 95th percentile individuals were recorded. The points used for this analysis were the suprasternal notch, the bottom of the sternum below the xiphoid process, the spinous process of C7 and the spinous process of T12 as shown in Figure 5 and 6. The points were taken in a driving position and placed in the H-point coordinate system [Moreno, Gayzik, Danelson et al., 2009]. From these data points, a linear regression of x- and z-axis location as a function of occupant height was calculated. Using the linear regression results, these point locations were calculated for the occupants in the study, and the centroid of the occupant lung in the x-z plane was selected as the occupant lung location point.
Figure 5:
The location of the points selected on a model of the average male. The inset box illustrates how these bony structure points bound the lung.
Figure 6:
The point locations for the 5th (triangle), 50th (circle) and 95th (square) male subjects.
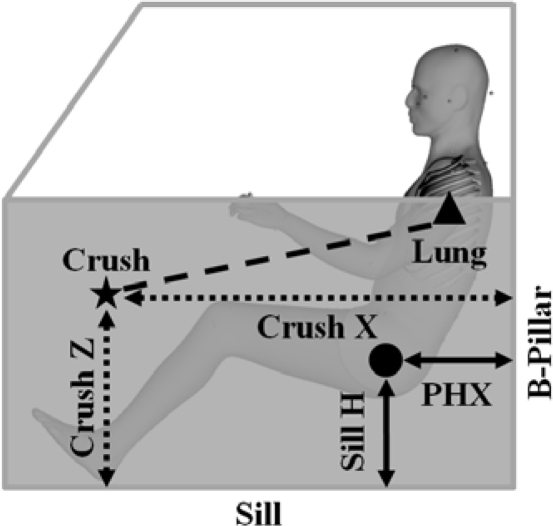
Vehicle test reports and measurements from crush profile pictures were used to determine the location of the maximum crush on the vehicle. For each vehicle, a vehicle test report was downloaded from the NHTSA Vehicle Crash Test Database [NHTSA, 2011]. When the vehicle model or model year was not available, an equivalent model or year was selected using the Sisters and Clones List [Anderson, 2008]. The data recorded from the vehicle test report were: PHX (distance from the occupant H-point to the b-pillar striker), level 1 (vertical distance from the ground to the sill), and level 2 (vertical distance from the ground to the H-point). Level 1 was subtracted from level 2 to get a value for a sill to H-point measurement (Sill H). The relationship between all of these variables is illustrated in Figure 7.
Figure 7:
Illustration of the measurements taken to calculate the occupant’s lung position (triangle, Lung) relative to the maximum crush (star, Crush). The H-point of the occupant is shown with a circle.
Given the relationship between the occupant H-point, sill, and B-pillar, measurements from these vehicle components to the maximum crush location were related to the occupant H-point. For each case, the pictures that visualized the crushed side plane were selected. When possible, the photograph that was perpendicular to the impacted surface was used for the measurements. Using known distances, such as the alternating colors on the c-measurement sticks or the distance between measurements, a cm to pixel ratio was calculated for each picture (ImageJ, Bethesda, MD). Then, the maximum crush location was measured from the B-pillar (Crush X measurement) and the sill (Crush Z measurement). If the impact occurred on a location with a known measurement, such as on the B-pillar or at a scaled location, these known measurements were used instead of the picture measurement technique. Finally, the crush measurement was converted to an x- and z-coordinate in the occupant H-point frame of reference from the known measurements of PHX and Sill H locations. Using the variables from Figure 7, the x-distance from the H-point to the crush was Crush X minus PHX and the z-distance was Crush Z minus Sill H. The Euclidean distance between maximum crush and the centroid of the lung was calculated and recorded as the maximum crush location from the occupant. In the illustration, this distance is the dashed line between the star and the triangle.
Side airbag deployment, occupant age, height, weight, gender, rib fracture, and ISS were included in the analysis because they are postulated to be covariates in the relationship of crash severity and the extent of PC. An analysis of side airbags from NASS was conducted to quantify the possible relationship between air bag deployment and PC incidence. NASS data from 2000 to 2008 was downloaded from the NASS CDS. Near-side cases with a delta-V close to NCAP testing speeds (43 to 63 kph) were selected for analysis. In cases without airbag deployment, the incidence of PC was 2.52%. In comparison, cases with airbag deployment had a PC rate of 2.22%, a 14% decrease. This difference is small; however, the deployment of a side airbag was considered during this analysis.
Height and weight were used to calculate the occupant BMI instead of using height and weight separately in the analysis. The BMI, age, and gender values were used because they can account for some of the variability in chest wall response. The number of rib fractures and ISS data document the overall severity of the occupant’s other injuries.
Statistical Analysis
There were several statistical methods used to fully quantify the results of this study. The first was a general linear model analysis used to develop models that predicted the volume of high attenuation lung or PC based on a crash parameter of interest and a number of contributing variables that described the crash and the occupant. An ANOVA was used to further quantify the relationship between age and the number of rib fractures seen in the study case occupants. Finally, to evaluate how crashes with PC may be different then other crashes, a larger group of near-side crashes from CIREN and NASS were analyzed. Using an ANOVA and a chi-square analysis, CIREN and NASS occupants were split into groups based on PC and chest injury status to compare crash and occupant parameters.
Case Distribution
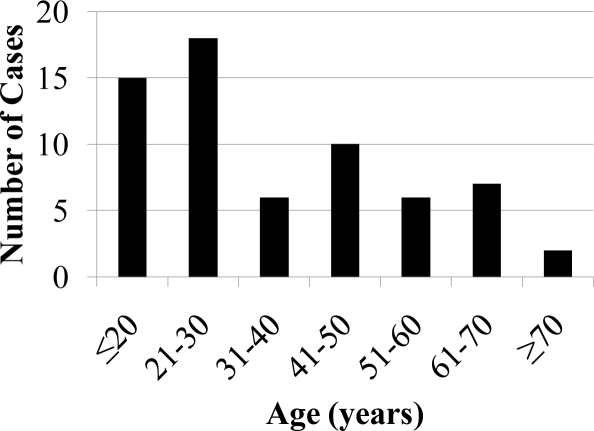
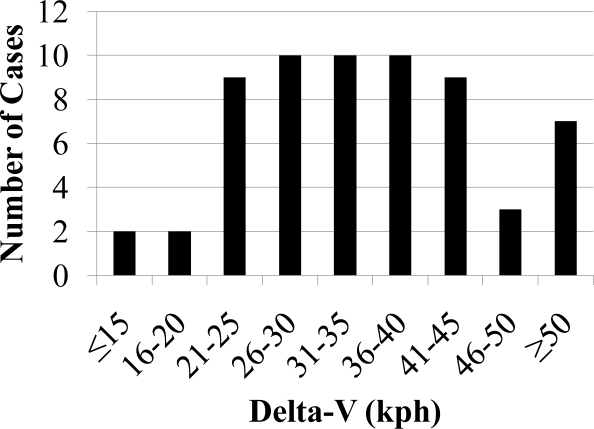
Histograms of the age of the occupants and delta-V of the crash were plotted to illustrate the distribution of the cases.
General Linear Model
Analysis was done using eight general linear models to predict high attenuation lung (four models) and pulmonary contusion (four models), given a specific crash parameter while adjusting for age, side air bag deployment, BMI, gender, rib fractures, and ISS. Of the variables chosen for this analysis, there were four highly correlated independent variables describing crash severity (maximum crush, total area, crush location and energy) that were regressed in separate models. These variables, which will be described as the crash parameter of interest, would have described much of the same variability if included in the same model; therefore, to isolate their effect they were regressed separately. For each model, the independent variables consisted of the crash parameter of interest and all of the contributing variables. For brevity, the model name was based on the crash parameter of interest because this was the only independent variable that changed between the models. For example, the high attenuation lung maximum crush model predicted high attenuation lung percent (%HA) based on maximum crush (Cmax), age (A), side air bag deployment (noSAB), BMI (BMI), gender (F), rib fractures (noRFx), and ISS (ISS). A sample equation for this model, using the variable names in parenthesis and C1–8 as the coefficients derived from the analysis, is shown in equation 1.
| Eqn 1. |
Models with the same independent variables were created separately for high attenuation lung and pulmonary contusion as the dependent variables. The significance of the overall model was assessed using an F-statistic; however, this method did not fully capture the contribution of each of the independent variables. To determine the effect of each variable, a type III sum of squares analysis was completed. This process iteratively assesses each independent variable in the model by removing each parameter then comparing the predictive ability of the reduced model to the full model. A p-value of 0.05 was considered significant.
The total area of crush, crush location (distance from the lung to maximum crush), and age variables were not normally distributed so they were divided into categorical variables based on their distribution. Stem and leaf plots were used to evaluate appropriate ranges for the categories [Altman, 1997]. Other categorical variables, based on the type of data they represent, were: side airbag deployment (yes or no), gender (male or female), and rib fracture (yes or no).
Further Rib Fracture Analysis
The relationship between rib fractures and occupant age was further quantified with an analysis of variance (ANOVA) between rib fracture groups. Age was divided into two groups (<55 and ≥ 55) and the number of rib fractures for each group was compared.
CIREN and NASS Analysis
Finally, a CIREN and NASS analysis was performed to determine if near-side impact cases with PC have significantly different values for the parameters of interest in this study when compared to cases without PC. For the NASS and CIREN analysis, all complete CIREN cases from the data download described previously and NASS cases from 2000 to 2009 were studied. Only near-side crash occupants were included in the analysis. The crash parameters available in both the CIREN and NASS databases were compared across three groups: no chest injury and no PC (chest −, PC −), chest injury and no PC (chest +, PC −), and chest injury and PC (chest +, PC +). There was no group that had no chest injury and PC because PC was a chest injury. The variables selected that were present in both databases were: maximum crush, crush area, delta-V or BES, energy, age, BMI, ISS, and gender. A one-way ANOVA was used to compare the group means. Multiple comparisons between the groups were made using a Bonferroni correction if the ANOVA results were statistically significant. Gender comparisons between groups were performed using a chi-square test.
RESULTS
Case Distribution
There were 64 CIREN cases that met the inclusion criteria for this study. Of these, 12 cases had side airbags that deployed as a result of the crash. Individuals in the dataset tended to be younger, with 50 of the 64 individuals under the age of 55 (Figure 8). The case Delta-V’s covered a wide range of values; however, most were below the range of the NCAP testing speeds (45/64 below 43 kph, with two cases missing a value), as shown in Figure 9.
Figure 8:
Age histogram of the subjects.
Figure 9:
Delta-V distribution of the selected crashes.
Regression Analysis
Categorical Variables
The initial analysis of the variable distribution indicated total area, crush location and age were not normally distributed. Therefore, these variables were converted to categorical variables with cutoffs based on their distribution. Crush location was divided into two groups: <90 cm and ≥90 cm. Total area and age were each divided into three groups: <5000 cm2, 5000–8000 cm2, >8000 cm2 and <30 years, 30–55 years, >55 years. The reference groups for these variables are: age >55 years, crush area >8000 cm2, and crush location ≥90 cm. In addition, side airbag deployment, male, and rib fracture are also reference groups.
High Attenuation Lung Results
To evaluate how the crash parameter of interest (maximum crush, total area, crush location and energy) influenced the overall model, the type III sum of squares analysis was used. The results of the regression analysis demonstrated that maximum crush was the only crash parameter that approached significance as a predictor of the percent of high attenuation lung as part of the model. For this model, the maximum crush variable had a p-value of 0.052 from the type III sum of squares analysis. The overall model significance of the maximum crush model, while adjusting for all occupant parameters, was 0.012. Table 1 lists the overall model p-value, the R2 value and the type III sum of squares p-value for the crash parameters of interest within the regression models. This table has data for both the high attenuation lung and pulmonary contusion results.
Table 1:
Crash parameter significance results from the general linear model analysis. The type III sum of squares analysis evaluates the full model with the crash variable of interest (annotated as the model name) then re-evaluates the model without this variable to determine the effect of adding the parameter.
| High Attenuation Lung Models | Pulmonary Contusion Models | |||||
|---|---|---|---|---|---|---|
| Model Name | Overall model, p-value | Model R2 value | Type III sum of squares, p-value | Overall model, p-value | Model R2 value | Type III sum of squares, p-value |
| Maximum Crush | 0.012 | 0.347 | 0.052 | 0.011 | 0.526 | 0.383 |
| Crush Area | 0.034 | 0.323 | 0.277 | 0.021 | 0.527 | 0.676 |
| Crush Location | 0.050 | 0.287 | 0.947 | 0.004 | 0.568 | 0.086 |
| Energy | 0.017 | 0.333 | 0.091 | 0.008 | 0.542 | 0.210 |
The contributing variables assessed in all of the multiple regression models had few cases with statistical significance from the sum of squares analysis. The only one that achieved significance was ISS in the models for the crush area and crush location crash parameters. The R2 values for the overall multiple regression models ranged from 0.28 to 0.34. To illustrate the resulting model, equation 2 is the model with the coefficient values calculated for the maximum crush model (as shown in equation 1.). Additionally, equation 3 is a sample solution for the model with data from one of the cases in the dataset: maximum crush = 31, age = 48 (A1 = 0, A2 = 1), side airbag = No (noSAB = 1), BMI = 23, female = yes (F=1), rib fracture = yes (noRFx = 0), ISS = 22. The calculated percent of high attenuation lung for this occupant is 0.13 and the actual value was 0.11. The overall model p-values, model R2 values, and variable p-values are in the Appendix in Table A1. The variable coefficients are listed in Table A2.
| Eqn 2. |
| Eqn 3. |
Pulmonary Contusion Results
The resulting dataset for the pulmonary contusion analysis was smaller than the high attenuation lung analysis. After a careful review, 42 of the 64 cases were considered to have isolated PC. The rest of the cases had PC potentially masked by overlapping fluid from other pathologies. From the type III sum of squares analysis of the individual crash parameters, no crash parameter variable approached statistical significance in the prediction of the percent of pulmonary contusion. The crash variable with the lowest p-value was crush location with a value of 0.086. The overall significance of this model was 0.0042. The p-values and R2 results for the pulmonary contusion cases are also listed in Table 1.
Of the contributing variables, only BMI had significant p-values from the sum of squares analysis. This variable was significant for all crash parameter models. The R2 values of the overall models for pulmonary contusion were higher than the high attenuation lung models with a range 0.53 to 0.56. The complete model results are included in the Appendix as Table A3. The variable coefficients are listed in Table A4.
Rib Fracture Analysis
Individuals without rib fractures had a mean age of 28.15 ± 15.55 compared to the mean age of occupants with rib fractures of 39.32 ± 18.72. These means were significantly different with a p-value of 0.0165. Using an age cut-off of 55 years, occupants below this age had 2.77 ± 3.01 fractures. The mean number of rib fractures in occupants above this age was 6.5 ± 4.19 and was significantly different with a p-value of 0.0115.
CIREN Analysis
The CIREN ANOVA results had significant differences between the variable means for all of the analyzed variables except energy. Because energy had no significant difference from the ANOVA, an analysis of group mean differences was not conducted. The resulting means and group comparison p-values are listed in Table 2 and 4, respectively. The chi-square test indicated no significant difference in the number of males and females.
Table 2:
Mean values for the three chest injury groups from the CIREN database.
| PC− and Chest Injury− | PC− and Chest Injury+ | PC+ and Chest Injury+ | |
|---|---|---|---|
| Maximum Crush | 44.39 cm | 44.02 cm | 50.35 cm |
| Crush Area | 4305.44 cm2 | 4636.58 cm2 | 5530.31 cm2 |
| DV/BES | 29.24 kph | 30.21 kph | 34.78 kph |
| Energy | 77.80 kJ | 70.22 kJ | 91.26 kJ |
| Age | 31.83 years | 46.54 years | 34.62 years |
| BMI | 24 kg/m2 | 27 kg/m2 | 26 kg/m2 |
| ISS | 15.89 | 24.29 | 32.34 |
| Male : Female | 0.93:1 | 0.72:1 | 1.02:1 |
Table 4:
P-Values for PC group comparisons using the CIREN and NASS databases.
| CIREN P-values | NASS P-values | |||||||
|---|---|---|---|---|---|---|---|---|
| Overall | chest (−) to chest(+), PC(−) | chest (−) to chest(+), PC(+) | chest(+), PC(−) to chest (+), PC(+) | Overall | chest (−) to chest(+), PC(−) | chest (−) to chest(+), PC(+) | chest(+), PC(−) to chest (+), PC(+) | |
| Cmax | 0.020 | 1 | 0.067 | 0.036 | <0.001 | <0.001 | <0.001 | <0.001 |
| Crush area | 0.002 | 1 | 0.002 | 0.027 | <0.001 | <0.001 | <0.001 | <0.001 |
| DV/BES | 0.004 | 1 | 0.008 | 0.026 | <0.001 | <0.001 | <0.001 | <0.001 |
| Energy | 0.091 | <0.001 | <0.001 | <0.001 | <0.001 | |||
| Age | <0.001 | <0.001 | 1 | <0.001 | <0.001 | <0.001 | 0.161 | 0.006 |
| BMI | 0.0187 | 0.0147 | 0.508 | 0.386 | 0.008 | 0.006 | 1 | 0.968 |
| ISS | <0.001 | <0.001 | <0.001 | <0.001 | <0.001 | <0.001 | <0.001 | <0.001 |
Chest (−) to Chest (+), PC (−)
For the comparison of the no chest injury to the chest injury with no PC group, there were significant differences in the mean values for age, BMI and ISS.
Chest (−) to Chest (+), PC (+)
For the comparison of no injury to PC, there were significant differences between the groups for the crush area, delta-V or barrier equivalent speed, and ISS.
Chest (+), PC (−) to Chest (+), PC (+)
In the comparison of chest injury cases with and without PC, all variables were significantly different except BMI.
NASS Analysis
There were significant differences between the means of all NASS variables analyzed using ANOVA. The between group means also demonstrated significant difference between all variables and all groups except age and BMI in the Chest (−) to Chest (+), PC (+) groups and BMI in the Chest (+), PC (−) to Chest (+), PC (+) groups. All group means, overall p-values and group comparison p-values are listed in Table 3 and 4. From the chi-square test, there were significantly more males in the NASS database.
Table 3:
Mean values for the three chest injury groups from the NASS database.
| PC− and Chest Injury− | PC− and Chest Injury+ | PC+ and Chest Injury+ | |
|---|---|---|---|
| Maximum Crush | 20.38 cm | 30.22 cm | 47.45 cm |
| Crush Area | 1885.37 cm2 | 3564.34 cm2 | 6448.19 cm2 |
| DV/BES | 16.35 kph | 23.30 kph | 35.43 kph |
| Energy | 26.28 kJ | 50.96 kJ | 107.77 kJ |
| Age | 33.67 years | 42.76 years | 37.03 years |
| BMI | 26 kg/m2 | 26 kg/m2 | 26 kg/m2 |
| ISS | 0.82 | 7.24 | 25.66 |
| Male : Female | 1.13:1 | 1.03:1 | 1.572:1 |
DISCUSSION
This study correlated vehicle crash data from the CIREN database to the quantified volume of injury calculated from medical imaging studies. The maximum crush on the vehicle was the best predictor of the volume of high attenuation lung. The crush location was the best predictor of the volume of isolated pulmonary contusion.
Average maximum crush was selected as a measure of door intrusion. This variable was correlated to the incidence of PC in previous studies [Tencer, Kaufman, Mack et al., 2005]. Intrusions into the occupant compartment in a pole impact can cause antero-lateral loading of the chest resulting in frequent unilateral chest injuries, including PC [Pintar, Maiman and Yoganandan, 2007]. That study also demonstrated that the proximity of the occupant relative to crush was correlated to a high rate of thoracic trauma in side pole crashes. This measure is similar to the crush location metric presented in the current study that showed the best predictive ability for isolated pulmonary contusion volume.
The PC cases selected for this analysis were generally younger, which agrees with previous findings [O'Connor et al., 2009]. Compared to occupants without chest injury, PC cases were slightly older in the NASS and CIREN databases. This comparison includes the chest injury and PC group individuals with rib fractures and PC. This difference in age could reflect elderly individuals who were involved in severe side crashes that sustained a large number of injuries. In contrast, the cases with thoracic injury and no PC had a higher mean age than with PC. This comparison supports previous studies that have shown that younger individuals get pulmonary contusion more often than older individuals.
The rib fracture analysis demonstrated that occupants with rib fractures were older and older occupants had more fractures. Stitzel et al. identified age thresholds associated with increased mortality of PC [2010]. Other studies have also demonstrated the increased likelihood of injuries in older individuals [Kent, Trowbridge, Lopez-Valdes et al., 2009]. There is also evidence that older individuals have a different ribcage geometry [Gayzik, Yu, Danelson et al., 2008] and bone material properties [Burstein, Reilly and Martens, 1976; Zioupos and Currey, 1998]. All of these findings illustrate how an elderly occupant is pre-disposed to rib fractures in a severe MVC.
The CIREN and NASS analysis evaluated how the parameters examined in this study could differ in cases without PC. Overall, the higher mean values and significant differences between these means suggest that cases with pulmonary contusion were more severe than cases without PC or chest injury. There were fewer differences between the means of occupant characteristics suggesting that measures of crash severity would be the best way to evaluate an occupant’s risk of PC.
One of the limitations of this study is the manual component of the segmentation process that could introduce variability into the volume data. For this analysis, three individuals conducted all segmentation. Two researchers completed 58 of the scans and one researcher completed six scans; however, the same individual checked and modified all completed segmentations prior to volume data collection. Therefore, there is limited inter-observer variability in this study. An intra-observer study was conducted with three scans repeated after a time interval of two weeks. Selection of the higher attenuation tissue demonstrated more variability than the total lung area. The difference between the total lung volumes, expressed as a percentage of the first lung segmentation volume, was 1.7 ± 2.5%. The difference between the high attenuation tissue segmentations, as a percent of the first total lung volume, was 4.3 ± 1.6%.
Similarly, the manual identification of pulmonary contusion introduced some subjectivity into the results of the study. To mitigate this variation, an experienced radiologist specializing in thoracic CT identified the areas of pulmonary contusion. This individual reviewed all of the scans for this study, so there was no inter-observer variability. Also, the areas of high attenuation lung identified with automatic thresholding techniques were used as the basis for the segmentation. Additional areas were added to the mask in 2 of the 64 cases. Cases with extensive aspiration and atelectasis were excluded to prevent masking of the PC by other fluid within the lung.
Another limitation was the method to determine the distance between the occupant and the maximum crush. The location of the lung was approximated based on the occupant’s height, a standard sitting position was assumed, and measurements were made on a vehicle after deformation during a crash. All of these assumptions and measurements introduced some error into the distance calculation. However, the crush on these vehicles was extensive, with an average Field-L value of 233.6 ± 61 cm. In comparison, a small distance between the occupant and the crush ranged from 15 to 30 cm, approximately 2% to 13% of the total Field-L. While there was a single maximum crush location recorded, often that depth of crush was distributed over a wide area. Due to these distributed impact forces, the distance calculation described here is a good estimate of the occupant location in relation to the crush. Very large values indicated that the impacting object was striking far to the front or rear of the occupant. These locations would have limited the occupant interaction with intruding components. In contrast, a small crush location would indicate the occupant would have been exposed to an intruding component close to the thorax. Therefore, even though the measurement techniques introduced some error into locating the crush in relation to the occupant, the error is small when compared to the overall magnitude of the crush on these vehicles.
There are limitations for both the NASS and CIREN databases used in this analysis. The weighted NASS data represents a population-based sample; however, it lacks the detailed injury information necessary for this analysis. The CIREN database has the injury information needed; however, it is skewed because it captures only severely injured vehicle occupants. Additionally, some subjectivity was introduced into the crash parameter data collected during crash reconstruction measurements. This variation was mitigated through the standardized data collection methods described in the CIREN manual. Neither database has extensive physiological data describing the inflammatory responses following PC.
Future work will determine the location of PC in these patients, using a lung atlas for co-registration. To put the segmented trauma scans in the same coordinate system as the atlas, rigid and affine registration transformations will be used to morph the trauma scan to the atlas space. This morphing will allow better comparisons of lesion location among individuals in the study.
With a well-quantified mechanical insult and a volumetric analysis of the resulting injury, these cases can be implemented in future studies to better predict PC following MVC. Previous studies on simulating side impact have demonstrated the applicability of this methodology to determine finite element metrics for aortic injury [Siegel, Belwadi, Smith et al., 2010]. The impact parameters, such as PDOF and delta-V, will be used as model inputs in future studies. The crush metrics investigated and developed for this study will be used to verify the impact crush of the vehicle models in the simulation. The model occupant’s lungs can be investigated to determine finite element metrics that would accurately predict the location and distribution of PC. Previous studies have demonstrated the ability of finite element metrics to predict lesion location in animal models of injury [Stitzel, Gayzik, Hoth et al., 2005; Gayzik, Hoth, Daly et al., 2007; Gayzik, Hoth and Stitzel, 2011]. A finite element approach to understanding this injury could yield a model-based injury criterion for PC. This model would facilitate the identification of the types of crashes that could result in high volumes of PC.
CONCLUSION
In this study, crash parameters from near-side impacts were correlated with the resulting percent volume of high attenuation lung and PC in vehicle occupants. As part of a general linear model analysis, maximum crush was the best predictor of the volume of high attenuation lung. Crush location best predicted PC volume. This study developed a methodology to examine crush parameters and correlate them to the extent of pulmonary contusion in real-world cases. Future work will apply these techniques to finite element modeling of CIREN cases.
Acknowledgments
Funding was provided by the Department of Defense. Elizabeth Armstrong performed segmentations of the pulmonary contusion. Work was also performed for the Crash Injury Research and Engineering Network (CIREN) Project at Wake Forest School of Medicine in cooperation with the United States Department of Transportation/National Highway Traffic Safety Administration (USDOT/NHTSA). Funding has been provided by the National Highway Traffic Safety Administration under Cooperative Agreement Number DTNH22-10-H-00294. Views expressed are those of the authors and do not represent the views of any of the sponsors or NHTSA.
APPENDIX
Table A1:
Model results for predicting the volume of high attenuation lung tissue. Significant results (p-value < 0.05) are highlighted in light gray.
| Model Name | Overall Model P-value | R2 | P-values | ||||||
|---|---|---|---|---|---|---|---|---|---|
| Crush Variable | Age | SAB | Gender | BMI | Rib Fracture | ISS | |||
| Maximum Crush | 0.012 | 0.347 | 0.052 | 0.111 | 0.434 | 0.893 | 0.299 | 0.336 | 0.127 |
| Crush Area | 0.034 | 0.323 | 0.277 | 0.333 | 0.676 | 0.632 | 0.149 | 0.650 | 0.039 |
| Crush Location | 0.050 | 0.287 | 0.978 | 0.391 | 0.676 | 0.951 | 0.192 | 0.713 | 0.026 |
| Energy | 0.017 | 0.333 | 0.091 | 0.192 | 0.881 | 0.710 | 0.131 | 0.378 | 0.080 |
Table A2:
Model coefficients for the high attenuation lung regressions with the following groups (grp.) with reference groups annotated with (R): age1, <30 years; age 2, 30–55 years; age 3, >55 years (R); crush area 1, <5000 cm2; crush area 2, 5000–8000 cm2; crush area 3, >8000 cm2 (R); crush location 1, <90 cm; crush location 2, ≥90 cm (R). In addition, side airbag deployment (SAB), male, and rib fracture are also reference groups. These groups all have a coefficient of zero. Energy was divided by 100,000 for the analysis. Inter is the intercept.
| Crush Variable | Age | No SAB | Female | BMI | No Rib | ISS | Inter. | |||
|---|---|---|---|---|---|---|---|---|---|---|
| Model | Grp. 1 | Grp.2 | Grp. 1 | Grp. 2 | ||||||
| Max. Crush | 0.003 | −0.115 | −0.084 | −0.037 | −0.005 | 0.004 | −0.044 | 0.003 | 0.002 | |
| Crush Area | −0.083 | −0.093 | −0.082 | −0.048 | −0.020 | −0.019 | 0.005 | −0.021 | 0.004 | 0.101 |
| Crush Location | 0.001 | −0.074 | −0.043 | −0.020 | −0.002 | 0.005 | −0.017 | 0.004 | 0.015 | |
| Energy | 0.064 | −0.093 | −0.077 | −0.007 | −0.014 | 0.005 | −0.041 | 0.003 | −0.008 | |
Table A3:
Model results for predicting the volume of high pulmonary contusion. Significant results (p-value < 0.05) are highlighted in light gray.
| Model Name | Overall Model P-value | R2 | P-values | ||||||
|---|---|---|---|---|---|---|---|---|---|
| Crush Variable | Age | SAB | Gender | BMI | Rib Fracture | ISS | |||
| Maximum Crush | 0.011 | 0.526 | 0.383 | 0.967 | 0.876 | 0.481 | 0.036 | 0.333 | 0.250 |
| Crush Area | 0.021 | 0.527 | 0.676 | 0.915 | 0.914 | 0.464 | 0.027 | 0.465 | 0.347 |
| Crush Location | 0.004 | 0.568 | 0.086 | 0.933 | 0.800 | 0.436 | 0.014 | 0.262 | 0.144 |
| Energy | 0.008 | 0.542 | 0.210 | 0.982 | 0.900 | 0.439 | 0.033 | 0.312 | 0.191 |
Table A4:
Model coefficients for the high attenuation lung regressions with the following groups (grp.) with reference groups annotated with (R): age 1, <30 years; age 2, 30–55 years; age 3, >55 years (R); crush area 1, <5000 cm2; crush area 2, 5000–8000 cm2; crush area 3, >8000 cm2 (R); crush location 1, <90 cm; crush location 2, ≥90 cm (R). In addition, side airbag deployment (SAB), male, and rib fracture are also reference groups. These groups all have a coefficient of zero. Energy was divided by 100,000 for the analysis. Inter is the intercept.
| Crush Variable | Age | No SAB | Female | BMI | No Rib | ISS | Inter. | |||
|---|---|---|---|---|---|---|---|---|---|---|
| Model | Grp. 1 | Grp.2 | Grp. 1 | Grp. 2 | ||||||
| Max. Crush | 0.001 | 0.009 | 0.014 | 0.008 | −0.025 | 0.009 | −0.047 | 0.002 | −0.246 | |
| Crush Area | −0.034 | 0.0002 | 0.003 | 0.018 | 0.006 | −0.027 | 0.010 | −0.036 | 0.002 | −0.204 |
| Crush Location | 0.073 | 0.018 | 0.019 | 0.013 | −0.026 | 0.010 | −0.051 | 0.002 | −0.296 | |
| Energy | 0.043 | 0.004 | 0.009 | 0.007 | −0.027 | 0.009 | −0.047 | 0.002 | −0.230 | |
REFERENCES
- AAAM . Abbreviated Injury Scale. Des Plains, IL: Association for the Advancement of Automotive Medicine, Committee on Injury Scaling; 1998. 1998 Revision (AIS-98), [Google Scholar]
- AAAM Gennarelli TA, Wodzin E. Abbreviated Injury Scale. Barrington, IL: Association for the Advancement of Automotive Medicine, Committee on Injury Scaling; 2008. 2008 Revision. [Google Scholar]
- Allen GS, Coates NE. Pulmonary contusion: a collective review. Am Surg. 1996;62(11):895–900. [PubMed] [Google Scholar]
- Altman D. Practical Statistics for Medical Research. London: Chapman & Hall; 1997. [Google Scholar]
- Anderson GC. Vehicle Year & Model Interchange List. Madison, WI: 2008. (Sisters & Clones), [Google Scholar]
- Burstein AH, Reilly DT, Martens M. Aging of bone tissue: mechanical properties. J Bone Joint Surg Am. 1976;58(1):82–6. [PubMed] [Google Scholar]
- Clark GC, Schecter WP, Trunkey DD. Variables affecting outcome in blunt chest trauma: flail chest vs. pulmonary contusion. J Trauma. 1988;28(3):298–304. doi: 10.1097/00005373-198803000-00004. [DOI] [PubMed] [Google Scholar]
- Cohn SM. Pulmonary contusion: review of the clinical entity. J Trauma. 1997;42(5):973–9. doi: 10.1097/00005373-199705000-00033. [DOI] [PubMed] [Google Scholar]
- Gayzik FS, Hoth JJ, Daly M, et al. A finite element-based injury metric for pulmonary contusion: Investigation of candidate metrics through correlation with computed tomography. Stapp Car Crash J. 2007;51:189–209. doi: 10.4271/2007-22-0009. [DOI] [PubMed] [Google Scholar]
- Gayzik FS, Hoth JJ, Stitzel JD. Finite element-based injury metrics for pulmonary contusion via concurrent model optimization. Biomech Model Mechanobiol. 2011;10(4):505–20. doi: 10.1007/s10237-010-0251-5. [DOI] [PubMed] [Google Scholar]
- Gayzik FS, Martin RS, Gabler HC, et al. Characterization of crash-induced thoracic loading resulting in pulmonary contusion. J Trauma. 2009;66(3):840–9. doi: 10.1097/TA.0b013e318186251e. [DOI] [PubMed] [Google Scholar]
- Gayzik FS, Yu MM, Danelson KA, et al. Quantification of age-related shape change of the human rib cage through geometric morphometrics. J Biomech. 2008;41(7):1545–54. doi: 10.1016/j.jbiomech.2008.02.006. [DOI] [PubMed] [Google Scholar]
- Hoff SJ, Shotts SD, Eddy VA, et al. Outcome of isolated pulmonary contusion in blunt trauma patients. Am Surg. 1994;60(2):138–42. [PubMed] [Google Scholar]
- Kent R, Trowbridge M, Lopez-Valdes FJ, et al. How many people are injured and killed as a result of aging? Frailty, fragility, and the elderly risk-exposure tradeoff assessed via a risk saturation model. Ann Adv Automot Med. 2009;53:41–50. [PMC free article] [PubMed] [Google Scholar]
- Kishikawa M, Yoshioka T, Shimazu T, et al. Pulmonary contusion causes long-term respiratory dysfunction with decreased functional residual capacity. J Trauma. 1991;31(9):1203–8. doi: 10.1097/00005373-199109000-00002. discussion 1208–10, [DOI] [PubMed] [Google Scholar]
- Marshall JC. Inflammation, coagulopathy, and the pathogenesis of multiple organ dysfunction syndrome. Crit Care Med. 2001;29(7 Suppl):S99–106. doi: 10.1097/00003246-200107001-00032. [DOI] [PubMed] [Google Scholar]
- Miller PR, Croce MA, Bee TK, et al. ARDS after pulmonary contusion: accurate measurement of contusion volume identifies high-risk patients. J Trauma. 2001;51(2):223–8. doi: 10.1097/00005373-200108000-00003. discussion 229–30, [DOI] [PubMed] [Google Scholar]
- Moreno DM, Gayzik FS, Danelson KA, et al. Anthropometric landmark and external contour development for human body finite element modeling; BMES Conference; Pittsburg, PA. 2009. [Google Scholar]
- NHTSA . Crash Injury Research Engineering Network Coding Manual, Version 2.0. Department of Transportation; 2010. [Google Scholar]
- NHTSA NHTSA Vehicle Crash Test Database. 2011. Available online at http://www-nrd.nhtsa.dot.gov/database/veh/veh.htm (Accessed 14 Mar 2011)
- O'Connor JV, Kufera JA, Kerns TJ, et al. Crash and occupant predictors of pulmonary contusion. J Trauma. 2009;66(4):1091–5. doi: 10.1097/TA.0b013e318164d097. [DOI] [PubMed] [Google Scholar]
- Pintar FA, Maiman DJ, Yoganandan N. Injury patterns in side pole crashes. Annu Proc Assoc Adv Automot Med. 2007;51:419–33. [PMC free article] [PubMed] [Google Scholar]
- Shorr RM, Crittenden M, Indeck M, et al. Blunt thoracic trauma. Analysis of 515 patients. Ann Surg. 1987;206(2):200–5. doi: 10.1097/00000658-198708000-00013. [DOI] [PMC free article] [PubMed] [Google Scholar]
- Siegel JH, Belwadi A, Smith JA, et al. Analysis of the mechanism of lateral impact aortic isthmus disruption in real-life motor vehicle crashes using a computer-based finite element numeric model: with simulation of prevention strategies. J Trauma. 2010;68(6):1375–95. doi: 10.1097/TA.0b013e3181dcd42d. [DOI] [PubMed] [Google Scholar]
- Stitzel JD, Gayzik FS, Hoth JJ, et al. Development of a finite element-based injury metric for pulmonary contusion part I: model development and validation. Stapp Car Crash J. 2005;49:271–89. doi: 10.4271/2005-22-0013. [DOI] [PubMed] [Google Scholar]
- Stitzel JD, Kilgo PD, Weaver AA, et al. Age thresholds for increased mortality of predominant crash induced thoracic injuries. Ann Adv Automot Med. 2010;54:41–50. [PMC free article] [PubMed] [Google Scholar]
- Tencer AF, Kaufman R, Mack C, et al. Factors affecting pelvic and thoracic forces in near-side impact crashes: a study of US-NCAP, NASS, and CIREN data. Accid Anal Prev. 2005;37(2):287–93. doi: 10.1016/j.aap.2004.09.005. [DOI] [PubMed] [Google Scholar]
- Wagner RB, Crawford WO, Jr, Schimpf PP. Classification of parenchymal injuries of the lung. Radiology. 1988;167(1):77–82. doi: 10.1148/radiology.167.1.3347751. [DOI] [PubMed] [Google Scholar]
- Weaver AA, Gayzik FS, Stitzel JD. Biomechanical analysis of pulmonary contusion in motor vehicle crash victims: a crash injury research and engineering network (ciren) study - biomed 2009. Biomed Sci Instrum. 2009;45:364–9. [PubMed] [Google Scholar]
- Windsor AC, Mullen PG, Fowler AA. Acute lung injury: what have we learned from animal models? Am J Med Sci. 1993;306(2):111–6. doi: 10.1097/00000441-199308000-00010. [DOI] [PubMed] [Google Scholar]
- Zioupos P, Currey JD. Changes in the stiffness, strength, and toughness of human cortical bone with age. Bone. 1998;22(1):57–66. doi: 10.1016/s8756-3282(97)00228-7. [DOI] [PubMed] [Google Scholar]


