

Background: Myostatin is a strong inhibitor of muscle growth and a therapeutic target for the treatment of muscle wasting.
Results: Follistatin-like 3, a myostatin inhibitor, interacts uniquely with myostatin as compared with other ligands through its N-terminal domain.
Conclusion: The N-terminal domains of follistatin-type molecules may be specificity determinants in ligand binding.
Significance: Follistatin-type molecules form unique, specific interactions with different TGF-β family ligands.
Keywords: Activin, Protein Complexes, Signaling, Structural Biology, Transforming Growth Factor Beta (TGFbeta), Antagonism, Follistatin, Myostatin
Abstract
TGF-β family ligands are involved in a variety of critical physiological processes. For instance, the TGF-β ligand myostatin is a staunch negative regulator of muscle growth and a therapeutic target for muscle-wasting disorders. Therefore, it is important to understand the molecular mechanisms of TGF-β family regulation. One form of regulation is through inhibition by extracellular antagonists such as the follistatin (Fst)-type proteins. Myostatin is tightly controlled by Fst-like 3 (Fstl3), which is the only Fst-type molecule that has been identified in the serum bound to myostatin. Here, we present the crystal structure of myostatin in complex with Fstl3. The structure reveals that the N-terminal domain (ND) of Fstl3 interacts uniquely with myostatin as compared with activin A, because it utilizes different surfaces on the ligand. This results in conformational differences in the ND of Fstl3 that alter its position in the type I receptor-binding site of the ligand. We also show that single point mutations in the ND of Fstl3 are detrimental to ligand binding, whereas corresponding mutations in Fst have little effect. Overall, we have shown that the NDs of Fst-type molecules exhibit distinctive modes of ligand binding, which may affect overall affinity of ligand·Fst-type protein complexes.
Introduction
The follistatin (Fst)-type3 family contains members such as Fst-like 3 (Fstl3) and Fst, multi-domain proteins that are robust inhibitors of select TGF-β family ligands. Fstl3 was initially discovered as a molecule involved in leukemia (1), whereas Fst, including isoforms Fst288 and Fst315, was originally identified as an inhibitor of follicle-stimulating hormone release (2). Proper control of TGF-β family ligands by Fst-type molecules is significant to life, because Fst-deficient mice exhibit a multitude of defects and die within hours of birth (3). Fstl3 knock-out in mice is not lethal but leads to a variety of metabolic phenotypes (4). More recently, Fstl3 expression in cardiac myocytes has been shown to be necessary for the full development of cardiac hypertrophy (5). The severity of the effects of these Fst-type molecule deletions seems to inversely correlate with the specificity of the molecule deleted, because Fst is a more broad antagonist, whereas Fstl3 is narrower in scope and binds relatively fewer TGF-β family ligands (6). For these reasons, it is important to resolve the mechanisms of inhibition and elucidate how Fst-type antagonists similarly and differentially regulate ligands.
The TGF-β family of extracellular signaling molecules can generally be subdivided into three classes: bone morphogenetic protein (BMP)/growth and differentiation factor, activin/inhibin, and TGF-β (7). These ligands exhibit a common fold consisting of two monomers coming together in an anti-parallel fashion to form a disulfide-linked dimer with four distinct surfaces: two convex type II receptor-binding sites on the β sheet or “finger” region and two concave type I receptor-binding sites composed of the “fingertip” and major helix or “wrist” region (Fig. 1A). This surface also contains the prehelix loop, a structural feature important for type I receptor specificity (8–12). Ligands initiate signaling by binding two type I and two type II transmembrane serine/threonine kinase receptors at the cell surface. Signaling is controlled in the extracellular space by a variety of antagonists. Activin class ligands are tightly regulated by Fst-type molecules and include the structurally related activin A and myostatin (40% sequence identity). Activin A is important to a variety of physiological processes including reproduction, metabolism, and immunity (Ref. 13; reviewed in Ref. 14). Myostatin, also known as growth and differentiation factor-8, is a highly conserved, strong inhibitor of muscle growth (Ref. 15; reviewed in Ref. 16). As such, it is an attractive target for the rational development of therapeutics for the treatment of muscle-wasting diseases (reviewed in Ref. 17), including muscular dystrophy, sarcopenia, and cachexia (18–20). One such means of targeting has been through the use of modified Fst proteins (21, 22).
FIGURE 1.
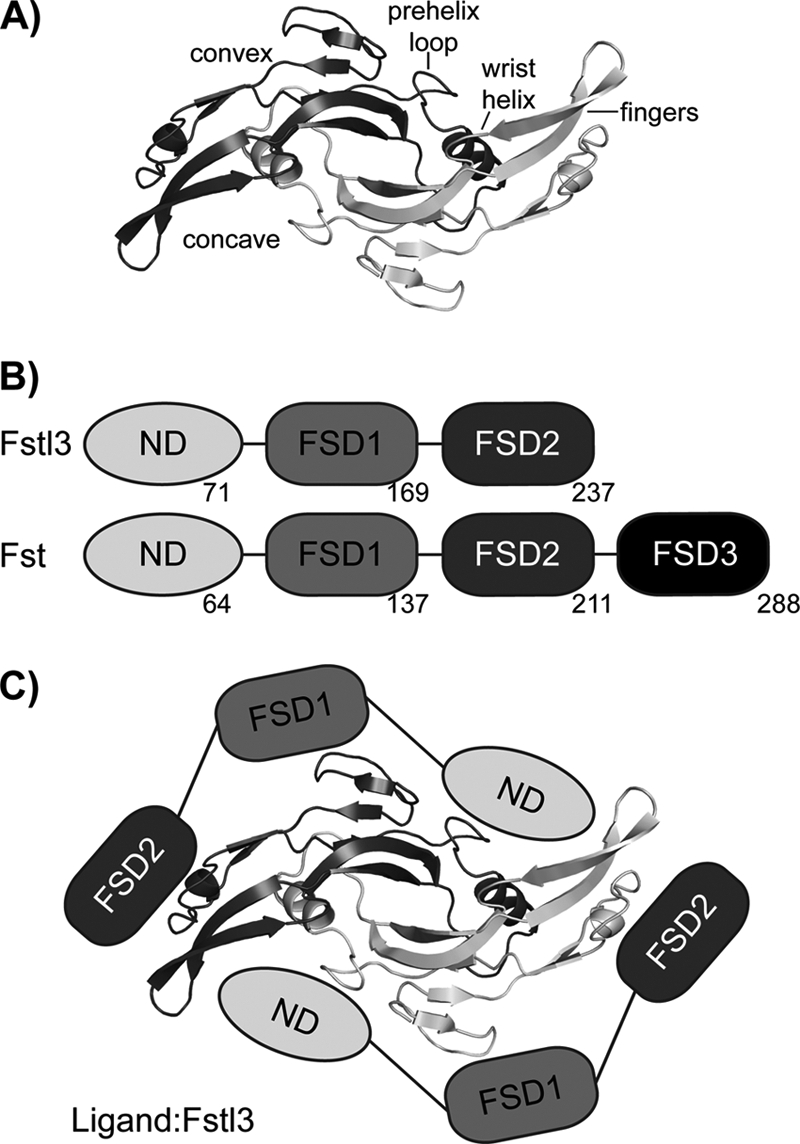
TGF-β and Fst-type protein family architecture and interaction. A, TGF-β family ligands form disulfide-bonded dimers with distinct architectural features, as labeled. Myostatin is shown as a representative. B, Fst and Fstl3 domain layout with the last residue of each domain shown. C, schematic of Fstl3 binding to ligand. The ND blocks the concave type I receptor-binding site, whereas FSD1 and FSD2 bind the convex type II receptor-binding site.
Fst-type proteins have distinct domain layouts (Fig. 1B). Fst contains an N-terminal domain (ND) followed by three follistatin domains (FSD1–3), as well as a heparin-binding sequence located in FSD1 (23). Here, Fst will refer to the isoform Fst288 unless otherwise noted. Fstl3 has a similar domain layout but lacks FSD3 and heparin binding (24). Comparing Fst and Fstl3, there is 48% sequence identity between FSD1 and FSD2 and 24% between the ND (25). Serum availability of Fst-type proteins inversely correlates with strength of heparin binding, and myostatin·Fstl3 is the only myostatin·Fst-type complex that has been identified in serum (26). We have previously shown that binding to myostatin greatly increases the affinity of Fst for heparin (12), suggesting that once Fst is bound to myostatin, it may tightly bind to cell surface-bound heparan. Structural studies have determined that, to antagonize signaling, two Fst-type molecules surround one ligand, effectively blocking all four receptor-binding sites (Fig. 1C) (12, 25, 27–29). With Fst, there are also additional contacts between the ND of one molecule and FSD3 of the other (28).
Fst-type molecules differentially bind classes of TGF-β ligands; Fst binds well (low nanomolar KD) to the activin class and moderately to certain BMP class members, whereas Fstl3 binds well to the activin class only (6, 30). Several studies have investigated this divergence and the importance of different domains to ligand binding, sometimes with conflicting results on which domains are necessary or sufficient for antagonism (29, 31–34). Although variability in results could be due to assay limitations and whether experiments were analytical or biological in context, altogether the data demonstrate that the details of Fst antagonism are complex and likely cannot be pinpointed exclusively to one domain over another. Additionally, few of these studies have been done with myostatin, and to our knowledge, no similar studies have been carried out with Fstl3. This reveals the need for more comprehensive biochemical studies directed by structural data to further probe the molecular details of these interactions. These studies are necessary to fully understand which features are important for both general ligand inhibition and specificity in ligand antagonism. More recently, significant gaps in this knowledge have been filled by the structural data of multiple ligand·Fst-type protein complexes (12, 25, 27–29). These data have allowed comparisons of different complexes to elucidate sources of specificity in binding. Here, we impart a more complete analysis by presenting the structure of myostatin·Fstl3.
Our study has focused on the importance of the ND to ligand antagonism and the diversity that occurs at this interface. The Fstl3 ND interacts uniquely with myostatin as compared with activin A, because it utilizes different surfaces on the ligand and exhibits a tilt in the main binding helix, altering its placement in the type I receptor-binding site. Additionally, point mutation to glutamate or alanine of single hydrophobic residues in the ND of Fstl3 successfully disrupts ligand binding, whereas corresponding mutations in the Fst ND have little effect.
EXPERIMENTAL PROCEDURES
Constructs
Human Fst and Fstl3 were cloned into the pcDNA3.1/myc-His expression vector (Invitrogen) as described previously (32, 34) and subsequently used as templates for site-directed mutagenesis to generate point mutants. For crystallization, a truncated Fstl3 construct containing residues 10–218 was generated. The Fst signal sequence was cloned into the pcDNA3.1/myc-His vector encoding Fstl3 (25), leading to the shortened N-terminal Gly-Val-Cys sequence identical to Fst. At the C terminus, FSD2 was followed directly by the thrombin site and the myc-His sequence, omitting the acidic 19-residue C-terminal extension.
Protein Purification and Complex Formation
CHO cells overexpressing myostatin (15, 35) were kindly provided by Dr. Se-Jin Lee and used to make conditioned medium. Myostatin was purified as previously described (36). Wild-type and altered myc-His-tagged Fst-type proteins were produced and purified as previously described (25). For crystallization, thrombin was used to remove the tag from the truncated Fstl3 construct. Activin A was produced and purified as previously described (28, 37). The myostatin·Fstl3 complex was formed by adding myostatin to an excess of Fstl3 (at least 1:3 molar ratio) and incubating for 1 h. Complex was purified on a Superdex 200 column (Amersham Biosciences) in a buffer of 20 mm HEPES, pH 7.5, 150 mm NaCl. The column was run at 1 ml/min, and samples were pooled from a peak with an elution position midway between 171 and 67 kDa. Tagged Fst-type proteins were quantified by a C-terminal myc tag solution phase assay (34).
Myostatin·Fstl3 Complex Crystal Structure Determination
The purified complex of myostatin·Fstl3 in 20 mm HEPES, pH 7.5, 150 mm NaCl was concentrated to 2.9 mg/ml and mixed 1:1 in a hanging drop experiment with a well solution containing 127.5 mm potassium thiocyanate and 12.5% PEG 3350. Crystals were frozen in mother liquor increased to 40% PEG 3350 plus 100 mm malonate. Diffraction experiments were performed at the Argonne National Laboratory Advanced Photon Source GM/CA-CAT 23ID beamline. The data were integrated and scaled to 2.4 Å resolution using HKL2000 (38). Molecular replacement using PHASER (39) and one myostatin monomer (Protein Data Bank code 3HH2) and one Fstl3 molecule (Protein Data Bank code 3B4V) as search models were used to locate the position of one half complex of myostatin·Fstl3 in the asymmetric unit. Myostatin residues 26–32 and Fstl3 residues 49–65 were removed from the initial search model to avoid bias in these areas. The atomic coordinates were refined using REFMAC (40) along with repeated rounds of model building with COOT (41). Positional displacement of each chain was described by one (myostatin monomer) and three (Fstl3) translation/libration/screw groups that were identified by the TLSMD server (42). The data collection and refinement statistics are shown in supplemental Table S1. An example of the electron density showing the Fstl3 ND helix region is presented in supplemental Fig. S1. Structural alignments and root mean square deviation calculations were performed using COOT. The coordinates and structure factors have been deposited in the Protein Data Bank with the identifier 3SEK. Buried surface area calculations were done using the Monster webserver (43). Shape complementarity was calculated using the program SC (44). Ramachandran plot statistics were calculated using MolProbity (45). Structure figures were rendered using PyMOL (46).
Generation of a HEK293 (CAGA)12 Stable Cell Line
A plasmid containing a PGK-neomycin cassette inserted into the pGL3-(CAGA)12-luciferase reporter construct (47) in the same orientation as the promoter using SalI/XhoI was generously provided by Dr. Alexandra McPherron. This construct was digested with SalI, gel-purified, and transfected into HEK293 cells that were ∼50% confluent in a 6-well plate using TransIT-LT1 transfection reagent (Mirus). Clonal selection was carried out in DMEM plus Pen-Strep, 10% FBS, and 100 μg/ml G418. A stable cell line (HEK293-CAGA) was derived by selecting the best clone based on the highest response to 0.8 ng of activin A in a 96-well plate (protocol below).
Luciferase Reporter Assays
HEK293-CAGA cells were plated at 0.2 × 10⁶ cells/well on a poly-d-lysine-coated 96-well plate (Greiner) and grown ∼24 h. Growth medium was removed, and 100 μl of complex preformed in serum-free medium was added and incubated for 18 h. Activin A or myostatin (R & D Systems) was used at 1.6 ng/well. The medium was then removed, and the cells were lysed in 20 μl of passive lysis buffer (Promega). The lysates were transferred to 96-well IsoPlates (PerkinElmer Life Sciences) and mixed with 40 μl of luciferase assay substrate (Promega), and luminescence was recorded immediately in an EnVision plate reader (PerkinElmer Life Sciences).
Radiolabel Binding Assays
Binding of altered Fst-type proteins to labeled activin A was determined by competition assay as described (48). Relative potencies were calculated by comparison of half-maximal inhibition of labeled activin A binding by altered and wild-type Fstl3 or Fst. The experimental binding data are shown in supplemental Fig. S2.
Surface Plasmon Resonance
Surface plasmon resonance (SPR) measurements were carried out in HBS-EP buffer (10 mm HEPES, pH 7.4, 150 mm NaCl, 3 mm EDTA, 0.005% P-20 surfactant (BIAcore AB)) on a BIAcore 3000 optical biosensor system operated with BIAevaluation 4.1 software. Activin A and myostatin ligands were immobilized on a CM4 research grade sensor chip (BIAcore AB) by amine coupling chemistry using the manufacturer's protocol at 25 °C (333 response units for activin A and 366 RU for myostatin). For myostatin·Fstl3 experiments, myostatin was immobilized on a CM5 sensor chip by amine coupling chemistry at 25 °C to enhance the signal to noise (2785 RU). For kinetic measurements, Fst, Fstl3, and their mutants (analytes) were dissolved in HBS-EP buffer in 2-fold dilution series and applied to the immobilized ligands at a flow rate of 20 μl/min. Protein was injected for an association time of 3 min, and then dissociation was monitored for 20 min. After each measurement, the chip surface was typically regenerated with four 15-μl pulses of 2 m guanidine HCl at a flow rate of 100 μl/min. SPR sensorgrams were globally analyzed using a distribution model for continuous affinity and rate constant analysis with the program EVILFIT (50). For the activin A-Fst interactions, to describe the data with limited mass transport, the kinetic traces were globally fitted with a distribution model combined with a two-compartment approximation of mass transport (51, 52).
RESULTS
Structure of the Myostatin·Fstl3 Complex
The structure of the myostatin·Fstl3 complex has been determined to 2.4 Å resolution. The asymmetric unit consisted of one half of the full complex centered on a 2-fold crystallographic axis. A disulfide bond with a symmetry mate creates the biological unit. For complex crystallization, an Fstl3 construct containing residues 10–218 was used, because N- and C-terminal residues outside this range were not observed in the activin A·Fstl3 structure, presumably because of the flexibility of these regions. This aided crystallization, and the truncated version was shown to be fully active in a luciferase reporter assay (data not shown). Overall, the structure reveals that the myostatin dimer is bound by two Fstl3 molecules, similar to previously determined Fst-type complexes, burying a total of 2832 Å2 at the interface (Fig. 2A) (12, 25, 27–29). FSD1 and FSD2 of one Fstl3 molecule contact one monomer of myostatin and cover the convex type II receptor-binding site (type II site), whereas the ND contacts both monomers and plugs the concave type I receptor-binding site (type I site). Because the overall mode of antagonist binding is similar to other Fst-type structures, it is best to describe the myostatin·Fstl3 complex through cross-comparison with the previously reported structures of activin A·Fstl3, activin A·Fst, and myostatin·Fst (12, 25, 28). We have also compared myostatin in this Fstl3 complex with that in the Fst complex, the only other available myostatin structure (12).
FIGURE 2.

Structure of myostatin·Fstl3. A, the myostatin·Fstl3 complex. Myostatin (green) is surrounded by two molecules of Fstl3 (red and gray). For clarity, Fstl3 ND and FSD1 have been removed in the side view (left panel). Bottom-up view of the complex with the individual Fstl3 domains labeled (right panel). B, comparison of myostatin dimers in the Fst and Fstl3 complexes (3HH2; Ref. 12). Monomer B is aligned. Distance measurements were taken from the Cα of Lys-90 (green dot) in the fingertip of one myostatin monomer to the other in each complex, and the change in distance was found to be 4.3 Å. C, comparison of buried surface area at the dimer interface in the myostatin·Fstl3 (top panel) and myostatin·Fst (bottom panel) complexes. Panels are shown from the side view. The total buried surface area on one monomer at the dimer interface is shown in the upper right corner. Residues are labeled in the upper panel. Myostatin residues that are buried more at the dimer interface in the Fst complex are highlighted in red in the lower panel with the difference in buried surface area on a per residue basis listed in parentheses.
Changes in the Overall Myostatin Structure and Dimer Interface
Although all TGF-β family ligands have exhibited the common familial architecture, differences in overall conformation have been observed when comparing the same ligand in different structures (25, 27–29, 37, 53, 54). Myostatin also displays differences in dimer conformation when bound to either Fstl3 or Fst. Overall, myostatin in the Fstl3 complex exhibits a less compressed shape as compared with the Fst complex, with 907 Å2 versus 1005 Å2, respectively, buried on each monomer at the myostatin dimer interface (Fig. 2B, monomer A) (12). The ligand fingertip extends in the Fstl3 complex, creating a more open type I site and exposing residues on the fingertip and wrist helix (Fig. 2, B and C). A major difference is in the side chain of Phe-27, which adopts an alternate rotamer and points toward instead of away from Trp-29 (Fig. 2C). The fingertip extension could best be described as an “uncurling” of the fingertips, because the rest of the monomer remains relatively unchanged (Figs. 2B, monomer B, and 3B, curved arrows). This uncurling results in an overall dimer extension of 4.3 Å when measuring the distance between the Cα of Lys-90 on monomer A to that on monomer B and comparing the difference between the two dimers (Fig. 2B). This difference appears to be due to the unique positioning of the ND of Fstl3.
FIGURE 3.

Differences in the conformation and placement of the ND. A, comparison of the Fstl3 ND in the myostatin and activin A complexes. FSD1 and FSD2 are aligned. The inset is viewed by rotating the ND down 90° and depicts the displacement of the main ND helix. B–E, cross-comparisons of the ND helix placement in the four complexes (3HH2 (12), 2B0U (28), and 3B4V (25)). Ligand monomer opposite the ND helix is aligned in each panel and viewed from the bottom up. Structures are shown from the same perspective and colored according to the name key in the bottom left of each panel. FT, fingertip; NDH, ND helix; PH, prehelix; WH, wrist helix. The curved arrows in B highlight the “uncurling” of the myostatin fingertips in comparing the two myostatin complexes. The arrows in B and C highlight the tilt of the Fstl3 ND helix, whereas those in D and E highlight the inward shift of the Fst ND helix in the myostatin complex.
The N-terminal Domains of Fst-type Molecules Form Alternate Interactions with Ligands
The ND of Fstl3 binds the type I site of myostatin, interacting with both myostatin monomers through hydrophobic and hydrogen bonding interactions. Historically, the greatest differences in comparing Fst-type complexes have been seen at this interface (12, 25, 27, 28). The same holds true for the myostatin·Fstl3 complex. In addition to the fingertip and wrist regions, the ND also interacts with the prehelix loop of myostatin, forming a hydrophobic interface (supplemental Fig. S3). This interaction is not observed in the activin A·Fstl3 complex, because the prehelix loop is disordered (25).
The Fstl3 differences between the myostatin and activin A complexes can easily be seen by aligning FSD1 and FSD2 (Fig. 3A). This shows a large change in the position of the main ND helix. These changes are not so much due to a hinge region following the ND as is seen in Fst (12) but more due to a conformational change in the ND and a resulting shift in the tilt of the ND helix. Superimposing the Cα atoms of the ND of Fstl3 in the two complexes results in an root mean square deviation of 1.5 as compared with 1.1 for the ND of Fst in the corresponding complexes.
Not only is the conformation of the Fstl3 ND different when bound to each ligand, but the position of the ND relative to ligand is also distinctive. In fact, the position of the ND and the main helix that interacts with ligand is quite unique when comparing all four Fst-type complexes (Fig. 3, B–E, and supplemental Fig. S4). Previous structures have shown differences in the inward shift of the Fst ND and helix geometry altered to a more tightly wound state (Fig. 3, D and E, arrows) (Ref. 25; detailed in Ref. 12). However, the positional change in the myostatin·Fstl3 ND helix is more drastic (Fig. 3, B and C, arrows, and supplemental Fig. S4B). Compared with Fstl3 in the activin A complex, the N-terminal end of the helix swings away from the fingertip and inward to interact with the wrist region of myostatin (Figs. 3C and 4, A and B). This results in a change of ∼21° in the tilt of the helix (measured from the positional change of the center of mass of the helix using Cα of Leu-61 as a static reference point). Interestingly, there is a highly conserved hydrogen bond between ligand Tyr-86/Tyr-93 and the backbone of Fstl3 Leu-61 that seems to act as a pivot point in this interface (Fig. 4, A and B, schematic). Hydrogen bonding between the N terminus of the ND helix (Asn-53 and Asn-56) and the myostatin wrist helix (His-59) and prehelix loop (Tyr-55), respectively, lock in this distinctly angled position (Fig. 4A). In contrast, in the activin A·Fstl3 complex, there is no interaction with the wrist helix, because Fstl3 Asn-53 adopts an alternate rotamer to hydrogen bond with Trp-25 of the activin A fingertip. There are instead more interactions with the activin A finger and fingertip region (Fig. 4B). This is similar to the myostatin·Fst complex where the ND helix only interacts with the fingertip region, with the hydrogen bond pivot point between myostatin Tyr-86 and Fst Phe-52 conserved (Fig. 4C). Here, Fst Asn-44 forms a hydrogen bond with Gly-28 of the myostatin fingertip instead of interacting with the wrist helix as seen with Asn-53 of Fstl3 (Fig. 4, A and C). It is interesting to note that the greatest difference in ND helix placement is observed when comparing the activin A·Fst and myostatin·Fstl3 complexes, whereas the most similar placement is seen in the activin A·Fstl3 and myostatin·Fst complexes (supplemental Fig. S4).
FIGURE 4.

Interactions of the ND helix and ligands. A–D, comparison of the hydrogen bond and salt bridge interactions between the ND helix region and ligand in each complex, which is labeled in the bottom left corner of each panel (3HH2 (12), 2B0U (28), and 3B4V (25)). Structures are colored according to the name key in the bottom left with two shades representing individual ligand monomers. Interacting ligand residues are highlighted in orange. The dashed lines represent hydrogen bonds and salt bridges. Structures are shown from the same side view perspective. Shape complementarity (Sc) values of the ND and ligand are shown in each panel. The conserved interaction (with the exception of activin A-Fst) between ligand Tyr-86/Tyr-93 and the backbone of Fst-type molecule Leu-61/Phe-52 is shown. This acts as a pivot point for Fstl3, allowing the N-terminal end of the ND helix to swing toward the wrist helix of myostatin or fingertip of activin A. This is illustrated schematically in the upper right corners of A and B.
The above comparisons indicate that the Fstl3 ND does not seem to be more suited to bind one ligand over the other. In further support of this, the shape complementarity value of the ligand-ND interface is 0.67 for the myostatin complex and 0.69 for the activin A complex, indicating that the goodness of fit between the ND and ligand in the two complexes is approximately equal (Fig. 4, A and B) (44). This is in stark contrast to the Fst complexes where the corresponding shape complementarity values for myostatin and activin A are 0.75 and 0.5, respectively, indicating that the ND of Fst interacts much more advantageously with myostatin than activin A (12).
Point Mutations in the N-terminal Domain Are More Detrimental to Fstl3 than Fst
Extensive structural data suggest that the substantial hydrophobic interface between ligand and the ND of Fst-type molecules (supplemental Fig. S3) is important to binding. In fact, >58% of the total buried surface area on the ND in each complex is contributed by hydrophobic residues (supplemental Fig. S5). Despite this observation, few biochemical data exist on how important this hydrophobic interface is to binding, particularly with respect to either myostatin or Fstl3. The importance of this interface is partially supported in that removing the ND from Fst reduces ligand binding to <5% (33, 34) and that point mutation of some hydrophobic residues can interfere with binding to activin A (34). Contrary to this, mutation of select hydrophobic activin A residues in the type I receptor-binding site was shown not to significantly alter Fst binding (31). To begin to more thoroughly investigate this question with regards to Fst and Fstl3 and their interaction with myostatin and activin A, we created a series of point mutations in hydrophobic ND residues of Fst-type molecules and tested ligand binding and activity. Although several residues appear to be important to binding, we specifically focused on those that appear to be equally important for binding to both myostatin and activin A and that are in similar positions in the Fst and Fstl3 complexes. Selection criteria included hydrophobic residues that are buried by 50–100 Å2/residue in both complexes for each Fst-type protein. A comparison of the buried surface area on each ND residue is provided in supplemental Fig. S5. Also, structural comparisons have shown that Phe-60 (Fstl3) and Phe-47 (Fst) mimic Phe-85 of the type I BMP receptor IA in complex with ligand (25), implying their importance to binding. Four hydrophobic residues that correspond between Fst and Fstl3 were chosen for mutation (Fig. 5A). In attempt to disrupt binding of the ND helix, we mutated these select residues to glutamates. Replacing key hydrophobic residues with charged residues at interaction interfaces has previously been shown to be an effective method for disrupting protein-protein interactions (49, 55, 56).
FIGURE 5.

Analysis of the effects of ND point mutations on inhibition of ligands. A, the ligand-ND interface in each complex showing the Fst-type residues that were mutated for luciferase reporter assays (3HH2 (12), 2B0U (28), and 3B4V (25)). Hydrophobic residues were selected as described in the text. Corresponding residues between Fst and Fstl3 are indicated by color coordination of the background of the residue labels. The ND helix residues of Fstl3 complexes are in comparable positions (left two panels), whereas the ND helix of Fst undergoes a conformational rearrangement to reposition side chains depending on which ligand is bound (right two panels). B–E, luciferase reporter assays with myostatin and activin A titrating in either wild-type or ND point mutant Fstl3 or Fst. Line colors correspond to residue label background colors in A. One representative experiment (of a minimum of two repeats) is shown in each panel. The dotted lines in D and E show the approximate IC50 values. The error bars represent ± S.D.
As shown in Table 1, results from our radiolabeled activin A competition binding assay (48) demonstrate that Fstl3 point mutations are more detrimental to activin A binding than those in Fst. Mutants L57E and L61E bind with an ∼20–30-fold decrease in activin A affinity. F60E showed an ∼6.5-fold decrease, whereas L24E was similar to wild type. In contrast, ND point mutations in Fst had much less of an effect with most potencies comparable with wild type. Therefore, although we were successful in disrupting the ligand-ND interface with Fstl3, Fst remained unaffected.
TABLE 1.
Comparative radiolabeled activin A binding activity of ND point mutants
The errors are represented as the values ± S.D.
| Binding activity | |
|---|---|
| Fstl3 | |
| WT | 1.00 |
| L24E | 0.98 ± 0.09 |
| L57E | 0.05 ± 0.03 |
| F60E | 0.15 ± 0.06 |
| L61E | 0.03 ± 0.02 |
| Fst | |
| WT | 1.00 |
| V15E | 0.64 ± 0.16 |
| F47E | 0.46 ± 0.05 |
| I51E | 0.65 ± 0.12 |
| F52E | 1.01 ± 0.11 |
To further investigate ND susceptibility in a more biological context, we tested these point mutants (Fig. 5A) in a luciferase reporter assay with both activin A and myostatin. We enhanced the reproducibility and sensitivity of the assay to effectively test activin class ligand inhibition by antagonists (47). The assay shows an ∼150-fold response to activin A with a Z-score of 0.76 (when performed as described under “Experimental Procedures”). The results of the luciferase reporter assay corroborated the activin A binding assay, and trends were similar between activin A and myostatin. As shown in Fig. 5 (B and C), Fstl3 point mutations L57E and L61E greatly reduce antagonist activity, especially with regards to myostatin inhibition. In fact, concentrations of these mutants above physiological relevance were not enough to elicit myostatin inhibition. F60E has a moderate effect on inhibition, whereas L24E is again similar to wild type. In comparison, corresponding mutations in Fst have much less of an effect on ligand inhibition (Fig. 5, D and E). As with Fstl3, Fst ND point mutations affect myostatin more than activin A binding. This is shown in that point mutant IC50 values are increased to a greater extent for myostatin than activin A (Fig. 5, D and E, dotted lines). These results demonstrate that single point mutations in the ND can decrease the biological activity of Fstl3 but have little effect on Fst.
Analysis of Fst-type Molecule Affinities for Ligands Using Surface Plasmon Resonance
Equilibrium dissociation constant (KD) values for wild-type and point mutant Fst-type proteins were determined using SPR kinetic analysis (Fig. 6, Table 2, and supplemental Figs. S6–S9). Importantly, to ensure consistency, experiments comparing binding of a particular Fst-type construct and its mutants to a particular ligand were performed on the same SPR chip. Therefore, the KD fold over wild type is internally controlled with respect to ligand coupling. As shown in Table 2, the KD values of Fstl3 glutamate mutants L57E, F60E, and L61E binding to either myostatin or activin A are significantly increased by 2 orders of magnitude or more. This result correlates well with both our radiolabeled activin A binding and luciferase assays. In fact, it is apparent by visual inspection of the SPR sensorgrams that the dissociation rates of Fstl3 mutants from ligands are significantly increased as compared with wild type (Fig. 6 and supplemental Figs. S6–S9). In contrast, corresponding mutations in Fst had little effect on ligand binding, although myostatin binding was somewhat more affected than that of activin A, which corroborates our luciferase assays. This is also readily apparent by examination of the dissociation phase on the SPR sensorgrams, which show that Fst mutant dissociation from ligand remains exceptionally slow.
FIGURE 6.

Quantitative SPR measurements of WT and select point mutant Fst-type molecules binding to myostatin and activin A. Sensorgrams obtained as WT and altered Fst-type molecules were injected over a CM4 or CM5 sensor chip coupled with myostatin and activin A. Traces shown in black correspond to measurements of a 2-fold serial dilution over the concentration range shown in the upper right corner of each sensorgram. Red curves correspond to global fits of each data set to a model as described under “Experimental Procedures” using the program EVILFIT. Binding constants are shown in Table 2.
TABLE 2.
Binding constants for Fst-type molecules to ligands determined through SPR
| Surface | Analyte |
|||||
|---|---|---|---|---|---|---|
| Fstl3 | KD | -Fold over WT | Fst | KD | -Fold over WT | |
| nm | nm | |||||
| Myostatin | WT | 1.3 | 1.0 | WT | 6.3 | 1.0 |
| L24E | 170 | 131 | V15E | 20 | 3.2 | |
| L57E | 2400 | 1846 | F47E | 21 | 3.3 | |
| F60E | 2400 | 1846 | I51E | 27 | 4.3 | |
| L61E | 1600 | 1231 | F52E | 25 | 4.0 | |
| L57A | 120 | 92 | F47A | 59 | 9.4 | |
| F60A | 56 | 43 | I51A | 21 | 3.3 | |
| L61A | 410 | 315 | F52A | 54 | 8.6 | |
| Activin A | WT | 0.14 | 1.0 | WT | 0.02 | 1.0 |
| L24E | 0.56 | 4.0 | V15E | 0.02 | 1.0 | |
| L57E | 150 | 1071 | F47E | 0.04 | 2.0 | |
| F60E | 98 | 700 | I51E | 0.03 | 1.5 | |
| L61E | 140 | 1000 | F52E | 0.02 | 1.0 | |
| L57A | 59 | 421 | F47A | 0.05 | 2.5 | |
| F60A | 93 | 664 | I51A | 0.02 | 1.0 | |
| L61A | 43 | 307 | F52A | 0.02 | 1.0 | |
Our mutagenesis data up to this point support that Fstl3 ND point mutations L57E, F60E, and L61E disrupt ligand binding, whereas corresponding Fst mutations have little effect. It is possible that glutamate mutations are only detrimental to Fstl3 binding because of an unexpected electrostatic interaction. Although unlikely because each residue is buried inside the hydrophobic interface, we addressed this possibility by making the corresponding alanine mutations in both Fst and Fstl3. In agreement with the Fstl3 glutamate mutants, the Fstl3 alanine mutants are also negatively affected in ligand binding, albeit usually to a lesser degree (Table 2). Again, Fst binding was relatively unaffected by alanine mutations. This demonstrates that point mutations in the ND of Fstl3 are detrimental to binding, whereas Fst is able to accommodate residues of different sizes as well as negative charge substitutions.
DISCUSSION
In this study, we determined the structure of myostatin·Fstl3 and found that the Fstl3 ND forms distinctive interactions with myostatin. We show that point mutations in the ND of Fstl3 are more detrimental to function than corresponding Fst mutations. Altogether, this work has led to further insights into the importance of the NDs of Fst-type molecules and the molecular details of how ligand inhibition is achieved.
Multi-structure analysis of Fst-type complexes has shown both how two different antagonists bind a particular ligand and how a particular antagonist can bind two different ligands (12, 25). Our study presented here allowed a more extensive cross-comparison of ligand·Fst-type protein complexes, revealing how Fst-type molecules can use alternate modes of interaction through their NDs to inhibit activin class ligands. This showed that there are differences in how Fst and Fstl3 are able to bind different ligands. As compared with activin A, when Fst binds myostatin, there is a conformational difference and a simple inward shift of the ND helix, as well as additional interactions that are formed (Fig. 3D, arrow) (12). In contrast, when Fstl3 binds myostatin, there is no change in the helix conformation but a major shift in the tilt of the ND helix, forming interactions with myostatin through its wrist and prehelix loop and activin A through its fingertip region (Figs. 3, A and C, arrow, and 4, A and B). These observations, along with similar shape complementarity values, imply that the ND of Fstl3 is not particularly suited to bind one ligand over the other yet forms a specialized interaction with each. Multi-ligand binding by Fst is accomplished through a different mechanism, because ND helix flexibility allows rearrangements and a better fit with myostatin. Although it is possible that crystal contacts may influence the apparent molecular models of these complexes, it is difficult to assess their effects because only one structure of each complex has been determined. However, our biochemical data presented here support the findings from our analysis of the structures.
Our structural findings show that the ND, particularly the helix region, of Fstl3 forms unique interactions with ligands. Despite this, residues of the Fstl3 ND helix are in relatively the same position on the helix in each complex (Fig. 5A and supplemental Fig. S10). This is in contrast to the Fst ND helix, where residues undergo rearrangement upon binding to either ligand (12). This implies that Fst may be able to accommodate residue changes more readily than Fstl3, in which the unaltered conformation of the ND helix suggests a nonaccommodating nature. This hypothesis is supported by our findings that point mutations in the Fstl3 ND are debilitating to Fstl3 but have little effect on Fst antagonism (Fig. 5, A–C and Tables 1 and 2). Furthermore, rigidity of the Fstl3 ND helix may explain the lower affinity of Fstl3 for myostatin as compared with activin A. Because activin A is more flexible (25, 27–29, 37, 54), it may better accommodate the rigid Fstl3 ND, whereas binding an inflexible myostatin may be less favorable. In fact, BMPs, which are also inflexible, may not be able to accommodate the rigid Fstl3 ND helix at all, possibly explaining why Fstl3 has little to no affinity for the BMP class. Alternatively, it could simply be due to a difference in interactions at that interface. It would be interesting to determine the structure of a BMP·Fst-type complex for comparison, because it is difficult to predict what the ligand-ND interface would resemble because of the variability of Fst-type molecules at this interface.
Numerous studies have investigated the importance of Fst domains to ligand antagonism, some with discrepant results (29, 31–34). Our finding here that the ND of Fst is relatively resistant to point mutations is supported in that mutating activin A residues at the type I site has little effect on Fst binding (31). Although the overall effect of mutations is minimal, myostatin seems to be more affected by Fst ND point mutations than activin A. This suggests that it is more important to myostatin inhibition and also fits well with our previous study showing that the ND of Fst forms more extensive contacts with myostatin than activin A (12). One possible reason for the relative resistance of Fst to ND point mutations is that the hinge region following the ND in Fst (12) may allow movements and repositioning of the ND in the type I receptor-binding site to accommodate these changes. Additionally, resistance could also be a result of interactions across Fst molecules where the FSD3 of one Fst interacts with the ND of the other, because this likely contributes to increased binding affinity for Fst and possibly provides cooperativity to the interaction (Fig. 1). Fst antagonism and binding of the ND involves two interaction surfaces as compared with only one for Fstl3. Thus, disrupting only one of the surfaces might not significantly impact Fst affinity for ligand. Fstl3 would not have this advantage because it lacks the third FSD required for this interaction.
Understanding the molecular mechanisms of TGF-β family ligand regulation by Fst-type molecules is a significant step toward engineering molecules with altered specificity and affinity toward different ligands. This is especially the case for myostatin, which predominantly negatively regulates muscle growth. Rationally designed myostatin inhibitors could be an effective treatment for muscle wasting diseases such as muscular dystrophy, because myostatin inhibitors are already in clinical trials for this purpose. However, it has been difficult to specifically target myostatin over other activin-like ligands. Efforts aimed at altering naturally occurring antagonists to make them specific myostatin inhibitors thus far have focused on Fst. In fact, a construct containing Fst ND-FSD1-FSD1 has shown strong specificity for myostatin over activin A (21, 22). However, because Fstl3 is already a more specific antagonist, it may be a better molecule to redesign for specific myostatin antagonism. Because the interactions at the ligand-Fstl3 ND interface are very different between myostatin and activin A, this should be a hot spot for altering antagonist specificity. Studies such as the one presented here will facilitate this rational design by revealing the molecular details that confer ligand specificity.
Supplementary Material
Acknowledgments
We thank Dr. Alexandra McPherron for providing the luciferase reporter construct DNA. We thank Dr. Se-Jin Lee for the CHO cell line used for myostatin production. We thank Dr. Rhett Kovall, Dr. Andy Herr, and Dr. Andy Hinck for critically reading the manuscript.
This work was supported, in whole or in part, by National Institutes of Health Grant GM084186 (to T. B. T.). This work was also supported by Muscular Dystrophy Association Grant 93887 (to T. B. T.) and the Intramural Research Program of the NIBIB, National Institutes of Health.

This article contains supplemental Table S1 and Figs. S1–S10.
The atomic coordinates and structure factors (code 3SEK) have been deposited in the Protein Data Bank, Research Collaboratory for Structural Bioinformatics, Rutgers University, New Brunswick, NJ (http://www.rcsb.org/).
- Fst
- follistatin
- Fstl3
- follistatin-like 3
- BMP
- bone morphogenetic protein
- FSD
- follistatin domain
- RMSD
- root mean square deviation
- ND
- N-terminal domain
- SPR
- surface plasmon resonance.
REFERENCES
- 1. Hayette S., Gadoux M., Martel S., Bertrand S., Tigaud I., Magaud J. P., Rimokh R. (1998) Oncogene 16, 2949–2954 [DOI] [PubMed] [Google Scholar]
- 2. Ueno N., Ling N., Ying S. Y., Esch F., Shimasaki S., Guillemin R. (1987) Proc. Natl. Acad. Sci. U.S.A. 84, 8282–8286 [DOI] [PMC free article] [PubMed] [Google Scholar]
- 3. Matzuk M. M., Lu N., Vogel H., Sellheyer K., Roop D. R., Bradley A. (1995) Nature 374, 360–363 [DOI] [PubMed] [Google Scholar]
- 4. Mukherjee A., Sidis Y., Mahan A., Raher M. J., Xia Y., Rosen E. D., Bloch K. D., Thomas M. K., Schneyer A. L. (2007) Proc. Natl. Acad. Sci. U.S.A. 104, 1348–1353 [DOI] [PMC free article] [PubMed] [Google Scholar]
- 5. Shimano M., Ouchi N., Nakamura K., Oshima Y., Higuchi A., Pimentel D. R., Panse K. D., Lara-Pezzi E., Lee S. J., Sam F., Walsh K. (2011) J. Biol. Chem. 286, 9840–9848 [DOI] [PMC free article] [PubMed] [Google Scholar]
- 6. Sidis Y., Mukherjee A., Keutmann H., Delbaere A., Sadatsuki M., Schneyer A. (2006) Endocrinology 147, 3586–3597 [DOI] [PubMed] [Google Scholar]
- 7. Innis C. A., Shi J., Blundell T. L. (2000) Protein Eng. 13, 839–847 [DOI] [PubMed] [Google Scholar]
- 8. Keller S., Nickel J., Zhang J. L., Sebald W., Mueller T. D. (2004) Nat. Struct. Mol. Biol. 11, 481–488 [DOI] [PubMed] [Google Scholar]
- 9. Korupolu R. V., Muenster U., Read J. D., Vale W., Fischer W. H. (2008) J. Biol. Chem. 283, 3782–3790 [DOI] [PubMed] [Google Scholar]
- 10. Kotzsch A., Nickel J., Seher A., Sebald W., Muller T. D. (2009) EMBO J. 28, 937–947 [DOI] [PMC free article] [PubMed] [Google Scholar]
- 11. Nickel J., Kotzsch A., Sebald W., Mueller T. D. (2005) J. Mol. Biol. 349, 933–947 [DOI] [PubMed] [Google Scholar]
- 12. Cash J. N., Rejon C. A., McPherron A. C., Bernard D. J., Thompson T. B. (2009) EMBO J. 28, 2662–2676 [DOI] [PMC free article] [PubMed] [Google Scholar]
- 13. Matzuk M. M., Kumar T. R., Vassalli A., Bickenbach J. R., Roop D. R., Jaenisch R., Bradley A. (1995) Nature 374, 354–356 [DOI] [PubMed] [Google Scholar]
- 14. Xia Y., Schneyer A. L. (2009) J. Endocrinol. 202, 1–12 [DOI] [PMC free article] [PubMed] [Google Scholar]
- 15. McPherron A. C., Lawler A. M., Lee S. J. (1997) Nature 387, 83–90 [DOI] [PubMed] [Google Scholar]
- 16. Lee S. J. (2004) Annu. Rev. Cell Dev. Biol. 20, 61–86 [DOI] [PubMed] [Google Scholar]
- 17. Lee S. J. (2010) Immunology, endocrine & metabolic agents in medicinal chemistry 10, 183–194 [DOI] [PMC free article] [PubMed] [Google Scholar]
- 18. Zimmers T. A., Davies M. V., Koniaris L. G., Haynes P., Esquela A. F., Tomkinson K. N., McPherron A. C., Wolfman N. M., Lee S. J. (2002) Science 296, 1486–1488 [DOI] [PubMed] [Google Scholar]
- 19. Bradley L., Yaworsky P., Walsh F. (2008) Cell. Mol. Life Sci. 65, 2119–2124 [DOI] [PMC free article] [PubMed] [Google Scholar]
- 20. Tsuchida K., Nakatani M., Uezumi A., Murakami T., Cui X. (2008) Endocr. J. 55, 11–21 [DOI] [PubMed] [Google Scholar]
- 21. Nakatani M., Takehara Y., Sugino H., Matsumoto M., Hashimoto O., Hasegawa Y., Murakami T., Uezumi A., Takeda S., Noji S., Sunada Y., Tsuchida K. (2008) FASEB J. 22, 477–487 [DOI] [PubMed] [Google Scholar]
- 22. Nakatani M., Kokubo M., Ohsawa Y., Sunada Y., Tsuchida K. (2011) Am. J. Physiol. Endocrinol. Metab. 300, E543–E553 [DOI] [PubMed] [Google Scholar]
- 23. Inouye S., Ling N., Shimasaki S. (1992) Mol. Cell. Endocrinol. 90, 1–6 [DOI] [PubMed] [Google Scholar]
- 24. Sidis Y., Schneyer A. L., Keutmann H. T. (2005) Endocrinology 146, 130–136 [DOI] [PubMed] [Google Scholar]
- 25. Stamler R., Keutmann H. T., Sidis Y., Kattamuri C., Schneyer A., Thompson T. B. (2008) J. Biol. Chem. 283, 32831–32838 [DOI] [PMC free article] [PubMed] [Google Scholar]
- 26. Hill J. J., Davies M. V., Pearson A. A., Wang J. H., Hewick R. M., Wolfman N. M., Qiu Y. (2002) J. Biol. Chem. 277, 40735–40741 [DOI] [PubMed] [Google Scholar]
- 27. Lerch T. F., Shimasaki S., Woodruff T. K., Jardetzky T. S. (2007) J. Biol. Chem. 282, 15930–15939 [DOI] [PubMed] [Google Scholar]
- 28. Thompson T. B., Lerch T. F., Cook R. W., Woodruff T. K., Jardetzky T. S. (2005) Dev. Cell 9, 535–543 [DOI] [PubMed] [Google Scholar]
- 29. Harrington A. E., Morris-Triggs S. A., Ruotolo B. T., Robinson C. V., Ohnuma S., Hyvonen M. (2006) EMBO J. 25, 1035–1045 [DOI] [PMC free article] [PubMed] [Google Scholar]
- 30. Takehara-Kasamatsu Y., Tsuchida K., Nakatani M., Murakami T., Kurisaki A., Hashimoto O., Ohuchi H., Kurose H., Mori K., Kagami S., Noji S., Sugino H. (2007) J. Med. Invest. 54, 276–288 [DOI] [PubMed] [Google Scholar]
- 31. Harrison C. A., Chan K. L., Robertson D. M. (2006) Endocrinology 147, 2744–2753 [DOI] [PubMed] [Google Scholar]
- 32. Keutmann H. T., Schneyer A. L., Sidis Y. (2004) Mol. Endocrinol. 18, 228–240 [DOI] [PubMed] [Google Scholar]
- 33. Schneyer A. L., Sidis Y., Gulati A., Sun J. L., Keutmann H., Krasney P. A. (2008) Endocrinology 149, 4589–4595 [DOI] [PMC free article] [PubMed] [Google Scholar]
- 34. Sidis Y., Schneyer A. L., Sluss P. M., Johnson L. N., Keutmann H. T. (2001) J. Biol. Chem. 276, 17718–17726 [DOI] [PubMed] [Google Scholar]
- 35. Lee S. J., McPherron A. C. (2001) Proc. Natl. Acad. Sci. U.S.A. 98, 9306–9311 [DOI] [PMC free article] [PubMed] [Google Scholar]
- 36. Jiang M. S., Liang L. F., Wang S., Ratovitski T., Holmstrom J., Barker C., Stotish R. (2004) Biochem. Biophys. Res. Commun. 315, 525–531 [DOI] [PubMed] [Google Scholar]
- 37. Thompson T. B., Woodruff T. K., Jardetzky T. S. (2003) EMBO J. 22, 1555–1566 [DOI] [PMC free article] [PubMed] [Google Scholar]
- 38. Otwinowski Z., Minor W. (1997) Methods Enzymol. 276, 307–326 [DOI] [PubMed] [Google Scholar]
- 39. McCoy A., Grosse-Kunstleve R., Adams P., Winn M., Storoni L., Read R. (2007) J. Appl. Crystallogr. 40, 658–674 [DOI] [PMC free article] [PubMed] [Google Scholar]
- 40. Murshudov G. N., Vagin A. A., Dodson E. J. (1997) Acta Crystallogr. D Biol. Crystallogr. 53, 240–255 [DOI] [PubMed] [Google Scholar]
- 41. Emsley P., Cowtan K. (2004) Acta Crystallogr. D Biol. Crystallogr. 60, 2126–2132 [DOI] [PubMed] [Google Scholar]
- 42. Painter J., Merritt E. A. (2006) J. Appl. Crystallogr. 39, 109–111 [Google Scholar]
- 43. Salerno W. J., Seaver S. M., Armstrong B. R., Radhakrishnan I. (2004) Nucleic Acids Res. 32, W566–W568 [DOI] [PMC free article] [PubMed] [Google Scholar]
- 44. Lawrence M. C., Colman P. M. (1993) J. Mol. Biol. 234, 946–950 [DOI] [PubMed] [Google Scholar]
- 45. Davis I., Leaver-Fay A., Chen V., Block J., Kapral G., Wang X., Murray L., Arendall W., Snoeyink J., Richardson J., Richardson D. (2007) Nucleic Acids Res. 35, W375–W383 [DOI] [PMC free article] [PubMed] [Google Scholar]
- 46. DeLano W. L. (2002) PyMOL, DeLano Scientific, Palo Alto, CA, U.S.A [Google Scholar]
- 47. Thies R. S., Chen T., Davies M. V., Tomkinson K. N., Pearson A. A., Shakey Q. A., Wolfman N. M. (2001) Growth Factors 18, 251–259 [DOI] [PubMed] [Google Scholar]
- 48. Schneyer A. L., Rzucidlo D. A., Sluss P. M., Crowley W. F., Jr. (1994) Endocrinology 135, 667–674 [DOI] [PubMed] [Google Scholar]
- 49. Zhan H., Sun Z., Matthews K. S. (2009) Biochemistry 48, 1305–1314 [DOI] [PubMed] [Google Scholar]
- 50. Svitel J., Balbo A., Mariuzza R. A., Gonzales N. R., Schuck P. (2003) Biophys. J. 84, 4062–4077 [DOI] [PMC free article] [PubMed] [Google Scholar]
- 51. Svitel J., Boukari H., Van Ryk D., Willson R. C., Schuck P. (2007) Biophys. J. 92, 1742–1758 [DOI] [PMC free article] [PubMed] [Google Scholar]
- 52. Schuck P., Zhao H. (2010) Methods Mol. Biol. 627, 15–54 [DOI] [PMC free article] [PubMed] [Google Scholar]
- 53. Hart P. J., Deep S., Taylor A. B., Shu Z., Hinck C. S., Hinck A. P. (2002) Nat. Struct. Biol. 9, 203–208 [DOI] [PubMed] [Google Scholar]
- 54. Greenwald J., Vega M. E., Allendorph G. P., Fischer W. H., Vale W., Choe S. (2004) Mol. Cell 15, 485–489 [DOI] [PubMed] [Google Scholar]
- 55. Yang M., Horii K., Herr A. B., Kirley T. L. (2008) Biochemistry 47, 771–778 [DOI] [PMC free article] [PubMed] [Google Scholar]
- 56. Benfield C. T., Mansur D. S., McCoy L. E., Ferguson B. J., Bahar M. W., Oldring A. P., Grimes J. M., Stuart D. I., Graham S. C., Smith G. L. (2011) J. Biol. Chem. 286, 20727–20735 [DOI] [PMC free article] [PubMed] [Google Scholar]
Associated Data
This section collects any data citations, data availability statements, or supplementary materials included in this article.