Abstract
In this study, we examined the effect of first dimension column selectivity in reversed phase (RP) online comprehensive two dimensional liquid chromatography (LC × LC). The second dimension was always a carbon clad metal oxide reversed phase material. The hydrophobic subtraction model (HSM) and the related phase selective triangles were used to guide the selection of six different RP first dimension columns. Various kinds of samples were investigated and thus two different elution conditions were needed to cause full elution from the first dimension columns. We compared LC × LC chromatograms, contours plots, and fcoverage plots by measuring peak capacities, peak numbers, relative spatial coverage, correlation values, etc. The major finding of this study is that the carbon phase due to its rather different selectivity from other reversed phases is reasonably orthogonal to a variety of common types of bonded reversed phases. Thus quite surprisingly the six different first dimension stationary phases all showed generally similar separation patterns when paired to the second dimension carbon phase. This result greatly simplifies the task of choosing the correct pair of phases for RP × RP.
Keywords: Two dimensional liquid chromatography, Selectivity, Reversed phase, LC × LC method development, Hydrophobic subtraction method, Carbon stationary phases
1. Introduction
Comprehensive two dimensional liquid chromatography (LC × LC) is gaining more and more interest due to its high separating power compared to one dimensional liquid chromatography (1DLC) [1-6]. When dealing with complex samples in metabolomics, proteomics, pharmaceutics, etc., the limited separation power provided by 1DLC can be the bottleneck in achieving successful separations in a reasonable time [3,7-11]. Clearly improvements in technologies with increased separating power are highly desirable. The concept of LC × LC was introduced three decades ago; the enormous improvements since 1990 have confirmed the huge potential of LC × LC for increasing peak capacity; this mainly results from the “multiplicative advantage” of multi-dimensional methods under ideal conditions [12-17]. Recently, Carr and coworkers performed a series of LC × LC studies on metabolomics samples with total analysis times in the range of 15–60 min [18-20] but with the second dimension run on the time scale of 6–40 s by doing the second dimension separations at high temperatures (100–120 °C). The decreased eluent viscosity at higher temperatures makes it possible to use high linear velocities, high flow rates (~3 mL/min) and short cycle times on the second dimension. Stoll et al. compared the peak capacities and numbers of observed peaks of fully optimized 1DLC and practical LC × LC, and showed that LC × LC becomes superior to 1DLC in terms of Effective peak capacity within only 5–10 min [19]. LC × LC produced peak capacities of about 1000 within 30 min; this is well beyond what 1DLC could possibly achieve within a reasonable time. Other important issues in LC × LC include theoretical [21-23] and experimental studies of the optimal second dimension time [20], the use of sophisticated second dimension gradients [24-26], the use of parallel second dimension columns [27], and the development of protocols for the optimization of LC × LC [28,29].
To obtain a successful LC × LC separation, a number of criteria must be reasonably satisfied. First, the sampling of the first dimension effluent must be fast enough to limit resolution losses resulting from “under-sampling” effects [30]. Second, the first and second dimension retention times should be minimally correlated [12,31]. This is frequently spoken of as the “orthogonality” requirement. Third, peaks from the actual samples should cover the whole 2D separation space [32]. Under practical conditions the above three criteria are never completely met by real LC × LC systems; therefore, Stoll et al. proposed a new metric called the effective LC × LC peak capacity ( ) which was defined as per Eq. (1) [19]:
| (1) |
Here 1nc and 2nc are the first and second dimension peak capacities, respectively; fcoverage is the fractional spatial coverage factor corresponding to the peak distribution of the 2D separation based on a modification of a method due to Gilar [32]; and 〈β〉 is the Davis–Stoll–Carr (D–S–C) under-sampling correction factor which can be calculated as per Eq. (2) [33,34]:
| (2) |
where ts is the first dimension sampling time and 1ϖ is the average first dimension peak width. In on-line LC × LC the sampling time is equal to the second dimension cycle time (2tc).
The specific sample under investigation is very important to establishing the effective peak capacity as it can seriously impact fcoverage. The separation mechanisms used must be orthogonal to ensure the multiplicative behavior of the peak capacities from the two dimensions. Thus, choosing two columns with maximum orthogonality (i.e. different selectivity) for the sample of interest is a key step in LC × LC method development. Schure suggested using D, called the dimensionality of chromatographic techniques, to quantitatively measure the multidimensional orthogonality due to its scale-free nature [35]. Janderra and his coworkers used linear free energy relationships (LFER) [36,37] as a tool for the selection of columns to provide low correlation of retention and separation selectivity in LC × LC [24]. They also developed the method of “parallel gradients” in the two dimensions for the separation of phenolic and flavone antioxidants, which increased orthogonality and improved coverage of the LC × LC retention space. Hajek et al. used a PEG coated silica phase in the first dimension and C18 or C8 phases in the second dimension; interestingly they found that the type of alkylsilica phases employed as the second dimension had little effect on the quality of separation when paired with a PEG phase in the first dimension [37]. Huidobro et al. explored separation orthogonality in LC × LC and concluded that the combination CNxC18, gave adequate orthogonality for their sample [38]. When the phases are not sufficiently orthogonal, Bedani et al. described a strategy for optimizing the second dimension gradient conditions to maximize the coverage of the separation space [39].
One of the stated purposes of the hydrophobic subtraction model (HSM) for characterizing RP materials [40] is the selection of orthogonal phases mainly for use in purity analysis of pharmaceuticals; it does not appear as yet to have been used in LC × LC for this purpose although this use was described by Stoll and his collaborators for targeted multi-dimensional separations [41]. More than 400 different reversed phase columns have been characterized using the five HSM selectivity parameters: hydrophobicity (H), steric resistance (S*), hydrogen-bond acidity (A), hydrogen-bond basicity (B), and cation exchange activity (C). Overall differences in selectivity of two stationary phases can be summarized by use of the Fs values [41] computed from the five HSM parameters as per Eq. (3):
| (3) |
More recently, Zhang and Carr developed a simple graphical method based on HSM for visually comparing a large number of phases simultaneously [42]. Due to its simplicity and ease of visualization these phase selective triangles should be useful in LC × LC for choosing stationary phases.
The use of solid carbon adsorbent-like reversed phases in LC × LC, as the second dimension in RP × RP, is motivated by carbons unique selectivity and its high tolerance to extreme chemical and thermal conditions [6,43-51]. In 1990, Carr and coworkers developed carbon clad zirconia by depositing carbon on the surface of zirconia by chemical vapor deposition (CVD) [52]. Jackson et al. utilized linear solvation energy relationships (LSERs) to characterize fundamental intermolecular interactions during retention on carbon clad zirconia, and they found that compared to conventional bonded phases carbon tends to have strong positive dipolarity/polarizability interactions as compared to the vast majority of bonded RP type phases which have weakly negative dipolarity/polarizability interactions. This imparts distinctly different selectivities to carbon phases compared to bonded RP materials [44,45,53,54]. They further found that carbon clad zirconia is rather more hydrophobic and thus more retentive than are alkyl bonded phases; this makes carbon phases quite promising for use as the second dimension in LC × LC in that they can provide a high degree of sample focusing [51,55]. In fact, carbon clad zirconia has been successfully used to analyze complex metabolomics samples in fast LC × LC experiments [18-20,56].
As compared to 1DLC, LC × LC has a tremendous advantage in resolving power, but method development in LC × LC is much more arduous because there are so many more variables and many of them strongly interact. In previous work we examined the effect of the first dimension eluent on changes in orthogonality [57]. The purpose of this study is to examine the effect of the first dimension phase selectivity in LC × LC when a carbon stationary phase is used as the second dimension. LC × LC chromatograms from four representative very complex mixtures were compared in terms of peak capacities, peak numbers, fcoverage, etc.
2. Experiments and methods
2.1. Reagents and materials
HPLC grade acetonitrile was purchased from Burdick and Jackson (Muskegon, MI); HPLC grade water was from Sigma–Aldrich (St. Louis, MO). Phosphoric acid (>85%) was from Sigma–Aldrich (St. Louis, MO); perchloric acid (70%) was purchased from Mallinckrodt Baker, Inc. (Phillipsburg, NJ). Thiourea, 5-hydroxy-l-tryptophan, tryptophan, indole-3-acetyl-l-lysine, indole-3-acetamide, indole-3-propionic acid, indole-3-ethanol, tryptamine, and indole-3-acetonitrile were purchased from Sigma–Aldrich (St. Louis, MO) as reagent grade or better. Both C18 SPE cartridges (500 mg) and carbon cartridges (500 mg, SimpleQ) were purchased from Agilent Technologies (Wilmington, DE).
2.2. Sample preparation
The use of maize extract as a representative metabolomics sample was discussed extensively in our previous studies [18,19]; the steps for preparing the maize extract and indole standard samples have been given in detail [20]. In this study, we prepared juice extract and urine extract samples in the same way as for the maize extract except we started with 10 mL of raw samples (juice or urine). Whole grain bread extract samples were from Dr. Devin G. Peterson’s research group in the Department of Food Science and Nutrition at the University of Minnesota. Briefly, 400 g of whole grain bread crust were pulverized beforehand, and 36 g of the soluble portion were obtained from extraction with 20% aqueous ethanol. After SPE with C18 cartridges, 3.2 g of the hydrophobic portion was ultrafiltered, which generated 2.25 g of the extract sample containing components with MW <1000 Da. Yeast supernatant samples were provided by Dr. Fred Schendel in the Biotechnology Resource Center at the University of Minnesota. The fermentation media before inoculation contained yeast extract (8 g/L), dextrin (10 g/L), mannitol (100 g/L), and soy peptone (15 g/L). The media was inoculated with Streptomyces tendae and grown for 260 h at 27 °C with pH controlled at 5.5 using sodium hydroxide and sulfuric acid. The cells were separated from the culture and a sample of the broth was used for the analysis in this study.
2.3. Instrumentation and data processing
The instrumentation used for LC × LC and the data processing procedures were described in detail in our previous study [20]. Six different reversed phases were examined for use as the first dimension: Discovery HS-F5 (Supelco, Bellefonte, PA, 2.1 mm × 10 cm, 3 μm), Zorbax SB-C3 (Agilent Technologies; Wilmington, DE, 2.1 mm × 10 cm, 3.5 μm), Zorbax SB-C8 (Agilent Technologies; Wilmington, DE, 2.1 mm × 5 cm (2), 3.5 μm), Zorbax SB-CN (Agilent Technologies; Wilmington, DE, 2.1 mm × 10 cm, 3.5 μm), Zorbax Bonus-RP (Agilent Technologies; Wilmington, DE, 2.1 mm × 10 cm, 3.5 μm), and HC–COOH phase [58] (homemade, 2.1 mm × 5 cm (2), 5 μm). Bonus-RP columns have an embedded amide linkage in a sterically protected diisopropyl-C14 alkyl chains which are bonded on ultra-pure (>99.995% SiO2; Type B) Zorbax Rx-SIL silica support. The HC–COOH phase is a mixed-mode reversed phase/weak cation exchange phase which was made by introducing a small amount of carboxylate functionality into a hydrophobic hyper-crosslinked (HC) platform [58]. The other phases are well known conventional RP materials. The second dimension column (2.1 mm × 3.3 cm, 3.0 μm) was packed with carbon clad zirconia reversed phase material (8% (w/w) carbon, ZirChrom Separations, Inc.; Anoka, MN).
2.4. Elution conditions
For a fair comparison, elution conditions were selected to completely elute all the components in samples before the end of gradient. Table 1 shows the two elution conditions used in this study. Elution Condition 2 was only used to examine those samples which were incompletely eluted under Elution Condition 1.
Table 1.
Elution conditions.
| 1DLC or the first dimension in LC × LC | Second dimension in LC × LC | ||
|---|---|---|---|
| Elution Condition 1 | |||
| A: 1.5 mM H3PO4 in water; B: ACN | A: 10 mM H3PO4 in water; B: ACN | ||
| Time (min) | B% | Time (min) | %B |
| 0 | 0 | 0 | 0 |
| 24 | 50 | 0.30 | 100 |
| 24.01 | 0 | 0.31 | 0 |
| Elution Condition 2 | |||
| A: 10 mM HClO4 in water; B: ACN | A: 10 mM H3PO4 in water; B: ACN | ||
| Time (min) | B% | Time (min) | %B |
| 0 | 0 | 0 | 0 |
| 24 | 50 | 0.30 | 100 |
| 24.01 | 0 | 0.31 | 0 |
3. Results and discussion
3.1. First dimension column selection
Column selection is critically important in LC × LC method development. This study aims to investigate the influence of the various types of RP materials for use in the first dimension when paired with a second dimension carbon clad phase. However, there are more than 1500 RP materials phases on the market, not to mention those which are home-made and under development. Obviously, it is a tedious and inefficient task to test all these phases for the first dimension in LC × LC since a very large number of packing materials have almost identical selectivity [42]. It is more reasonable to pick a number of representative reversed phases with various selectivities and validate whether their retention and selective are compatibility with the carbon phase. Herein, we used the HSM approach and the related selectivity triangle to guide the selection of the first dimension columns.
3.1.1. Selectivity triangles
The unique advantage of selectivity triangles is that they allow the visualization of all stationary phases as long as they have been characterized by HSM, and thus they enable a quick and reliable selection of phases with either equivalent or different selectivity [42]. Four triangles are needed to display all four permutations of the selectivity characteristics taken three at a time but generally the S*–B–C triangle suffices to demonstrate the relative difference of stationary phases. There are very few analytes (chiefly amides) that are sufficiently strong hydrogen bond acceptors (bases) so that the stationary phase hydrogen bond donor strength matters at all. The phase hydrophobicity is not neglected in the S*–B–C triangle. The phase parameters are actually the ratio of the HSM parameters (S*, B, and C) to H [42]. Fig. 1 is the S*–B–C triangle of the six reversed phases we picked for this work. The axes in Fig. 1 (χS*, χB, χC) are normalized measures of the steric, hydrogen bond acceptor, and Coulombic contribution to phase selectivity. The normalization is relative to the underlying hydrophobic interaction that dominates retention in reverse phase chromatography. Note that the axes of the triangle are constructed based on nearly 450 phases; we show only the phases used in this work to avoid the huge overlap that exists for the vast majority of phases which tend to “clump” in a small section of the triangle. The C8 material used in this work is roughly in the center of the triangle defined by the average of all alkyl type B silica phases; the C3 and CN phases are only a bit different from the C8 material, and they almost overlap with each other even though C3 and CN have distinctly different surface chemistry [42]; the F5 phase is different from both C8 and C3/CN, with a similar distance between each pair. HC–COOH is clearly located farther away from C8; The Bonus phase is unique in selectivity as its location is very different from the other phases in Fig. 1. Of the 450 phases used to establish the triangle Bonus is clearly an “extreme” phase. Furthermore, Fig. S1 shows all four triangles (S*–A–B–C). Although the HC–COOH phase is closer to C8 in the A-B-C triangle (Fig. S1c) than in the S*–B–C triangle shown in Fig. 1, all of the patterns are similar to that of Fig. 1 and the Bonus phase is very different from the other five phases.
Fig. 1.
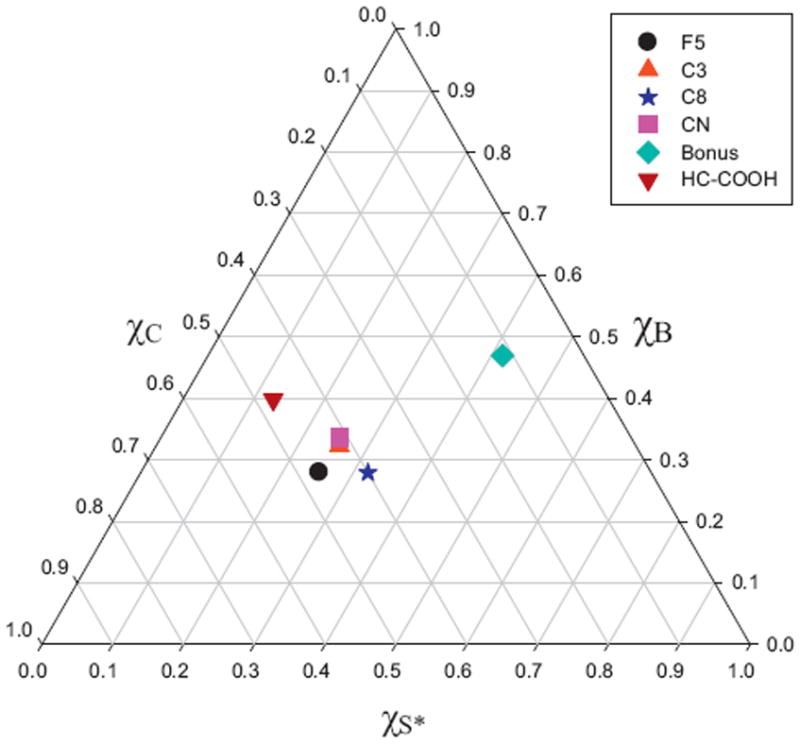
Selective triangle (S*–B–C) of the six reversed stationary phases in this study. F5: Discovery HS-F5; C3: Zorbax 300SB-C3; C8: Zorbax 300SB-C8; CN: Zorbax SB-CN; Bonus: Zorbax Bonus-RP; HC–COOH: home-made HC–COOH.
3.1.2. Hydrophobic subtraction model comparison
Table 2 shows the Fs values between each pair of phases of the six selected materials. The Fs values were calculated based on Eq. (3) using the five HSM parameters (H, S*, A, B, and C (2.8)). According to Snyder et al. [40], Fs values of 3 or less indicate that columns have nearly identical selectivities whereas columns with Fs values greater than 30 are considered to be extremely different. Note that although we have estimates of the HSM parameters for carbon phase, this phase is so radically different from bonded materials that the measured retentions of the standard solutes used to determine the coefficients are not at all well fit by the HSM model and thus the phase characteristics (H, S*, A, B, and C) of the carbon phase are not in our opinion really meaningful. That is, carbon is such a radically different material that the hydrophobic subtraction model cannot be used to describe retention on it and thus any derived parameters H, S*, etc. are invalid. The exceptional selectivity of solid carbon sorbents as compared to the vast majority of reversed phase chromatographic materials has been commented on in several papers and studied to some extent [44,45,54,59]. The reasons for its “uniqueness” are, at best, only partially understood and were not explored here.
Table 2.
Column selection based on hydrophobic subtraction method.a
| C3b | CNc | C8d | HC–COOHe | F5f | Bonusg | |
|---|---|---|---|---|---|---|
| C3b | 0 | 7 | 12 | 26 | 75 | 247 |
| CNc | 7 | 0 | 18 | 32 | 80 | 241 |
| C8d | 12 | 18 | 0 | 23 | 68 | 256 |
| HC–COOHe | 26 | 32 | 23 | 0 | 54 | 269 |
| F5f | 75 | 80 | 68 | 54 | 0 | 320 |
| Bonusg | 247 | 241 | 256 | 269 | 320 | 0 |
This table shows Fs values calculated based on Eq. (3) when pH = 2.8; each Fs value is comparing two stationary phases from the corresponding row and the column.
C3: Zorbax 300SB-C3 (3.5 μ particles).
CN: Zorbax SB-CN (3.5 μ particles).
C8: Zorbax 300SB-C8 (3.5 μ particles).
HC–COOH: home-made HC–COOH (5 μ particles).
F5: Discovery HS-F5 (3 μ particles).
Bonus: Zorbax Bonus-RP (3.5 μ particles).
It can also be clearly seen from the table that the Bonus phase has a selectivity that is very different from the other five phases; the range of Fs is between 241 and 320 with respect to CN and F5, respectively. F5 is probably the second most distinct phase next to Bonus, with all Fs values larger than 30. That is, Snyder et al. would regard the F5 phase as being quite different [40]. In general, HC–COOH has lower Fs values than F5, two of which were measured against C3 and C8 are below 30. Interestingly, Fs values indicate that separations on C3, C8 and CN columns are expected to be quite similar despite that the differences in surface chemistry. The Fs criteria confirmed our choices of phases based on the selectivity triangles. However, we should point out that a second criterion for choosing five of these six phases was their relativity low retention compared to the second dimension phase. This is important in that low retention on the first dimension facilitates sample focusing on the second dimension. The C8 phase was chosen because it represents the most common of all RP phases; it is located very near the center of gravity of the 450 different phases used to construct the triangles.
3.2. Maize extract samples under Elution Condition 1
To allow a fair comparison, it is important to first inspect the 1DLC chromatograms to make sure that the different combinations of columns in LC × LC were separating the same ensemble of compounds. Fig. 2 shows 1DLC chromatograms of the maize extract samples using six different phases under Elution Condition 1. There is no carry-over effect which enables a fair comparison between the six stationary phases with very different selectivity. Furthermore, it can be seen that the maize extract samples are very complex containing hundreds perhaps thousands of compounds. Although many peaks were resolved, there is a “hump” in each chromatogram of Fig. 2, which demonstrates that the resolving power of 1DLC is not high enough to achieve decent separations of very complex samples. In addition, it was found by tracking the high intensity peaks that these six different phases indeed have different selectivity as the retention times varied with the column.
Fig. 2.
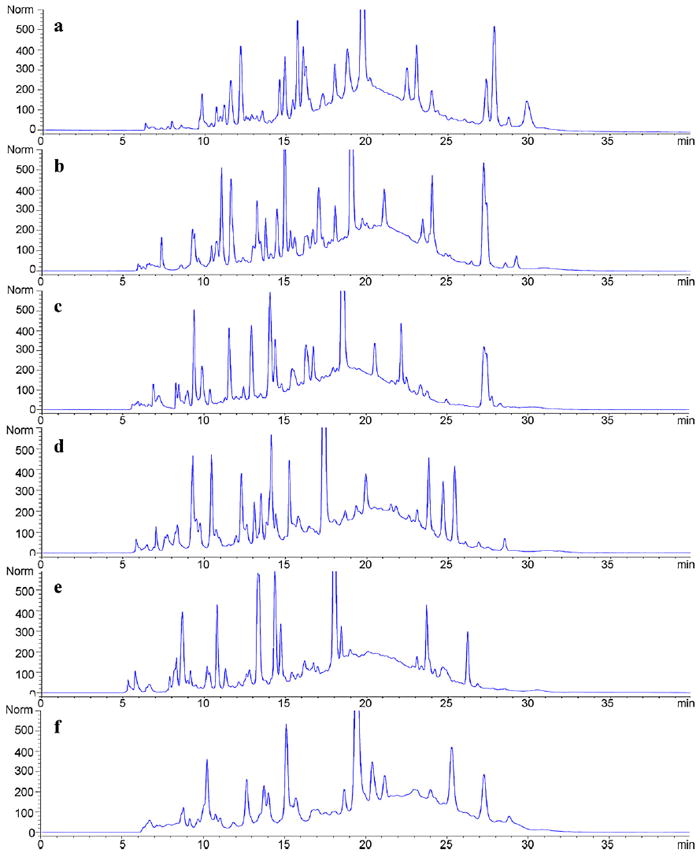
1DLC chromatograms of maize extract samples using six different phases under Elution Condition 1. (a) F5: Discovery HS-F5; (b) C3: Zorbax 300SB-C3; (c) C8: Zorbax 300SB-C8; (d) CN: Zorbax SB-CN; (e) Bonus: Zorbax Bonus-RP; and (f) HC–COOH: home-made HC–COOH.
Figs. 3-5 show LC × LC chromatograms, contour plots, and fcoverage plots of maize extract samples using six different first dimension phases paired with the second dimension carbon phase under Elution Condition 1, respectively. In the LC × LC chromatograms (Fig. 3), we can clearly see that the baseline is much more flat compared to that in the 1DLC chromatograms (Fig. 2), indicating that many more peaks were resolved.
Fig. 3.
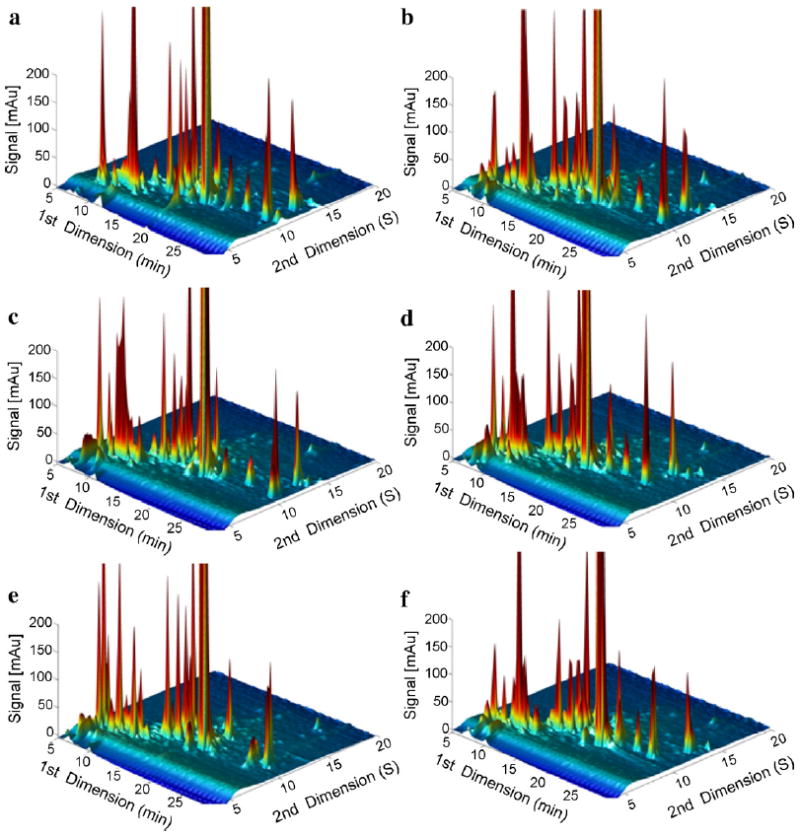
LC × LC chromatograms of maize extract samples using six different first dimension phases paired with second dimension carbon phase under Elution Condition 1. (a) F5: Discovery HS-F5; (b) C3: Zorbax 300SB-C3; (c) C8: Zorbax 300SB-C8; (d) CN: Zorbax SB-CN; (e) Bonus: Zorbax Bonus-RP; and (f) HC–COOH: home-made HC–COOH.
Fig. 5.
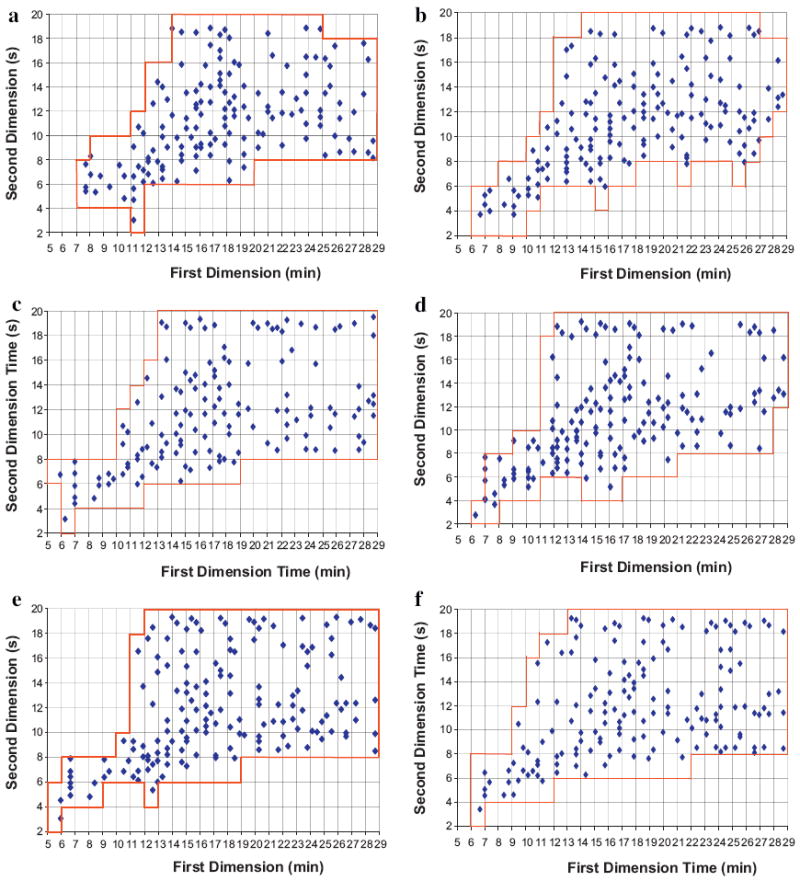
LC × LC fcoverage plots of maize extract samples using six different first dimension phases paired with second dimension carbon phase under Elution Condition 1. (a) F5: Discovery HS-F5; (b) C3: Zorbax 300SB-C3; (c) C8: Zorbax 300SB-C8; (d) CN: Zorbax SB-CN; (e) Bonus: Zorbax Bonus-RP; and (f) HC–COOH: home-made HC–COOH.
At first blush the three dimensional column LC × LC plots do not show the clear superiority of any of the six first dimension phases; however, this may be due to the large number of peaks which are hard to differentiate in this type of plot. In contrast, the contour plots (Fig. 4) are better able to show the peak retention patterns. There are changes in pattern but overall one is struck by the gross similarity in these “pictures”. These six different phases generated similar separation patterns with only subtle differences. This does not mean that one phase might not be vastly superior for the analysis of one or more specific components but overall the substantial differences in selectivity as witnessed by the Fs metric and the selectivity triangles does not make much difference for the maize sample.
Fig. 4.
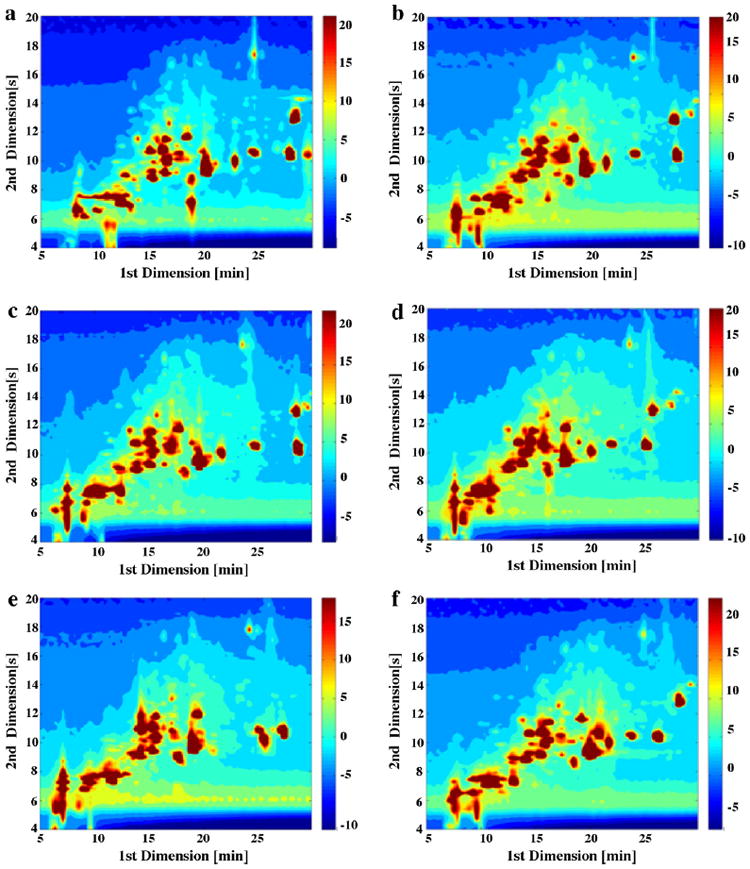
LC × LC contour plots of maize extract samples using six different first dimension phases paired with second dimension carbon phase under Elution Condition 1. (a) F5: Discovery HS-F5; (b) C3: Zorbax 300SB-C3; (c) C8: Zorbax 300SB-C8; (d) CN: Zorbax SB-CN; (e) Bonus: Zorbax Bonus-RP; and (f) HC–COOH: home-made HC–COOH.
Coverage factor (fcoverage) is a quantitative measure of separation pattern and peak distribution in the separation space; the fcoverage plots in Fig. 5 were obtained with the same approach as in our previous studies [18-20]. The grid size is 1 min along the first dimension and 2 s along the second dimension. Careful visual inspection shows that the six different first dimension phases generated similar separation patterns when paired with the carbon phase in the second dimension.
Table 3 summarizes the LC × LC results, especially in terms of peak capacity and peak number. Besides selectivity, these six first dimension phases do differ somewhat in peak capacity even when the same samples and experimental conditions were used. 1nc changed more than 1.5 fold, varying from 60 for HC–COOH to 97 for Bonus. The second dimension peak capacities (2nc) are very similar (~33) as the same carbon column was used for all these experiments. (〈β〉), the under-sampling correction factor, is dependent on both the second dimension cycle time and first dimension peak width, and in this study it is directly related to the first dimension peak capacity. The smaller 1nc is, the smaller (〈β〉) is. The under-sampling correction factor was 1.89 and 2.79 for HC–COOH and Bonus, respectively. As a result, the range of corrected LC × LC peak capacity ( ) is only from 1016 for HC–COOH to 1172 for C3. The coverage factor changed from 0.55 (F5) to 0.63 (HC–COOH), which again confirms that separation pattern of the six different combinations of columns was very similar. It is important to note that 1nc changed about 1.5 fold, but only varied about 1.2 fold, from 620 (F5) to 677 (Bonus).
Table 3.
LC × LC Results using maize extract samples under Elution Condition 1.
| Column | 1nch | 2nci | (〈β〉)j |
|
fcoveragel |
|
Peaks1Dn | Peaks2Do | r2p | ||
|---|---|---|---|---|---|---|---|---|---|---|---|
| HC–COOHa | 60 | 32 | 1.89 | 1016 | 0.63 | 640 | 42 | 152 | 0.163 | ||
| F5b | 72 | 34 | 2.17 | 1128 | 0.55 | 620 | 57 | 147 | 0.192 | ||
| C8c | 87 | 33 | 2.53 | 1135 | 0.58 | 658 | 68 | 136 | 0.221 | ||
| C3d | 90 | 34 | 2.61 | 1172 | 0.56 | 657 | 64 | 154 | 0.283 | ||
| CNe | 92 | 31 | 2.66 | 1072 | 0.60 | 643 | 61 | 153 | 0.259 | ||
| Bonusf | 97 | 33 | 2.79 | 1147 | 0.59 | 677 | 69 | 157 | 0.190 | ||
| Ratiog | 1.6 | 1.1 | 1.5 | 1.2 | 1.1 | 1.1 | 1.6 | 1.2 | 1.7 |
HC–COOH: Home-made HC–COOH (5 μ particles).
F5: Discovery HS-F5 (3 μ particles).
C8: Zorbax 300SB-C8 (3.5 μ particles).
C3: Zorbax 300SB-C3 (3.5 μ particles).
CN: Zorbax SB-CN (3.5 μ particles).
Bonus: Zorbax Bonus-RP (3.5 μ particles).
Ratio: The ratio of the largest value over the lowest value in each column.
1nc: First dimension peak capacity.
2nc: Second dimension peak capacity.
(〈β〉): D–S–C under-sampling correction factor.
: Corrected LC × LC peak capacity.
fcoverage: Coverage factor.
: Effective LC × LC peak capacity.
Peaks1D: Number of observed peaks from 1DLC chromatograms.
Peaks2D: Number of observed peaks from LC × LC chromatograms.
r2: Coefficient of determination of peaks on LC × LC chromatograms.
This fits with our previous conclusion that the first dimension peak capacity plays a much less important role in establishing the critically important effective 2D peak capacity ( ) than does the second dimension peak capacity [20,29]. Peak numbers are highly correlated with the effective peak capacity; correspondingly the peak numbers from the 1DLC chromatograms changed from 42 (HC–COOH) to 69 (Bonus) and the peak numbers for LC × LC varied from 136 (C8) to 157 (Bonus). Since the analysis times were above the 5–10 min 1D/2D “cross-over”, it is not surprising to see that LC × LC gave higher resolving power and numbers of observed peaks than did 1DLC [19,20].
These coverage values are more or less subjective, e.g., fcoverage factors are highly dependent on the grid size [33,60]; therefore, we kept the same peak counting criteria and parameters during all data processing procedures. Finally, the coefficient of determination values (r2) were similar varying from 0.163 for HC–COOH to 0.283 for C3. The maize extract is a complex sample which can be used for the measurement of orthogonality in LC × LC. The correlation values are small and show similar orthogonality between the six very different first dimension phases and the second dimension carbon phase.
3.3. Whole grain bread extract, juice extract, and yeast supernatant samples under Elution Condition 1
To further validate the above results, we ran a variety of samples under the same elution conditions as those for the maize extract samples. The C3 and Bonus columns were selected for this part of the work as they are dramatically different based on both Snyder’s Fs and the selectivity triangles. In this study, whole grain bread extracts, juice extracts, a yeast fermentation supernatant sample, and human urine extracts were utilized as prototypes of bio-samples that might be encountered in metabolomics and related fields. As shown in Figs. S2 and S3, these samples are very complex generating many peaks from hundreds of components with a large range in concentration. The selectivity differences between the C3 and Bonus phases can be clearly seen by inspecting the variation in the retention times of the highest peaks from the same sample. Fig. S2 demonstrates that the first three kinds of samples can be investigated under Elution Condition 1 as most components elute before the end of the gradient in 1DLC. In contrast, the urine extract samples must be run under Elution Condition 2 since there was a strong carry-over effect when they were measured under Elution Condition 1, in particular there was an interrupted peak at the end of the gradient (see Fig. S3b).
Fig. 6 compares the C3 and Bonus phases when paired with the carbon phase in the second dimension using the whole grain bread extract. LC × LC chromatograms resolved many peaks in the 2D separation space; differences in selectivity of the C3 and Bonus phases caused some changes in the LC × LC chromatograms especially in the apparent retention times of some of the large peaks. However, the LC × LC contour plots clearly show the similarity of the separation patterns generated by the combination of the C3 and Bonus phases with carbon. The similarity is further confirmed by the LC × LC fcoverage plots, especially noticeable is that both phase combinations generated peaks at ~17 min in the first dimension and ~20 s in the second dimension. The experimental results are summarized in Table 4. The first dimension peak capacity and the corrected LC × LC capacity peak are similar for both C3 and Bonus. C3 has a bit higher fcoverage factor (0.40) than does Bonus (0.33) using the whole grain bread extracts, showing that the separation patterns are similar even though the C3 and Bonus phases are dramatically different in selectivity. The effective LC × LC peak capacity is 469 for C3 and 379 for Bonus, which is highly dependent on fcoverage. The variation of peak numbers from the 1DLC chromatograms is small, from 60 (Bonus) to 69 (C3); the peak numbers from the LC × LC chromatograms changed from 82 of Bonus to 99 of C3 – a ~20% increase. In addition, r2 values varied from 0.223 for C3 to 0.320 for Bonus, and the relatively small change from bread extract samples demonstrated the similarity in orthogonality even when very different first dimension phases (C3 and Bonus) were paired with carbon in the second dimension.
Fig. 6.
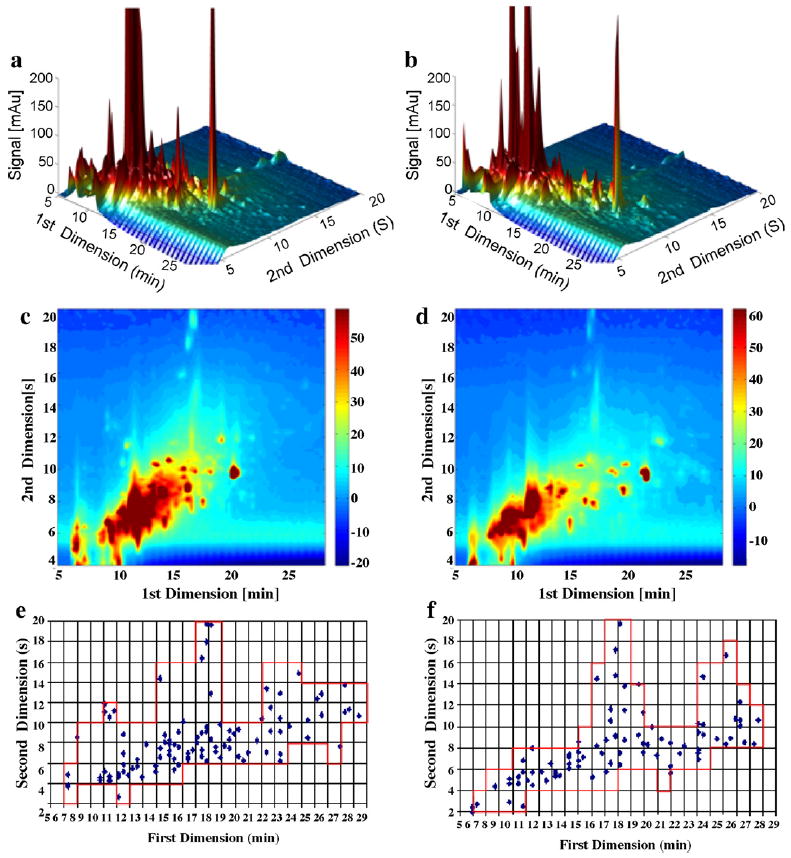
Comparison of C3 and Bonus phases in the first dimension when paired with carbon phase in the second dimension using whole grain bread extract samples under Elution Condition 1. (a) LC × LC chromatogram when C3 in the first dimension; (b) LC × LC chromatogram when Bonus in the first dimension; (c) LC × LC contour plot when C3 in the first dimension; (d) LC × LC contour plot when Bonus in the first dimension; (e) LC × LC fcoverage plot when C3 in the first dimension; and (f) LC × LC fcoverage plot when Bonus in the first dimension.
Table 4.
LC × LC results using various samples.
| Column |
|
fcoveraged |
|
Peaks1Df | Peaks2Dg | r2h | ||
|---|---|---|---|---|---|---|---|---|
| Whole grain bread extract samples under Elution Condition 1 | ||||||||
| C3a | 1172 | 0.40 | 469 | 69 | 99 | 0.223 | ||
| Bonusb | 1147 | 0.33 | 379 | 60 | 82 | 0.320 | ||
| Juice extract samples under Elution Condition 1 | ||||||||
| C3a | 1172 | 0.25 | 293 | 52 | 79 | 0.376 | ||
| Bonusb | 1147 | 0.31 | 356 | 59 | 84 | 0.173 | ||
| Yeast supernatant samples under Elution Condition 1 | ||||||||
| C3a | 1172 | 0.40 | 469 | 62 | 128 | 0.494 | ||
| Bonusb | 1147 | 0.40 | 459 | 52 | 111 | 0.477 | ||
| Human urine extract samples under Elution Condition 2 | ||||||||
| C3a | 1172 | 0.36 | 422 | 74 | 104 | 0.396 | ||
| Bonusb | 1147 | 0.33 | 379 | 66 | 94 | 0.451 | ||
C3: Zorbax 300SB-C3 (3.5 μ particles).
Bonus: Zorbax Bonus-RP (3.5 μ particles).
: Corrected LC × LC peak capacity.
fcoverage: Coverage factor.
: Effective LC × LC peak capacity.
Peaks1D: Peak number counted from 1DLC chromatograms.
Peaks2D: Peak number counted from LC × LC chromatograms.
r2: Coefficient of determination of peaks on LC × LC chromatograms.
Similar conclusions are reached by inspecting Figs. 7 and 8 based on the juice extract and yeast supernatant samples, respectively. The concentrations of compounds in juice extracts are low compared to those in the other samples. In Table 4, we see that fcoverage factors are relatively independent of the first dimension column; in particular that fcoverage factor is 0.4 for both the C3 and Bonus when the yeast supernatant was used. The largest variation of r2 was obtained when juice extract samples were used; it varied from 0.376 (C3) to 0.173 (Bonus), which confirms the small change in orthogonality when a carbon phase is paired with almost any first dimension bonded RP material.
Fig. 7.
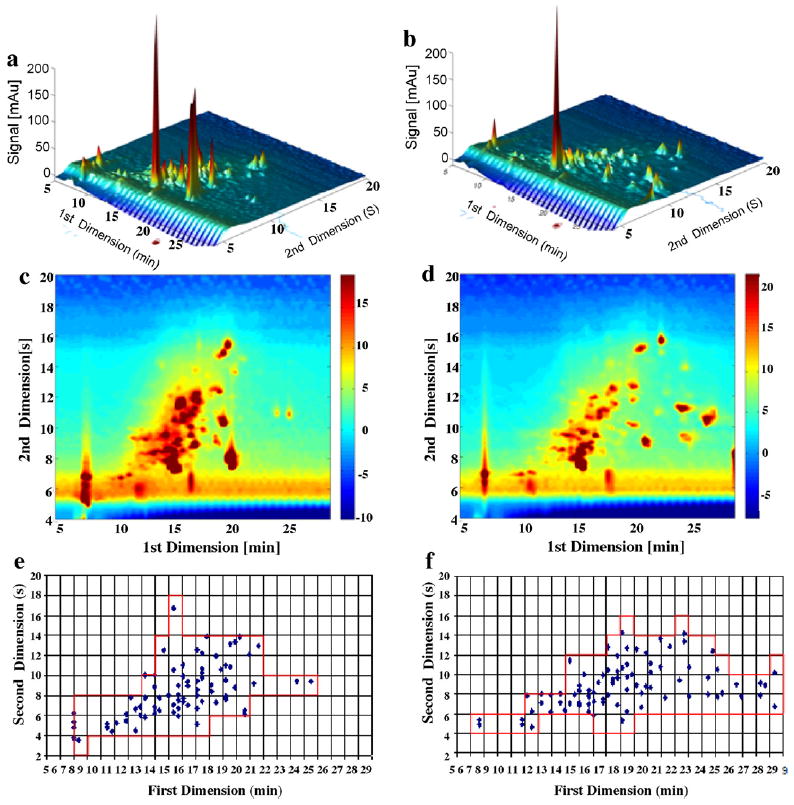
Comparison of C3 and Bonus phases in the first dimension when paired with carbon phase in the second dimension using juice extract samples under Elution Condition 1. (a) LC ×LC chromatogram when C3 in the first dimension; (b) LC × LC chromatogram when Bonus in the first dimension; (c) LC × LC contour plot when C3 in the first dimension; (d) LC × LC contour plot when Bonus in the first dimension; (e) LC × LC fcoverage plot when C3 in the first dimension; and (f) LC × LC fcoverage plot when Bonus in the first dimension.
Fig. 8.
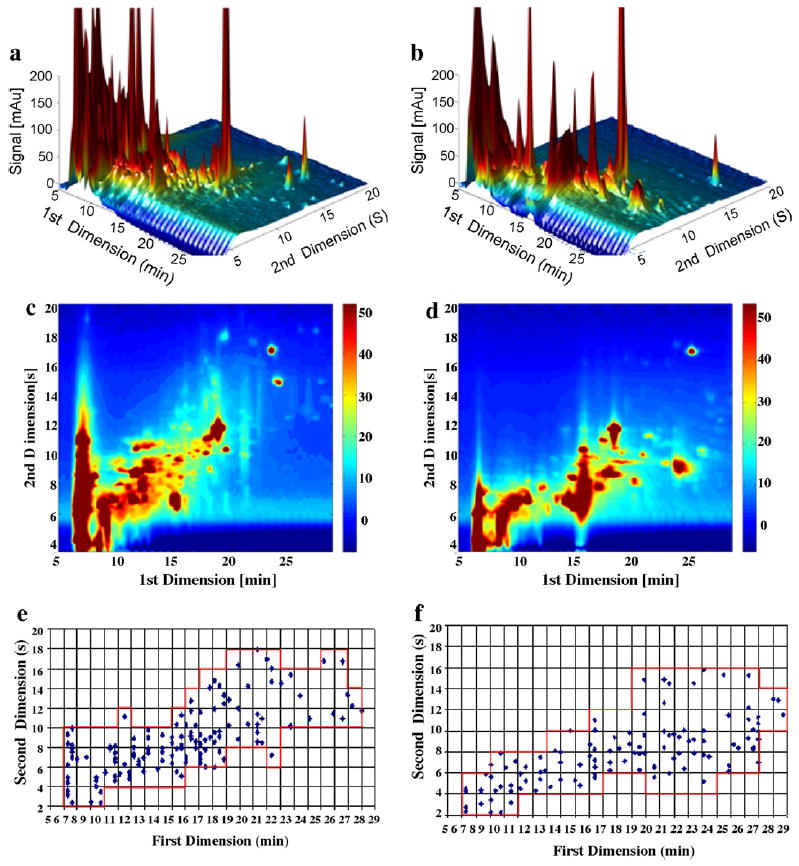
Comparison of C3 and Bonus phases in the first dimension when paired with carbon phase in the second dimension using yeast supernatant samples under Elution Condition 1. (a) LC × LC chromatogram when C3 in the first dimension; (b) LC × LC chromatogram when Bonus in the first dimension; (c) LC × LC contour plot when C3 in the first dimension; (d) LC × LC contour plot when Bonus in the first dimension; (e) LC × LC fcoverage plot when C3 in the first dimension; and (f) LC × LC fcoverage plot when Bonus in the first dimension.
3.4. Human urine extract samples under Elution Condition 2
From Fig. S3, it can be seen that Elution Condition 2 can be used for the urine extract samples to allow a fair comparison of first dimension columns. Conclusions similar to the above are reached based on the data of Fig. 9 and Table 4. The elution conditions must be considered when measuring orthogonality in LC × LC. When carbon is used in the second dimension, first dimension RP phases of widely different selectivity generate similar separation performance in LC × LC for various kinds of samples as long as the components elute from the first dimension columns before the end of the gradient.
Fig. 9.
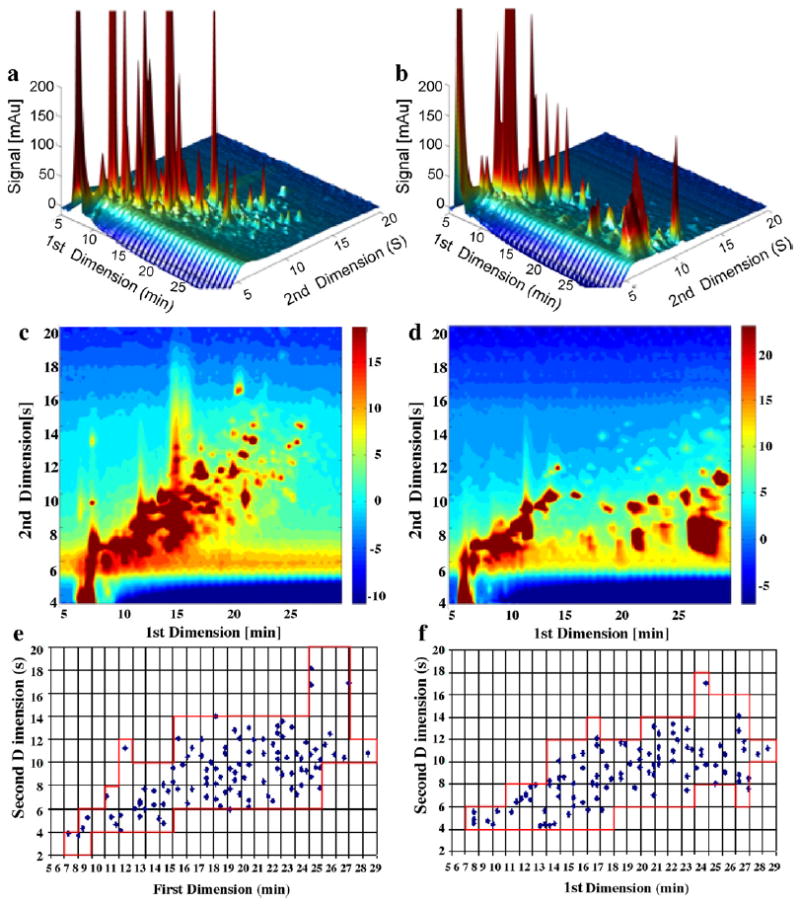
Comparison of C3 and Bonus phases in the first dimension when paired with carbon phase in the second dimension using human urine extract samples under Elution Condition 2. (a) LC × LC chromatogram when C3 in the first dimension; (b) LC × LC chromatogram when Bonus in the first dimension; (c) LC × LC contour plot when C3 in the first dimension; (d) LC × LC contour plot when Bonus in the first dimension; (e) LC × LC fcoverage plot when C3 in the first dimension; and (f) LC × LC fcoverage plot when Bonus in the first dimension.
4. Conclusion
In LC × LC, the first and second dimension phase must have sufficiently different selectivity to spread the constituents across the entire 2D separation space if the effective 2D peak capacity is to exceed the peak capacity of 1DLC. In this study we examined the effect of first dimension phase selectivity in LC × LC when a carbon clad phase was used as the second dimension. The main conclusions are as follows:
Carbon phases have rather different RP selectivity compared to the vast majority of bonded reversed phases. This resulted in very similar LC × LC chromatograms when six different bonded RP materials having quite different selectivities based on Snyder’s Fs were tested as the first dimension column provided that a carbon phase is always used as the second dimension. This observation was validated with a variety of samples.
The above observation greatly simplifies method development procedures in LC × LC especially the task of choosing the correct pair of phases for RPLCxRPLC. As long as carbon is used in the second dimension, there is a great freedom in choosing the first dimension.
Coefficient of variation (r2) values can be used to measure orthogonality between different phases. However, these are highly dependent on the type of sample and elution conditions.
Snyder’s Fs and selective triangles based on the HSM are quite useful in LC × LC for selecting stationary phase with different selectivities. The HSM provides a quantitative measure of orthogonality; selective triangles are a convenient approach for visual comparison of phases.
It appears that the first dimension eluent composition especially pH will likely have a greater effect for most biologically significant samples than will changes in the first dimension RP phase [57,61].
Supplementary Material
Acknowledgments
This work was supported by grants from the NIH (GM 054585) and the NSF (CHE-0911516). The authors would like to thank Agilent Technologies, Supelco, and ZirChrom Separations for their generous donation of columns. In addition, the authors acknowledge Prof. Jerry Cohen’s research group, Prof. Devin G. Peterson’s research group, and Dr. Fred Schendel all at the University of Minnesota for providing several samples used in this study.
Appendix A. Supplementary data
Supplementary data associated with this article can be found, in the online version, at doi:10.1016/j.chroma.2011.07.063.
References
- 1.Stoll DR, Li X, Wang X, Porter SEG, Rutan SC, Carr PW. J Chromatogr A. 2007;1168:3. doi: 10.1016/j.chroma.2007.08.054. [DOI] [PMC free article] [PubMed] [Google Scholar]
- 2.Francois I, Sandra K, Sandra P. Anal Chim Acta. 2009;641:14. doi: 10.1016/j.aca.2009.03.041. [DOI] [PubMed] [Google Scholar]
- 3.Dunn WB, Ellis DI. Trac-Trend Anal Chem. 2005;24:285. [Google Scholar]
- 4.Stoll DR. Anal Bioanal Chem. 2010;397:979. doi: 10.1007/s00216-010-3659-y. [DOI] [PubMed] [Google Scholar]
- 5.Carr PW, Stoll DR, Wang X. Anal Chem. 2011;83:1890. doi: 10.1021/ac102570t. [DOI] [PMC free article] [PubMed] [Google Scholar]
- 6.Guiochon G, Marchetti N, Mriziq K, Shalliker RA. J Chromatogr A. 2008;1189:109. doi: 10.1016/j.chroma.2008.01.086. [DOI] [PubMed] [Google Scholar]
- 7.Issaq HJ, Chan KC, Janini GM, Conrads TP, Veenstra TD. J Chromatogr B. 2005;817:35. doi: 10.1016/j.jchromb.2004.07.042. [DOI] [PubMed] [Google Scholar]
- 8.Gowda GAN, Zhang SC, Gu HW, Asiago V, Shanaiah N, Raftery D. Expert Rev Mol Diagn. 2008;8:617. doi: 10.1586/14737159.8.5.617. [DOI] [PMC free article] [PubMed] [Google Scholar]
- 9.Raftery D, Gowda GAN. J Urol. 2008;179:2089. doi: 10.1016/j.juro.2008.03.122. [DOI] [PubMed] [Google Scholar]
- 10.Alexander AJ, Ma L. J Chromatogr A. 2009;1216:1338. doi: 10.1016/j.chroma.2008.12.063. [DOI] [PubMed] [Google Scholar]
- 11.Im K, Park HW, Lee S, Chang T. J Chromatogr A. 2009;1216:4606. doi: 10.1016/j.chroma.2009.03.072. [DOI] [PubMed] [Google Scholar]
- 12.Giddings JC. Anal Chem. 1984;56:1258A. doi: 10.1021/ac00276a003. [DOI] [PubMed] [Google Scholar]
- 13.Schure MR. In: Multidimensional Liquid Chromatography: Theory, Instrumentation and Applications. Cohen SA, Schure MR, editors. Wiley & Sons; New York: 2008. [Google Scholar]
- 14.Karger B, Snyder LL, Horvath RC. An Introduction to Separation Science. Wiley & Sons; New York: 1973. [Google Scholar]
- 15.Guiochon G, Beaver LA, Gonnord MF, Siouff AM, Zakaria M. J Chromatogr. 1983;255:415. [Google Scholar]
- 16.Erni F, Frei RW. J Chromatogr. 1978;149:561. [Google Scholar]
- 17.Bushey MM, Jorgenson JW. Anal Chem. 1990;62:161. doi: 10.1021/ac00201a015. [DOI] [PubMed] [Google Scholar]
- 18.Stoll DR, Cohen JD, Carr PW. J Chromatogr A. 2006;1122:123. doi: 10.1016/j.chroma.2006.04.058. [DOI] [PubMed] [Google Scholar]
- 19.Stoll D, Wang RX, Carr PW. Anal Chem. 2007;80:268. doi: 10.1021/ac701676b. [DOI] [PubMed] [Google Scholar]
- 20.Huang Y, Gu H, Filgueira M, Carr PW. J Chromatogr A. 2011;1218:2984. doi: 10.1016/j.chroma.2011.03.032. [DOI] [PMC free article] [PubMed] [Google Scholar]
- 21.Li X, Stoll DR, Carr PW. Anal Chem. 2008;81:845. doi: 10.1021/ac801772u. [DOI] [PMC free article] [PubMed] [Google Scholar]
- 22.Potts LW, Stoll DR, Li XP, Carr PW. J Chromatogr A. 2010;1217:5700. doi: 10.1016/j.chroma.2010.07.009. [DOI] [PMC free article] [PubMed] [Google Scholar]
- 23.Horvath K, Fairchild JN, Guiochon G. Anal Chem. 2009;81:3879. doi: 10.1021/ac802694c. [DOI] [PubMed] [Google Scholar]
- 24.Jandera P, Cesla P, Hajek T, Vohralik G, Vynuchalova K, Fischer J. J Chromatogr A. 2008;1189:207. doi: 10.1016/j.chroma.2007.11.053. [DOI] [PubMed] [Google Scholar]
- 25.Cesla P, Hajek T, Jandera P. J Chromatogr A. 2009;1216:3443. doi: 10.1016/j.chroma.2008.08.111. [DOI] [PubMed] [Google Scholar]
- 26.Jandera P, Hajek T, Cesla P. J Sep Sci. 2010;33:1382. doi: 10.1002/jssc.200900808. [DOI] [PubMed] [Google Scholar]
- 27.Tanaka N, Kimura H, Tokuda D, Hosoya K, Ikegami T, Ishizuka N, Minakuchi H, Nakanishi K, Shintani Y, Furuno M, Cabrera K. Anal Chem. 2004;76:1273. doi: 10.1021/ac034925j. [DOI] [PubMed] [Google Scholar]
- 28.Schoenmakers PJ, Vivo-Truyols G, Decrop WMC. J Chromatogr A. 2006;1120:282. doi: 10.1016/j.chroma.2005.11.039. [DOI] [PubMed] [Google Scholar]
- 29.Gu H, Huang Y, Carr PW. J Chromatogr A. 2011;1218:64. doi: 10.1016/j.chroma.2010.10.096. [DOI] [PMC free article] [PubMed] [Google Scholar]
- 30.Murphy RE, Schure MR, Foley JP. Anal Chem. 1998;70:1585. doi: 10.1021/ac980719d. [DOI] [PubMed] [Google Scholar]
- 31.Giddings JC. J Chromatogr A. 1995;703:3. doi: 10.1016/0021-9673(95)00249-m. [DOI] [PubMed] [Google Scholar]
- 32.Gilar M, Olivova P, Daly AE, Gebler JC. Anal Chem. 2005;77:6426. doi: 10.1021/ac050923i. [DOI] [PubMed] [Google Scholar]
- 33.Davis JM, Stoll DR, Carr PW. Anal Chem. 2008;80:8122. doi: 10.1021/ac800933z. [DOI] [PMC free article] [PubMed] [Google Scholar]
- 34.Davis JM, Stoll DR, Carr PW. Anal Chem. 2008;80:461. doi: 10.1021/ac071504j. [DOI] [PubMed] [Google Scholar]
- 35.Schure MR. J Chromatogr A. 2011;1218:293. doi: 10.1016/j.chroma.2010.11.016. [DOI] [PubMed] [Google Scholar]
- 36.Hajek T, Skerikova V, Cesla P, Vynuchalova K, Jandera P. J Sep Sci. 2008;31:3309. doi: 10.1002/jssc.200800249. [DOI] [PubMed] [Google Scholar]
- 37.Vitha MF, Carr PW. J Phys Chem B. 2000;104:5343. [Google Scholar]
- 38.Huidobro AL, Pruim P, Schoenmakers P, Barbas C. J Chromatogr A. 2008;1190:182. doi: 10.1016/j.chroma.2008.02.114. [DOI] [PubMed] [Google Scholar]
- 39.Bedani F, Kok WT, Janssen HG. Anal Chim Acta. 2009;654:77. doi: 10.1016/j.aca.2009.06.042. [DOI] [PubMed] [Google Scholar]
- 40.Snyder LR, Dolan JW, Carr PW. J Chromatogr A. 2004;1060:77. [PubMed] [Google Scholar]
- 41.Simpkins SW, Bedard JW, Groskreutz SR, Swenson MM, Liskutin TE, Stoll DR. J Chromatogr A. 2010;1217:7648. doi: 10.1016/j.chroma.2010.09.023. [DOI] [PubMed] [Google Scholar]
- 42.Zhang Y, Carr PW. J Chromatogr A. 2009;1216:6685. doi: 10.1016/j.chroma.2009.06.048. [DOI] [PMC free article] [PubMed] [Google Scholar]
- 43.Forgacs E, Cserhati T. Chromatographia. 1992;33:356. [Google Scholar]
- 44.Jackson PT, Kim T, Carr PW. Anal Chem. 1997;69:5011. doi: 10.1021/ac970561h. [DOI] [PubMed] [Google Scholar]
- 45.Jackson PT, Carr PW. J Chromatogr A. 2002;958:121. doi: 10.1016/s0021-9673(02)00392-8. [DOI] [PubMed] [Google Scholar]
- 46.Knox JH, Kaur B, Millward GR. J Chromatogr. 1986;352:3. [Google Scholar]
- 47.Knox JH, Ross P. Adv Chromatogr. 1997;37:73. [PubMed] [Google Scholar]
- 48.Weber TP, Carr PW. Anal Chem. 1990;62:2620. [Google Scholar]
- 49.Weber TP, Carr PW, Funkenbusch EF. J Chromatogr. 1990;519:31. [Google Scholar]
- 50.Weber TP, Jackson PT, Carr PW. Anal Chem. 1995;67:3042. [Google Scholar]
- 51.Paek C, McCormick AV, Carr PW. J Chromatogr A. 2010;1217:6475. doi: 10.1016/j.chroma.2010.08.037. [DOI] [PMC free article] [PubMed] [Google Scholar]
- 52.Funkenbusch EF, Carr PW, Hanggi DA, Weber TP. Regents of the University of Minnesota, U S A. 1992 [Google Scholar]
- 53.Jackson P. Chemistry. University of Minnesota; Minneapolis: 1997. p. 331. [Google Scholar]
- 54.Jackson PT, Schure MR, Weber TP, Carr PW. Anal Chem. 1997;69:416. doi: 10.1021/ac960453f. [DOI] [PubMed] [Google Scholar]
- 55.Paek C, McCormick AV, Carr PW. J Chromatogr A. 2011;1218:1359. doi: 10.1016/j.chroma.2010.12.114. [DOI] [PMC free article] [PubMed] [Google Scholar]
- 56.Shalliker RA, Gray MJ. Adv Chromatogr (Boca Raton, FL, United States) 2006;44:177. doi: 10.1201/9781420027150.ch4. [DOI] [PubMed] [Google Scholar]
- 57.Li X, Carr PW. J Chromatogr A. 2011;1218:2214. doi: 10.1016/j.chroma.2011.02.019. [DOI] [PMC free article] [PubMed] [Google Scholar]
- 58.Zhang Y, Carr PW. J Chromatogr A. 2011;1218:763. doi: 10.1016/j.chroma.2010.11.009. [DOI] [PMC free article] [PubMed] [Google Scholar]
- 59.Mao Y, Carr PW. LC GC N Am. 2003;21:150. [Google Scholar]
- 60.Davis JM. 238th ACS Meeting; Washington, D.C. 2009. [Google Scholar]
- 61.Gilar M, Olivova P, Daly AE, Gebler JC. J Sep Sci. 2005;28:1694. doi: 10.1002/jssc.200500116. [DOI] [PubMed] [Google Scholar]
Associated Data
This section collects any data citations, data availability statements, or supplementary materials included in this article.


