

Abstract
Objective
The goal of this study was to test the ability of an injectable self-assembling peptide (KLD) hydrogel with or without chondrogenic factors (CF) and allogeneic bone marrow stromal cells (BMSCs) to stimulate cartilage regeneration in a full-thickness, critically-sized, rabbit cartilage defect model in vivo. We used CF treatments to test the hypotheses that CF would stimulate chondrogenesis and matrix production by cells migrating into acellular KLD (KLD+CF) or by BMSCs delivered in KLD (KLD+CF+BMSCs).
Design
Three groups were tested against contralateral untreated controls: KLD, KLD+CF, and KLD+CF+BMSCs, n=6–7. TGF-β1, dexamethasone, and IGF-1 were used as chondrogenic factors (CF) pre-mixed with KLD and BMSCs before injection. Evaluations included gross, histological, immunohistochemical and radiographic analyses.
Results
KLD without CF or BMSCs showed the greatest repair after 12 weeks with significantly higher Safranin-O, collagen II immunostaining, and cumulative histology scores than untreated contralateral controls. KLD+CF resulted in significantly higher aggrecan immunostaining than untreated contralateral controls. Including allogeneic BMSCs+CF markedly reduced the quality of repair and increased osteophyte formation compared to KLD alone.
Conclusions
These data show that KLD can fill full-thickness osteochondral defects in situ and improve cartilage repair as shown by Safranin-O, collagen II immunostaining, and cumulative histology. In this small animal model, the full-thickness critically-sized defect provided access to the marrow, similar in concept to abrasion arthroplasty or spongialization in large animal models, and suggests that combining KLD with these techniques may improve current practice.
Keywords: Bone marrow derived mesenchymal stem cells, cartilage, tissue engineering, rabbit model, self-assembling peptide scaffold
INTRODUCTION
Repair of articular cartilage injuries remains a challenge, despite the development of surgical treatments such as microfracture, abrasion arthroplasty, and spongialization, which are used with the goal of recruiting marrow-derived cells by penetration of the subchondral bone. While these techniques promote increased short-term healing, long-term repair still consists of mechanically-inferior fibrocartilage1. Recent research has focused on tissue engineering strategies using scaffolds to improve cartilage repair and regeneration. In particular, hydrogels made from materials such as chitosan-glycerol phosphate2, polyethyleneglycol (PEG)3, fibrin4, polyglycolic-co-lactic acid (PLGA)5, and collagen6 have been explored with the goal of improving the accumulation of extracellular matrix produced by cells (e.g., bone marrow stromal cells (BMSCs)) migrating into the scaffold from marrow.
Stimulation of BMSC chondrogenesis in vitro and in vivo has received much attention. In vitro studies have shown that transforming growth factor-β1 (TGF-β1), dexamethasone, and insulin-like growth factor-1 (IGF-1) promote chondrogenesis of BMSCs7–11, and methods for delivering these chondrogenic factors have been developed, often in conjunction with scaffolds12–15. There have been a number of in vivo studies performed delivering IGF-14,16, TGF-β11,17,18, or the combination of IGF-1 and TGF-β113,16,19 to cartilage defects in order to stimulate chondrogenesis of endogenous BMSCs, but to our knowledge, no in vivo studies have incorporated dexamethasone.
The hypothesis that delivery of exogenous BMSCs to the joint can enhance cartilage regeneration has prompted the exploration of a wide variety of growth factor and scaffold combinations to stimulate BMSC chondrogenesis1,20,21. In vivo studies have attempted to deliver BMSCs alone22,23, BMSCs encapsulated in scaffolds24–26, and BMSCs encapsulated in scaffolds with the inclusion of TGF-β127–30. Despite the in vitro promise shown by 3D-cultured BMSCs, most long-term in vivo treatments with BMSCs have resulted in sub-optimal cartilage repair tissue20,22,24,26. Improving BMSC chondrogenesis in vivo is likely dependent on several factors that are not well understood, including cell delivery, microenvironment, and a combination of pro-chondrogenic longitudinal signaling. In addition, an ideal clinical approach would minimize or obviate the in vitro culture duration and be performed with a single arthroscopic procedure.
Recent studies have shown that hydrogels made from the self-assembling peptide sequences (RADA)4 and (KLDL)3 (hereafter referred to as KLD) can maintain the chondrocyte phenotype31 and stimulate chondrogenesis of BMSCs in vitro32–34. These hydrogels have the ability to rapidly assemble when exposed to physiological pH and ionic strength35 and have pore sizes in the range of 100–500 nm36. These synthetic peptides have been used in vivo without immunogenic reaction37. Furthermore, TGF-β1 has been shown to adsorb to KLD when pre-mixed with the peptide solution prior to assembly, resulting in extended delivery of TGF-β1 to BMSCs and stimulating chondrogenesis in vitro, promoting sGAG production and accumulation comparable to continuous medium supplementation of TGF-β1 over 21 days38. In addition, including dexamethasone with TGF-β1 in medium supplementation during the in vitro culture of BMSCs in RADA results in less catabolic cleavage of aggrecan compared to culture with TGF-β1 alone39. Finally, IGF-1 can be tethered to peptide scaffolds via biotin-streptavidin bonds; this tethered IGF-1 has been shown to remain biologically active and to promote cell survival in rat cardiomyocytes over 28 days37.
The goal of this study was to test the ability of an injectable KLD hydrogel with or without BMSCs and chondrogenic factors (CF) to stimulate cartilage regeneration in vivo in a critically-sized rabbit full-thickness cartilage defect model. This model provides access to the marrow, analogous to abrasion arthroplasty or spongialization in large animal models. We used CF treatments (IGF-1, TGF-β1, and dexamethasone) to test the hypotheses that CF would stimulate chondrogenesis and matrix production (1) by cells migrating into acellular KLD and (2) by P2 passaged allogeneic BMSCs delivered in KLD. IGF-1 was tethered to the peptide with a biotin-streptavidin bond37 to stimulate long-term production of cartilage ECM, while TGF-β1 and dexamethasone were pre-mixed with KLD prior to BMSC encapsulation to stimulate chondrogenesis and initial matrix production. A 12-week timepoint enabled evaluation of mid-term benefits of the treatment compared to contralateral untreated defects.
METHODS
Materials
KLD peptide with the sequence AcN-(KLDL)3-CNH2 was synthesized by the MIT Biopolymers Laboratory (Cambridge, MA) using an ABI Model 433A peptide synthesizer with FMOC protection. Human recombinant TGF-β1 (R&D Systems, Inc., Minneapolis, MN), dexamethasone (Sigma-Aldrich, St. Louis, MO), sucrose (Sigma-Aldrich), biotinylated-IGF-1 (bIGF-1) (immunological and biochemical testsystems GmbH, Reutlingen Germany), streptavidin (Pierce Biotechnology, Inc, Rockford, IL), biotinylated-KLD (biotin-(aminocaproic acid)3-(KLDL)3 or b-KLD) (MIT Biopolymers Laboratory), FBS (Invitrogen, Carlsbad, CA), and FGF-2 (R&D Systems, Inc.) were purchased and used as described.
Cell Isolation
Bone marrow was harvested and pooled from four rabbits used for an initial pilot study, and BMSCs were isolated as previously described34. BMSCs were selected via differential adhesion to plastic and expanded two passages in alphaMEM with 10% FBS and 2 ng/mL FGF-2, 10 mM HEPES, and PSA (100 U/mL penicillin, 100 μg/mL streptomycin, and 250 ng/mL amphotericin), resulting in a total of approximately four population doublings. Each passage was conducted by seeding at a concentration of 12×103 BMSCs/cm2 and incubating for two days to allow BMSCs to grow to ~75% confluence.
In Vivo Study Design
All procedures were approved by the Animal Care and Use Committees at Colorado State University and Massachusetts Institute of Technology. Twenty skeletally mature, retired, female breeder New Zealand White rabbits (average age 11 months and body weight 4.7 kg) were used for this study (Myrtle’s Rabbitry, Thompson Station, TN). One rabbit died during the study due to neurologic problems post-surgery and was not included in the analysis. The n values shown in Table 1 do not reflect this animal. Three different groups were tested against contralateral, untreated, empty controls: (1) KLD, (2) KLD+chondrogenic factors (CF), and (3) KLD+CF+BMSCs (Table 1). For all groups, KLD was resuspended in 10% sterile sucrose, and the final KLD concentration was kept constant at 3.2 mg/mL. For groups 2 and 3, KLD peptide (48 μg) was pre-mixed with a CF mixture consisting of 1.4 ng TGF-β1, 0.6 ng dexamethasone, 4.1 ng biotinylated-IGF-1 (bIGF-1), 30.7 ng streptavidin, and 0.48 μg b-KLD. For group 3, 150×103 BMSCs were encapsulated in the KLD/CF mixture34. Encapsulation of BMSCs in vitro in this manner resulted in 80–90% viability. In vitro studies indicated that this amount of TGF-β1 would result in a concentration of TGF-β1 inside the scaffold sufficient to stimulate chondrogenesis38. At the same time, if all of the TGF-β1 were to be released from the scaffold at once into the joint space in vivo, it would amount to approximately 1 ng/mL concentration in the joint space (1.4 ng/1.4 mL joint space volume40), compared to the native concentration of 52.3 pg/mL found in adult rabbits40. Streptavidin and bIGF-1 were mixed at a 1:1 molar ratio in order to achieve, on average, binding of one bIGF-1 to each streptavidin allowing streptavidin to still bind b-KLD (in 100x molar excess of streptavidin and bIGF-1 to ensure homogeneous distribution of IGF-1 throughout the gel). The ability of this tethering to occur using these molar ratios has been shown in vitro and in vivo37. The amount of bIGF-1 tethered was chosen to provide a local concentration of 300 ng/mL inside the scaffold, which is above the threshold shown to be sufficient for chondrocyte stimulation of proteoglycan synthesis in vivo41.
Table 1.
Treatment groups with amounts delivered per animal.
| Group | n | KLD (μg) | bKLD (μg) | TGF-β1 (ng) | bIGF (ng) | Streptavidin (ng) | Dex (ng) | BMSCs (×103) |
|---|---|---|---|---|---|---|---|---|
| 1 (KLD) | 6 | 48 | 0.48 | 0 | 0 | 0 | 0 | 0 |
| 2 (KLD+CF) | 6 | 48 | 0.48 | 1.4 | 4.1 | 30.7 | 0.6 | 0 |
| 3 (KLD+CF+BMSCs) | 7 | 48 | 0.48 | 1.4 | 4.1 | 30.7 | 0.6 | 150 |
Defect Creation and Gel Injection
All surgical procedures were performed under inhalation general anesthesia. A medial-parapatellar arthrotomy approach to the femoropatellar joint was performed, and the patella was luxated laterally. A 3mm-diam × 2mm-deep full-thickness, critically-sized defect was created in the central region of the femoral trochlear groove (Fig 1). Direct pressure was applied with a surgical sponge to ensure all bleeding was stopped prior to application of the peptide, which was delivered as a liquid. Defects were filled with designated treatments (15 μL volume) or left untreated, as dictated by group assignment. The liquid peptide suspension could easily be seen filling the defect, and defects were filled until visually full. At this time, Lactated Ringer’s Solution was added to the joint periphery to gently fill the joint and cause polymerization of the peptide, which was visually inspected to ensure retention of the implant. Dorsal-caudal and lateral-medial 90° radiographs of each stifle joint were obtained immediately after surgery. At 12 weeks, rabbits were euthanized with pentobarbital after sedation. Post-surgical radiographic views were repeated following euthanasia.
Fig 1.
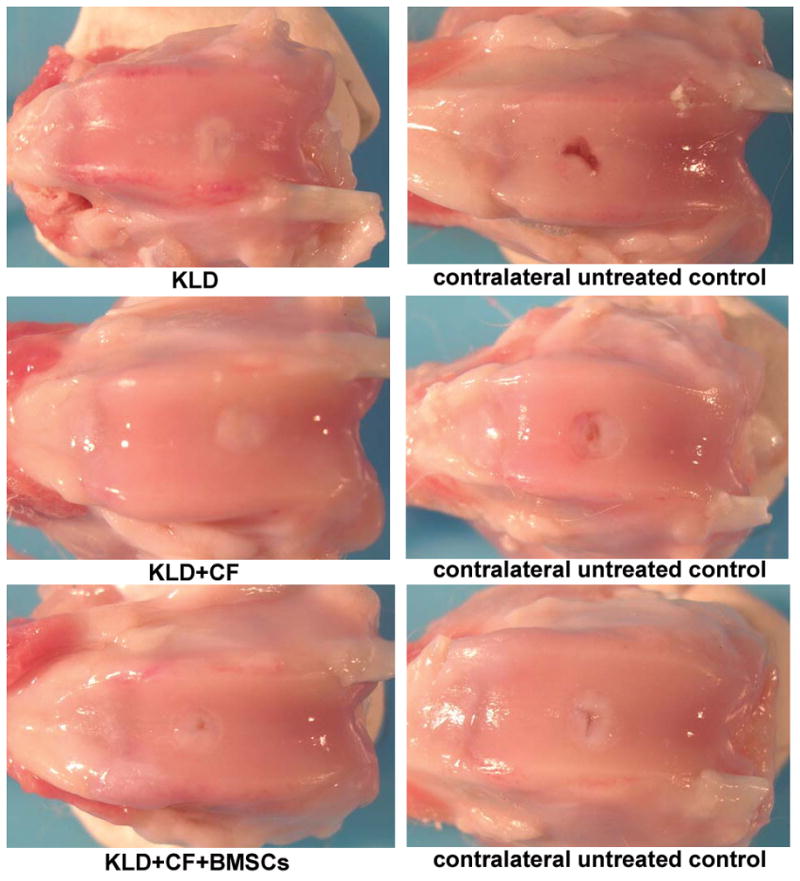
Gross necropsy photographs of treated and untreated joints in KLD, KLD+CF, and KLD+CF+BMSCs.
Gross Pathologic Observations of Joints
The limbs and joints were examined and graded by a blinded observer (DDF) unaware of treatment group (Table 2). For the muscle wastage measurement, the limbs were shaved and a flexible tape measure was used in a similar anatomic location of the stifle to make this assessment. This scoring system was chosen in order to compare to other studies performed by Frisbie et al.6
Table 2.
Gross Observations Scoring System.
| Feature | Score |
|---|---|
| I. Joint Observation | |
| Normal appearance | 0 |
| Slight inflammation | 1 |
| Moderate inflammation | 2 |
| Severe inflammation | 3 |
| II. Incision Appearance | |
| Normal appearance | 0 |
| Slight inflammation | 1 |
| Moderate inflammation | 2 |
| Severe inflammation | 3 |
| Slight dehiscence (incision basically intact) | 4 |
| Marked dehiscence (requires intervention) | 5 |
| Active infection | 6 |
| Healing infections | 7 |
| III. Muscle wastage at the time of necropsy in treated vs untreated limbs | |
| Circumferential measurement at the proximal aspect of the patella | (cm) |
| IV. Angle of Stifle: Change in normal angle (if any) | |
| None, within normal limits | 0 |
| Abnormal | 1 |
| V. Inflammation/Swelling | |
| None, within normal limits | 0 |
| Abnormal | 1 |
| VI. Trauma/Damage | |
| None, within normal limits | 0 |
| Abnormal | 1 |
| VII. Infection/Discharge | |
| None, within normal limits | 0 |
| Abnormal | 1 |
| VIII. Presence of Osteophytes and other Osteoarthritic Changes | |
| None, within normal limits | 0 |
| Abnormal | 1 |
| IX. Articular Surface Integrity, Contour, and Congruity | |
| Normal | 0 |
| Abnormal | 1 |
| X. Presence of Loose Bodies in Synovial Fluid | |
| None, within normal limits | 0 |
| Abnormal | 1 |
| XI. Injury to Apposing Articular Surface | |
| None, within normal limits | 0 |
| Abnormal | 1 |
| XII. Synovial Membrane Appearance | |
| Normal | 0 |
| Slight | 1 |
| Mild | 2 |
| Moderate | 3 |
| Severe | 4 |
| XIII. Cartilage Attachment | |
| This category describes on average the defect repair tissue attachment with the surrounding normal cartilage. Possible responses were: | |
| Normal Attachment | 0 |
| Moderate Attachment | 1 |
| Mild Attachment | 2 |
| Slight Attachment | 3 |
| No Attachment | 4 |
| XIV. Bone Attachment | |
| This category describes the firmness of the repair tissue attachment to the bone at the base of the defect. Possible responses were: | |
| Similar to Surrounding Cartilage | 0 |
| Slightly Soft-vs-Surrounding Cartilage | 1 |
| Mildly Soft-vs-Surrounding Cartilage | 2 |
| Moderately Soft-vs-Surrounding Cartilage | 3 |
| Marked Softening-vs-Surrounding Cartilage | 4 |
| XV. Firmness | |
| This category describes on average the firmness of the repair tissue to normal surrounding articular cartilage. Possible responses were: | |
| Similar Compared to Surrounding Cartilage | 0 |
| Slightly Soft Compared to Surrounding Cartilage | 1 |
| Mildly Soft Compared to Surrounding Cartilage | 2 |
| Moderately Soft Compared to Surrounding Cartilage | 3 |
| Marked Softening Compared to Surrounding Cartilage | 4 |
| XVI. Blood | |
| This category describes the presence or absence of hemorrhage associated with the defect area or its periphery. Possible responses were: | |
| Fresh Blood, Active Hemorrhage at Time of Surgery | 1 |
| Old Blood, No Active Hemorrhage at Time of Surgery | 2 |
| No Blood Visualized at Time of Surgery | 3 |
| XVII. Shape | |
| This category describes the margin of the defect as it relates to the original geometry at time 0 (creation). Possible responses were: | |
| No Apparent in Damage Tissue Beyond Defect | 0 |
| Degeneration in Tissue Beyond Defect | 1 |
| XVIII. Grade (Overall quality of repair) | |
| This category describes the overall subjective evaluation of the repair tissue by the evaluator. | |
| Criteria used to determine the grade were: | |
| (1) Attachment of repair tissue to the surrounding normal articular cartilage | |
| (2) Level (height) and undulation of the repair tissue surface as compared to the surrounding normal articular cartilage | |
| (3) Color of the repair tissue, where white homogenous tissue without a fibrous like appearance is used as the “gold standard.” | |
| Tissue Not Present to Grade | 0 |
| Poor | 1 |
| Fair | 2 |
| Good | 3 |
| Excellent | 4 |
| XIX. Level | |
| This category describes the level of repair tissue filling in association with the surrounding normal articular cartilage. | |
| Possible responses in relation to the surrounding normal articular cartilage were: | |
| Mildly Recessed | 1 |
| Slightly Recessed | 2 |
| Leveled | 3 |
| Slightly Elevated | 4 |
| Mildly Elevated | 5 |
| Moderately Elevated | 6 |
| XX. Color | |
| This category describes the color of the repair tissue. When repair tissue is characterized by two colors, the predominate color is indicated first. Possible responses were: | |
| Red | 1 |
| White/Red | 2 |
| Yellow | 3 |
| Yellow/White | 4 |
| White/Yellow | 5 |
| White | 6 |
| XXI. Surface | |
| This category describes the relative undulation of the repair tissue surface. Possible responses were: | |
| Non-Undulating | 1 |
| Slightly Undulating | 2 |
| Mildly Undulating | 3 |
| Moderatley Undulating | 4 |
| XXII. Area | |
| Percent of Surface Area Filled in Defect | (0–100%) |
| XXIII. Volume | |
| Percent of Volume Filled in Defect | (0–100%) |
Synovial Membrane Histology
Synovial membrane was harvested and placed in neutral-buffered 10% formalin, embedded in paraffin, 5-μm sections created and stained with hematoxylin and eosin (H&E). Sections were evaluated blindly (DDF) for cellular infiltration, vascularity, intimal hyperplasia, subintimal edema and subintimal fibrosis on a scale of 0–4 (0=none, 1=slight, 2=mild, 3=moderate, 4=severe)42.
Articular Cartilage Histology and Immunohistochemistry
At the time of necropsy, the circular defect area was cut in half with an Exakt bandsaw. The medial half of the repair tissue with surrounding native tissue was fixed in neutral-buffered 10% formalin for histology, and the lateral half was embedded in OCT and flash frozen for immunohistochemistry.
For histology, the fixed tissue was decalcified, embedded in paraffin, sectioned at 5 μm, and stained with either H&E or Safranin-O, fast green (SOFG) (ThermoScientific/Shandon VeriStain Gemini ES stainer) for proteoglycan visualization. Sections stained with H&E were evaluated blindly (DDF) using a modified O’Driscoll scoring system6,43 (Table 3) with a maximum cumulative histology score of 28 and a higher score indicating a repair more like native cartilage. Sections stained with SOFG were evaluated blindly (DDF) for intensity of staining on a scale of 0–3 (Table 3) and were included in the cumulative histology score.
Table 3.
Modified O’Driscoll Histological Scoring System.
| Feature | Score |
|---|---|
| I. Nature of the Repair Tissue | |
| Some Fibrocartilage, mostly nonchondrocytic cells | 0 |
| Mostly Fibrocartilage | 1 |
| Mixed Hyaline and Fibrocartilage | 2 |
| Mostly Hyaline Cartilage | 3 |
| Hyaline Cartilage | 4 |
| II. Surface Regularity | |
| Severe Disruption, Including Fibrillation | 0 |
| Fissures | 1 |
| Superficial Horizontal Lamination | 2 |
| Smooth and Intact | 3 |
| III. Structural Integrity (morphologic zone reconstitution) | |
| Severe Disintegration | 0 |
| Slight Disruption, Including Cysts | 1 |
| Normal | 2 |
| IV. Thickness | |
| 0% – 50% of Normal Cartilage | 0 |
| 50% – 100% of Normal Cartilage | 1 |
| 100% of Normal Adjacent Cartilage | 2 |
| V. Bonding to Adjacent Cartilage | |
| Not Bonded | 0 |
| Bonded at One End or Partially at Both Ends | 1 |
| Bonded at Both Ends of Graft | 2 |
| VI. Hypocellularity | |
| Moderate Hypocellularity | 0 |
| Slight Hypocellularity | 1 |
| Normal Cellularity | 2 |
| VII. Chondrocyte Clustering | |
| 25% – 100% of the Cells | 0 |
| < 25% of the Cells | 1 |
| No Clusters | 2 |
| VIII. Freedom from Degenerative Changes in Adjacent Cartilage | |
| Severe Hypocellularity, Poor or No Staining | 0 |
| Mild or Moderate Hypocellularity, Slight Staining | 1 |
| Normal Cellularity, Mild Clusters, Moderate Staining | 2 |
| Normal Cellularity, No Clusters, Normal Staining | 3 |
| IX. Reconstitution of Subchondral Bone | |
| No Subchondral Bone Reconstitution | 0 |
| Minimal Subchondral Bone Reconstitution | 1 |
| Reduced Subchondral Bone Reconstitution | 2 |
| Normal | 3 |
| X. Inflammatory Response in Subchondral Bone Region | |
| Severe | 0 |
| Moderate | 1 |
| None/Mild | 2 |
| XI. Safranin-O Staining | |
| None | 0 |
| Slight | 1 |
| Moderate | 2 |
| Normal | 3 |
| XII. Cumulative Histology Score (sum of above scores) | 0–28 |
For immunohistochemical analyses, frozen tissue was sectioned at 8 μm. Each section was incubated in 0.25 U/mL chondroitinase ABC (Sigma-Aldrich) for 15 min before incubation in primary antibody solution (Collagen I (1:10) #M-38-s and II (undiluted) # II-II6B3-s, Hybridoma Bank; Aggrecan (1:100, Alexis Biochemicals) #ALX-803-313; or rabbit IgG as control). Endogenous peroxidase was blocked using 0.3% H2O2 in methanol. Sections were incubated in goat anti-mouse HRP secondary antibody solution (1:500, Jackson Immunoresearch, Westgrove, PA)), stained with Vector Nova RED (Vector Laboratories, Burlingame, CA) and counterstained with Fast Green. Controls gave no signal. Non-calcified tissues were evaluated blindly (DDF) for the percentage of repair tissue stained positive (0=no stain, 1=1–25%, 2=26–50%, 3=51–75%, 4=76–100%).
Radiographic Analysis
Radiographs and photographs were taken of bone segments from femoral sections. Radiographs were graded for presence of lysis, bony proliferation, osteophyte presence, and patellar luxation, and a total radiographic score was calculated by summing these scores (maximum score of 16). All grading was done on a 0–4 scale (0=none, 1=slight, 2=mild, 3=moderate, 4=severe)22,42. Additionally, radiographs post-euthanasia were scored for healing of the defect (0=no healing, 1=slight healing, 2=mild bone filling, 3=lesion is visible but difficult to measure, 4=lesion not visible to measure), sclerosis around the defect, and other sclerosis (0–4, none-severe). Sclerosis is defined as the increase in density of bone seen radiographically and was subjectively scored by MFB in a blinded fashion.
Statistical Analyses
Scores were evaluated for inter- and intra-group differences using an ANOVA framework with PROC GLIMMIX (fits generalized linear mixed models) of SAS (Cary, NC)44 with rabbit as a random variable. For all joint pathologic, histological, immunohistochemical, and radiographic analyses, intra-group differences were analyzed with treatment set as the main effect (one-way); differences among groups were analyzed using treatment and group as main effects (two-way). Untreated controls were therefore analyzed separately depending on what treatment the contralateral joint received in order to account for possible systemic effects45. When main or interaction effects had p-values that were considered significant (p-value < 0.05) or a trend (0.05 < p-value <0.10), individual comparisons were made using the least square means procedure22. P-values presented in the text include which main effect or interaction term they are referring to if quoted for comparisons among groups. All data are presented as mean ± standard error of the mean (SEM). Non-parametric analyses were also performed when appropriate. The authors were able to reach similar conclusions based on either analysis. Because the authors feel many of the biologic outcome parameters represent more of a continuum rather than defined categories, the parametric analysis of the data is presented.
RESULTS
Radiographic Analyses
Radiographic analyses pre-treatment did not show any sclerosis in any of the rabbits. Treated defects post-treatment showed some slight osteophyte formation (0.3 (0.0, 0.6), treated; 0.1 (−0.2, 0.4), untreated; treatment p=0.087). There was no difference among groups (group p=0.490).
Gross Observation of Joints
Upon necropsy, joints and incision areas in all experimental groups appeared normal by gross examination (Fig 1), and no inflammation or infection was noted, indicating no adverse immune reaction to the treatments. Repair cartilage appeared to be moderately to normally attached to surrounding cartilage in all defects with no differences between treatments (treatment p=0.299) or groups (group p=0.541) (Table 4:XIII). Similarly, repair tissue ranged from normal to slightly-soft compared to surrounding tissue when assessed for attachment to the subchondral bone, with no differences between treatments (treatment p=0.192) or groups (group p=0.970) (Table 4:XIV). Rabbits receiving KLD+CF+BMSCs (group 3) demonstrated mild osteophyte formation, with an increased score compared to KLD-alone (group 1) (group p=0.029) (Table 4:VIII). Treated defects in group 3 also had better attachment to subchondral bone compared to untreated defects in group 3 (p=0.030) (Table 4:XIV). Overall, treated defects had an increased defect volume filled (91.4 (82.3, 100.4), treated vs. 78.2 (69.1, 87.3), untreated, treatment p= 0.032) and the level of treated defects was higher than contralateral untreated defects (2.6 (2.3, 3.0), treated; 2.2 (1.8, 2.6), untreated; treatment p=0.050). Untreated defects also had more muscle wastage at the site of incision (assessed by circumferential measurement at the proximal aspect of the patella) (12.9 cm (12.5, 13.2), treated vs. 12.7 cm (12.3, 13.0), untreated; treatment p=0.001), with group 1 and 3 treated defects different from their respective contralateral controls (Table 4:III; interaction p=0.032). Treated defects were scored higher in grade of repair compared to contralateral untreated defects, equivalent to a score of good (3.0 (2.6, 3.5), treated vs. 2.5 (2.0, 2.9), untreated, on a scale of 0–4; treatment p=0.061).
Table 4.
Gross Scores.
| Gross Scores | KLD | KLD+CF | KLD+CF+BMSCs | Two-way P-values | |||
|---|---|---|---|---|---|---|---|
| Feature | treated n=6 | untreated n=6 | treated n=6 | untreated n=6 | treated n=7 | untreated n=7 | |
| I. Joint Observation | 0 (0, 0) | 0 (0, 0) | 0 (0, 0) | 0 (0, 0) | 0 (0, 0) | 0 (0, 0) | |
| II. Incision Appearance | 0 (0, 0) | 0 (0, 0) | 0 (0, 0) | 0 (0, 0) | 0 (0, 0) | 0 (0, 0) | |
| III. Muscle wastage at the time of necropsy in treated vs untreated limbs (circumference in cm) | 12.8 (12.2, 13.4) | 12.4 (11.8, 13.0), p=0.010 | 12.8 (12.2, 13.4) | 12.7 (12.1, 13.3), p=0.530 | 13.0 (12.5, 13.6) | 12.9 (12.4, 13.5), p=0.049 |
TXT: 0.001 Group: 0.553 TXT*Group: 0.032 |
| IV. Angle of Stifle: Change in normal angle (if any) | 0 (0, 0) | 0 (0, 0) | 0 (0, 0) | 0 (0, 0) | 0 (0, 0) | 0 (0, 0) | |
| V. Inflammation/Swelling | 0 (0, 0) | 0 (0, 0) | 0 (0, 0) | 0 (0, 0) | 0 (0, 0) | 0 (0, 0) | |
| VI. Trauma/Damage | 0 (0, 0) | 0 (0, 0) | 0 (0, 0) | 0 (0, 0) | 0 (0, 0) | 0 (0, 0) | |
| VII. Infection/Discharge | 0 (0, 0) | 0 (0, 0) | 0 (0, 0) | 0 (0, 0) | 0 (0, 0) | 0 (0, 0) | |
| VIII. Osteophytes and other Osteoarthritic Changes | 0.0 (−0.3, 0.3) | 0.0 (−0.3, 0.3), p=1.000 | 0.2 (−0.2, 0.5) | 0.2 (−0.2, 0.5), p=1.000 | 0.6 (0.3, 0.9) | 0.6 (0.3, 0.9), p=1.000 |
TXT: 1.000 Group: 0.029 TXT*Group: 1.000 |
| IX. Articular Surface Integrity, Contour, and Congruity | 0 (0, 0) | 0 (0, 0) | 0 (0, 0) | 0 (0, 0) | 0 (0, 0) | 0 (0, 0) | |
| X. Presence of Loose Bodies in Synovial Fluid | 0 (0, 0) | 0 (0, 0) | 0 (0, 0) | 0 (0, 0) | 0 (0, 0) | 0 (0, 0) | |
| XI. Injury to Apposing Articular Surface | 0 (0, 0) | 0 (0, 0) | 0 (0, 0) | 0 (0, 0) | 0 (0, 0) | 0 (0, 0) | |
| XII. Synovial Membrane | 0.5 (0.0, 1.0) | 0.3 (−0.1, 0.8), p=0.611 | 0.2 (−0.3, 0.6) | 0.3 (−0.1, 0.8), p=0.562 | 0.1 (−0.3, 0.6) | 0.3 (−0.1, 0.7), p=0.356 |
TXT: 0.750 Group: 0.685 TXT*Group: 0.605 |
| XIII. Cartilage Attachment to surrounding cartilage | 0.7 (0.0, 1.4) | 1.0 (0.3, 1.7), p=0.530 | 0.5 (−0.2, 1.2) | 0.3 (−0.4, 1.0), p=0.611 | 0.4 (−0.2, 1.1) | 1.0 (0.3, 1.7), p=0.172 |
TXT: 0.299 Group: 0.541 TXT*Group: 0.423 |
| XIV. Bone Attachment | 0.3 (−0.3, 1.0) | 0.7 (0.0, 1.3), p=0.363 | 0.7 (0.0, 1.3) | 0.5 (−0.1, 1.1), p=0.695 | 0.3 (−0.3, 0.9) | 0.9 (0.3, 1.5), p=0.030 |
TXT: 0.192 Group: 0.970 TXT*Group: 0.262 |
| XV. Firmness | 0.7 (−0.1, 1.5) | 0.8 (0.0, 1.6), p=0.741 | 1.0 (0.2, 1.8) | 0.5 (−0.3, 1.3), p=0.296 | 0.4 (−0.3, 1.2) | 1.0 (0.3, 1.7), p=0.172 |
TXT: 0.750 Group: 0.995 TXT*Group: 0.222 |
| XVI. Blood | 3.0 (2.9, 3.1) | 3.0 (2.9, 3.1), p=1.000 | 3.0 (2.9, 3.1) | 3.0 (2.9, 3.1), p=1.000 | 3.0 (2.9, 3.1) | 2.9 (2.7, 3.0), p=0.356 |
TXT: 0.384 Group: 0.449 TXT*Group: 0.449 |
| XVII. Shape | 0 (0, 0) | 0 (0, 0) | 0 (0, 0) | 0 (0, 0) | 0 (0, 0) | 0 (0, 0) | |
| XVIII. Grade (Overall quality of repair) | 3.2 (2.3, 4.0) | 2.2 (1.3, 3.0), p=0.076 | 2.7 (1.8, 3.5) | 2.8 (2.0, 3.7), p=0.818 | 3.3 (2.5, 4.0) | 2.4 (1.7, 3.2), p=0.017 |
TXT: 0.061 Group: 0.896 TXT*Group: 0.220 |
| XIX. Level | 2.7 (2.0, 3.3) | 2.0 (1.3, 2.7), p=0.102 | 2.5 (1.8, 3.2) | 2.3 (1.7, 3.0), p=0.695 | 2.7 (2.1, 3.3) | 2.3 (1.7, 2.9), p=0.200 |
TXT: 0.050 Group: 0.897 TXT*Group: 0.613 |
| XX. Color | 5.8 (4.7, 6.9) | 4.7 (3.6, 5.8), p=0.126 | 4.8 (3.7, 5.9) | 4.8 (3.7, 5.9), p=1.000 | 5.9 (4.8, 6.9) | 5.3 (4.3, 6.3), p=0.231 |
TXT: 0.182 Group: 0.363 TXT*Group: 0.547 |
| XXI. Surface | 1.8 (1.2, 2.5) | 2.2 (1.5, 2.8), p=0.465 | 1.5 (0.8, 2.2) | 2.0 (1.3, 2.7), p=0.296 | 1.7 (1.1, 2.3) | 2.0 (1.4, 2.6), p=0.457 |
TXT: 0.127 Group: 0.753 TXT*Group: 0.925 |
| XXII. Area | 94.2 (80.2, 108.2) | 90.0 (76.0, 104.0), p=0.383 | 95.7 (81.7, 109.7) | 90.0 (76.0, 104.0), p=0.441 | 97.1 (84.2, 110.1) | 82.9 (69.9, 95.8), p=0.276 |
TXT: 0.138 Group: 0.902 TXT*Group: 0.681 |
| XXIII. Volume | 91.7 (75.6, 107.8) | 71.7 (55.6, 87.8), p=0.058 | 88.2 (72.1, 104.3) | 80.8 (64.7, 96.9), p=0.477 | 94.3 (79.4, 109.2) | 82.1 (67.2, 97.0), p=0.297 |
TXT: 0.032 Group: 0.706 TXT*Group: 0.667 |
One-way p-values for within group comparisons are listed in the untreated columns. Two-way p-values for differences among groups are in a separate column (TXT = treatment, Group = group, TXT*Group = interaction term). P-values are not shown when all the scores being compared are zero. Mean and confidence intervals calculated during two-way analysis are shown.
Histologic Examinations
Synovial Membrane H&E
Evaluation of the synovial membrane by H&E staining showed some mild intimal hyperplasia and some mild to moderate vascularity and subintimal fibrosis, but there were no differences among any groups or treatments.
Articular Cartilage H&E
Assessment of the articular cartilage H&E staining showed that KLD (group 1) had a higher cumulative histology score compared to contralateral untreated controls when looking at that group alone (Table 5:XII, p=0.034). Overall, when comparing among groups, KLD and KLD+CF (groups 1 and 2) had higher cumulative scores than KLD+CF+BMSCs (group 3) (Table 5:XII, group p=0.030). Defects treated with KLD received the highest score for nature of predominant tissue in the defect (see Tables 3, 5:I), which was similar to fibrocartilage. The other groups and treatments ranged between 0 and 1, indicating presence of some fibrocartilage and some non-chondrocytic cells; however, none of the groups or treatments were significantly different (Table 5:I, group p=0.749, treatment p=0.264). Group 3 had significantly lower surface regularity with scores indicative of some fissuring of the surface (Tables 3,5:II, group p=0.005) and more degenerative change in cartilage surrounding the defect, showing mild to moderate hypocellularity compared to KLD and KLD+CF (Tables 3,5:VIII, group p=0.015). Group 2 had more reconstitution of subchondral bone than group 3 (group p=0.030), but all groups were still below normal subchondral bone levels (Tables 3,5: IX); treated defects trended higher than untreated defects (1.9 (1.5, 2.2) treated; 1.5 (1.1, 1.8) untreated; treatment p=0.074). Group 2 also showed the highest score for bonding to adjacent cartilage (Table 5:V), but no groups or treatments were significantly different (treatment p=0.161, group p=0.226). Treated defects had increased cellularity (Table 3:VI) compared to contralateral untreated defects (treatment p=0.031) showing normal to slight hypocellularity in the treated defects repair tissue (1.8 (1.5, 2.0) treated; 1.6 (1.3, 1.8) untreated); group 3 trended higher than the other groups (2.0 (1.7, 2.3) group 3; 1.5 (1.1, 1.9) groups 1 and 2; group p=0.081).
Table 5.
Histological Scores.
| Histology Scores | KLD | KLD+CF | KLD+CF+BMSCs | Two-way P-values | |||
|---|---|---|---|---|---|---|---|
| Feature | treated n=6 | untreated n=6 | treated n=6 | untreated n=6 | treated n=7 | untreated n=7 | |
| I. Nature of the Repair Tissue | 1.0 (0.4, 1.6) | 0.7 (0.1, 1.3), p=0.363 | 0.7 (0.1, 1.3) | 0.7 (0.1, 1.3), p=1.000 | 0.9 (0.3, 1.4) | 0.4 (−0.1, 1.0), p=0.134 |
TXT: 0.264 Group: 0.749 TXT*Group: 0.710 |
| II. Surface Regularity | 2.5 (1.8, 3.2) | 2.2 (1.5, 2.9), p=0.175 | 2.0 (1.3, 2.7) | 1.7 (1.0, 2.4), p=0.465 | 1.4 (0.8, 2.1) | 0.9 (0.2, 1.5), p=0.298 |
TXT: 0.130 Group: 0.005 TXT*Group: 0.906 |
| III. Structural Integrity | 1.3 (0.9, 1.7) | 1.0 (0.6, 1.4), p=0.175 | 1.2 (0.8, 1.6) | 1.2 (0.8, 1.6), p=1.000 | 0.9 (0.5, 1.2) | 0.7 (0.3, 1.1), p=0.563 |
TXT: 0.284 Group: 0.118 TXT*Group: 0.655 |
| IV. Thickness | 1.7 (1.1, 2.2) | 1.2 (0.6, 1.7), p=0.237 | 1.5 (1.0, 2.0) | 1.7 (1.1, 2.2), p=0.611 | 1.3 (0.8, 1.8) | 1.3 (0.8, 1.8), p=1.000 |
TXT: 0.583 Group: 0.478 TXT*Group: 0.396 |
| V. Bonding to Adjacent Cartilage | 0.7 (0.1, 1.3) | 1.0 (0.4, 1.6), p=0.363 | 1.3 (0.7, 1.9) | 1.3 (0.7, 1.9), p=1.000 | 0.6 (0.0, 1.1) | 1.0 (0.4, 1.6), p=0.200 |
TXT: 0.161 Group: 0.226 TXT*Group: 0.580 |
| VI. Hypocellularity | 1.7 (1.3, 2.1) | 1.3 (0.9, 1.7), p=0.175 | 1.7 (1.3, 2.1) | 1.3 (0.9, 1.7), p=0.175 | 2.0 (1.6, 2.4) | 2.0 (1.6, 2.4), p=1.000 |
TXT: 0.031 Group: 0.081 TXT*Group: 0.259 |
| VII. Chondrocyte Clustering | 1.7 (1.3, 2.0) | 1.8 (1.5, 2.2), p=0.363 | 1.7 (1.3, 2.0) | 1.7 (1.3, 2.0), p=1.000 | 1.9 (1.5, 2.2) | 2.0 (1.7, 2.3), p=0.356 |
TXT: 0.364 Group: 0.397 TXT*Group: 0.809 |
| VIII. Freedom from Degenerative Changes in Adjacent Cartilage | 1.7 (1.2, 2.2) | 1.8 (1.3, 2.3), p=0.611 | 1.8 (1.3, 2.3) | 2.2 (1.7, 2.7), p=0.363 | 1.3 (0.8, 1.8) | 1.0 (0.5, 1.5), p=0.172 |
TXT: 0.658 Group: 0.015 TXT*Group: 0.270 |
| IX. Reconstitution of Subchondral Bone | 1.8 (1.2, 2.4) | 1.5 (0.9, 2.1), p=0.363 | 2.2 (1.6, 2.8) | 2.0 (1.4, 2.6), p=0.695 | 1.6 (1.0, 2.1) | 0.9 (0.3, 1.4), p=0.074 |
TXT: 0.074 Group: 0.030 TXT*Group: 0.556 |
| X. Inflammatory Response in Subchondral Bone Region | 2.0 (1.9, 2.1) | 1.8 (1.7, 2.0), p=0.363 | 2.0 (1.9, 2.1) | 2.0 (1.9, 2.1), p=1.000 | 2.0 (1.9, 2.1) | 2.0 (1.9, 2.1), p=1.000 |
TXT: 0.306 Group: 0.358 TXT*Group: 0.358 |
| XI. Safranin-O Staining | 1.2 (0.6, 1.7) | 0.2 (−0.4, 0.7), p=0.012 | 0.3 (−0.2, 0.9) | 0.5 (−0.0, 1.0), p=0.611 | 0.3 (−0.2, 0.8) | 0.6 (0.1, 1.1), p=0.337 |
TXT: 0.286 Group: 0.604 TXT*Group: 0.011 |
| XII. Cumulative Histology Score (sum of above scores) | 17.2 (14.8, 19.5) | 14.5 (12.2, 16.8), p=0.034 | 16.3 (14.0, 18.7) | 16.2 (13.8, 18.5), p=0.915 | 14.0 (11.8, 16.2) | 12.7 (10.5, 14.9), p=0.417 |
TXT: 0.140 Group: 0.030 TXT*Group: 0.541 |
One-way p-values for within group comparisons are listed in the untreated columns. Two-way p-values for differences among groups are in a separate column (TXT = treatment, Group = group, TXT*Group = interaction term). Mean and confidence intervals calculated during two-way analysis are shown.
Articular Cartilage SOFG
Defects treated with KLD-alone (group 1) had increased Safranin-O staining (scores of slight to moderate staining) than the contralateral untreated defects or treated defects in groups 2 and 3, which had only none to slight staining (Table 5:XI, interaction p=0.011). There was no overall effect of treatment or group on this measure (treatment p=0.286, group p=0.604). As shown in Fig 2, treatment with KLD-alone resulted in greater staining throughout the repair tissue.
Fig 2.

Safranin-O staining. Images showing histological evaluation of representative treatment groups and representative contralateral control knees. Treatment and contralateral pictures were representative of the mean scores and were taken from different animals for KLD and KLD+CF+BMSCs, and from the same animal for KLD+CF. Scale bar = 1 mm.
Immunohistochemistry Evaluations
Looking at only group 1, defects treated with KLD showed increased collagen II immunostaining compared to contralateral untreated defects (Table 6:III, p=0.028); although aggrecan immunostaining for defects treated with KLD received a score of 2.7, it was not different from the contralateral untreated control (Table 6:I, p=0.526). This is in contrast to the difference observed in Safranin-O staining between defects treated with KLD and the contralateral untreated defects. In group 2, KLD+CF treatment elicited a tissue with higher aggrecan detected by immunostaining vs. the contralateral untreated control (Table 6:I, p=0.041). In addition, although defects treated with KLD+CF received the highest collagen II immunostaining score of all the groups, 3.4, this was not different from its contralateral untreated control (Table 6:III, p=0.110). Comparing all defects, treated defects had more collagen II (2.9 (2.2, 3.6) treated; 1.6 (0.9, 2.2) untreated; treatment p=0.001) and increased aggrecan (2.9 (2.3, 3.4) treated; 2.1 (1.6, 2.7) untreated; treatment p=0.056) compared to untreated defects; there were no differences among groups (group p=0.293). There were similar levels of collagen I immunostaining found in all the defects (treatment p=0.471, group p=0.919), consistent with the observation of mostly fibrocartilage seen in the gross scoring (Table 6:II). Overall, within the repair tissues, collagen II immunostaining was observed deeper in the sections and collagen I immunostaining was seen more in the superficial. Aggrecan immunostaining was noted to have a more generalized distribution, but more positive staining was seen deeper in the repair tissue.
Table 6.
Immunohistochemical Scores.
| IHC Scores | KLD | KLD+CF | KLD+CF+BMSCs | Two-way p-values | |||
|---|---|---|---|---|---|---|---|
| Feature | treated | untreated | treated | untreated | treated | untreated | |
| I. Aggrecan | 2.7 (1.7, 3.6) n=6 | 2.2 (1.2, 3.1), p=0.526, n=6 | 3.3 (2.4, 4.3) n=6 | 2.3 (1.4, 3.3), p=0.041, n=6 | 2.6 (1.7, 3.5) n=7 | 1.9 (1.0, 2.7), p=0.253, n=7 |
TXT: 0.056 Group: 0.384 TXT*Group: 0.857 |
| II. Collagen I | 2.7 (1.5, 3.9) n=6 | 3.0 (1.8, 4.2), p=0.638, n=6 | 2.8 (1.5, 4.1) n=5 | 3.3 (2.1, 4.5), p=0.528, n=6 | 2.8 (1.6, 4.0) n=6 | 3.0 (1.8, 4.2), p=0.858, n=6 |
TXT: 0.471 Group: 0.919 TXT*Group: 0.950 |
| III. Collagen II | 3.2 (2.0, 4.3) n=6 | 1.3 (0.2, 2.5), p=0.028, n=6 | 3.3 (2.1, 4.5) n=5 | 2.2 (1.0, 3.3), p=0.110, n=6 | 2.2 (1.0, 3.3) n=6 | 1.2 (0.0, 2.3), p=0.144, n=6 |
TXT: 0.001 Group: 0.293 TXT*Group: 0.551 |
One-way p-values for within group comparisons are listed in the untreated columns. Two-way p-values for differences among groups are in a separate column (TXT = treatment, Group = group, TXT*Group = interaction term). Mean and confidence intervals calculated during two-way analysis are shown.
DISCUSSION
Treatment of full-thickness articular cartilage defects with the self-assembling peptide KLD (group 1) markedly improved cartilage regeneration, as seen by significant increases in cumulative histology score, Safranin-O staining, and collagen II immunostaining, compared to critically-sized contralateral untreated defects. KLD has several advantages as a material due to its ability to be injected arthroscopically into a defect, assemble on contact with tissue, and promote cartilage regeneration without inducing an immune response. Adding TGF-β1, dexamethasone, and IGF-1 to KLD (group 2) resulted in increased aggrecan immunostaining compared to its contralateral untreated defect, but in general did not result in any additional beneficial or deleterious effects compared to KLD alone (group 1). Motivated by in vitro results supporting BMSC chondrogenesis33,34,38, we delivered these factors with allogeneic BMSCs in KLD in vivo (group 3). However, this treatment resulted in a poorer repair than with KLD or KLD+CF. This is similar to other reports of fibrous tissue formation after BMSC treatment23,24,26, interpreted as a negative result.
In our rabbit model, the presence of a full-thickness defect allowed bone marrow to infiltrate the defect46 and act as a cell source, similar to abrasion arthroplasty and subchondral bone microfracture surgical techniques. The positive healing response seen with KLD treatment (group 1) demonstrates that the scaffold supports cell migration and further chondrogenesis of these cells in vivo. The high porosity of this scaffold (~99.6% water content31) is in agreement with a recent in vivo study in rabbits by Ikeda et al.47 demonstrating that scaffolds with >85% porosity promoted migration of bone marrow cells into polymer scaffolds and with an in vitro study by Wang et al.48 demonstrating endothelial cell migration into several types of self-assembling hydrogels.
Regarding group 2, KLD+CF treatment, our results raise the issues of whether the CF dose was appropriate to improve endogenous cell response and whether cells migrating into the scaffold in vivo respond differently to these CFs than in vitro and thereby require different stimulation. The inclusion of CFs did not show increased chondrogenesis over KLD alone (group 1) as determined by cumulative histology score, Safranin-O, aggrecan, and type II collagen immunostaining. Similar to these results, Holland et al.13 reported that TGF-β1 and IGF-1 delivered in gelatin microparticles within an acellular oligo(poly(ethylene glycol) fumarate) (OPF) scaffold resulted in repair no different than in empty defects, despite positive results in vitro. That study also delivered IGF-1 alone and found that this growth factor alone resulted in a significantly improved repair. In addition, other studies have looked at delivering IGF-1 alone in vivo and have reported similar positive results4,16. While we did not test the effects of IGF-1 alone in this study, our results emphasize the need for further understanding of the combination of IGF-1 with other CF in vivo in order to take advantage of its characteristic anabolic properties.
The intra-articular use of TGF-β1 remains controversial due to the pro-inflammatory response by the synovium seen at certain concentrations. Van der Kraan and van den Berg et al. have studied the interaction of TGF-β1 with various joint tissues and have shown that while TGF-β1 can stimulate proteoglycan production in cartilage, when it is exposed to synovial tissue, synovial fibrosis can occur; TGF-β1-induced osteophyte formation is also common18. Mi et al.17 showed that injection of recombinant adenoviral vector for hTGF-β1 into the knee joint space through the patellar tendon (resulting in ~8.75 ng TGF-β1) dramatically increased joint inflammation, though this dose is more than 6-fold higher than our total dose of 1.4 ng. Accordingly, we did not observe these effects when TGF-β1 was added to the peptide alone (group 2). In contrast, when TGF-β1 was added in combination with BMSCs (group 3), osteophyte formation increased, suggesting an interaction of TGF-β1 with these cells was responsible for the increased osteogenesis rather than the presence of TGF-β1 alone in the joint (group 2). This finding is similar to results recently published by Guo et al.27, in which 600 ng of TGF-β1 per mL of hydrogel was used in combination with BMSCs in an OPF scaffold. Furthermore, we observed a detrimental increase in osteophyte formation and distortion of normal joint anatomy when, in the same rabbit, 1.4 ng TGF-β1+BMSCs were placed in one joint and 0.7 ng TGF-β1+BMSCs in the contralateral joint49. The authors were surprised at this result given the total body dose of TGF-β1 was only 1.5x what was used in group 2 or group 3 and the cell numbers 2-fold greater. While the amount of TGF-β1 delivered in group 3 of our study was lower than that in the Mi17 study, and we attempted to deliver TGF-β1 in a controlled fashion, it is still possible that this TGF-β1 level was too high to beneficially induce chondrogenesis when combined with BMSCs, despite the inclusion of dexamethasone, which has been shown to enhance chondrogenesis compared to TGF-β1 alone9,50. A study by Fan et al. using only 0.8 ng of TGF-β1 with BMSCs in a gelatin-chondroitin-hyaluronate tri-copolymer scaffold reported improved rabbit cartilage defect healing compared to treatment with BMSCs implanted in a scaffold without TGF-β1. Taken together, these studies suggest that while the amount of TGF-β1 we chose combined with BMSCs effectively induces chondrogenesis in vitro38, additional research is needed to determine a successful strategy for optimizing chondrogenesis of BMSCs in vivo, and interactions with synovial tissues must be considered.
Due to the often noted ability of cartilage defects in young/skeletally immature rabbits to heal well naturally46, we used skeletally mature rabbits with average age of 11 months and critically-sized defects in order to test the ability of treatment to improve adult animal healing. Although full-thickness defects were used, defects only entered the subchondral/trabecular bone, resulting in contralateral untreated defects that do not heal spontaneously by 12 weeks. These results are similar to other studies using similar-aged rabbits and defect sizes. A limitation of our model is the lack of enough tissue to perform direct biochemical assessment in addition to histological and immunohistochemical measurements in this study. However, the purpose of the present study was to perform an initial trial prior to a larger animal study where such additional measures will be utilized, since ample tissue will be available.
In summary, the self-assembling peptide hydrogel KLD offers a new material suitable for further testing in a clinically relevant defect in a large animal. We demonstrated improved filling of osteochondral defects and improved cartilage repair, as seen by cumulative histology score, Safranin-O staining, and type II collagen immunostaining. In this small animal model, the full-thickness defect provided access to the marrow, similar in concept to abrasion arthroplasty or spongialization in large animal models (goat, sheep, horse, human), and suggests that combining KLD with these techniques may offer an improvement over current practice. Ongoing studies include the evaluation of KLD in a clinically relevant sized equine defect co-treated with microfracture and subjected to strenuous exercise, compared to defects treated with microfracture alone.
Acknowledgments
Supported in part by NIH Grants EB003805 and AR33236, NSF and NDSEG graduate fellowships (REM) and an Arthritis Foundation Postdoctoral Fellowship (EJV).
ROLE OF THE FUNDING SOURCE: NIH-NIBIB Grant EB003805; NDSEG and NSF graduate fellowships (RM); Arthritis Foundation Postdoctoral Fellowship (EJV).
Footnotes
CONFLICT OF INTEREST: No conflicts of interest to report.
AUTHOR CONTRIBUTIONS: Rachel E. Miller: conception, analysis and interpretation, drafting
Alan J. Grodzinsky: conception, interpretation, revising, funding (alg@mit.edu)
Eric J. Vanderploeg: conception, revising
Christina Lee: acquisition of data, revising
Dora J. Ferris: acquisition of data, revising
Myra F. Barrett: acquisition of data, revising
John D. Kisiday: conception, acquisition, revising
David D. Frisbie: conception, acquisition, analysis, statistical expertise, interpretation, revising, funding (dfrisbie@colostate.edu)
Publisher's Disclaimer: This is a PDF file of an unedited manuscript that has been accepted for publication. As a service to our customers we are providing this early version of the manuscript. The manuscript will undergo copyediting, typesetting, and review of the resulting proof before it is published in its final citable form. Please note that during the production process errors may be discovered which could affect the content, and all legal disclaimers that apply to the journal pertain.
References
- 1.Getgood A, Brooks R, Fortier L, Rushton N. Articular cartilage tissue engineering. J Bone Joint Surg Br. 2009;91-B:565–576. doi: 10.1302/0301-620X.91B5.21832. [DOI] [PubMed] [Google Scholar]
- 2.Hoemann C, Sun J, McKee M, Chevrier A, Rossomacha E, Rivard G-E, et al. Chitosan-glycerol phosphate/blood implants elicit hyaline cartilage repair integrated with porous subchondral bone in microdrilled rabbit defects. Osteoarthritis and Cartilage. 2007;15:78–89. doi: 10.1016/j.joca.2006.06.015. [DOI] [PubMed] [Google Scholar]
- 3.Wang D-A, Varghese S, Sharma B, Strehin I, Fermanian S, Gorham J, et al. Multifunctional chondroitin sulphate for cartilage tissue-biomaterial integration. Nat Mater. 2007;6:385–392. doi: 10.1038/nmat1890. [DOI] [PMC free article] [PubMed] [Google Scholar]
- 4.Nixon A, Fortier L, Williams J, Mohammed H. Enhanced repair of extensive articular defects by insulin-like growth factor-I-laden fibrin composites. J Orthop Res. 1999;17:475–487. doi: 10.1002/jor.1100170404. [DOI] [PubMed] [Google Scholar]
- 5.Wegener B, Schrimpf F, Pietschmann M, Milz S, Berger-Lohr M, Bergschmidt P, et al. Matrix-guided cartilage regeneration in chondral defects. Biotechnol Appl Biochem. 2009;53:63–70. doi: 10.1042/BA20080020. [DOI] [PubMed] [Google Scholar]
- 6.Frisbie D, Bowman S, Colhoun H, DiCarlo E, Kawcak C, McIlwraith C. Evaluation of autologous chondrocyte transplantation via a collagen membrane in equine articular defects-results at 12 and 18 months. Osteoarthritis and Cartilage. 2008;16:667–679. doi: 10.1016/j.joca.2007.09.013. [DOI] [PubMed] [Google Scholar]
- 7.Janjanin S, Li W-J, Morgan MT, Shanti RM, Tuan RS. Mold-Shaped, Nanofiber Scaffold-Based Cartilage Engineering Using Human Mesenchymal Stem Cells and Bioreactor. J Surg Res. 2008;149:47–56. doi: 10.1016/j.jss.2007.12.788. [DOI] [PMC free article] [PubMed] [Google Scholar]
- 8.Longobardi L, O’Rear L, Aakula S, Johnstone B, Shimer K, Chytil A, et al. Effect of IGF-I in the Chondrogenesis of Bone Marrow Mesenchymal Stem Cells in the Presence or Absence of TGF-β1 Signaling. J Bone Miner Res. 2006;21:626–636. doi: 10.1359/jbmr.051213. [DOI] [PubMed] [Google Scholar]
- 9.Johnstone B, Hering TM, Caplan AI, Goldberg VM, Yoo JU. In Vitro Chondrogenesis of Bone Marrow-Derived Mesenchymal Progenitor Cells. Experimental Cell Research. 1998;238:265–272. doi: 10.1006/excr.1997.3858. [DOI] [PubMed] [Google Scholar]
- 10.Indrawattana N, Chen G, Tadokoro M, Shann LH, Ohgushi H, Tateishi T, et al. Growth factor combination for chondrogenic induction from human mesenchymal stem cell. Biochem Biophys Res Commun. 2004;320:914–919. doi: 10.1016/j.bbrc.2004.06.029. [DOI] [PubMed] [Google Scholar]
- 11.Worster AA, Brower-Toland BD, Fortier LA, Bent SJ, Williams J, Nixon AJ. Chondrocytic differentiation of mesenchymal stem cells sequentially exposed to transforming growth factor-b1 in monolayer and insulin-like growth factor-I in a three-dimensional matrix. J Orthop Res. 2001;19:738–749. doi: 10.1016/S0736-0266(00)00054-1. [DOI] [PubMed] [Google Scholar]
- 12.Jaklenec A, Hinckfuss A, Bilgen B, Ciombor DM, Aaron R, Mathiowitz E. Sequential release of bioactive IGF-I and TGF-β1 from PLGA microsphere-based scaffolds. Biomaterials. 2008;29:1518–1525. doi: 10.1016/j.biomaterials.2007.12.004. [DOI] [PubMed] [Google Scholar]
- 13.Holland TA, Bodde EWH, Cuijpers VMJI, Baggett LS, Tabata Y, Mikos AG, et al. Degradable hydrogel scaffolds for in vivo delivery of single and dual growth factors in cartilage repair. Osteoarthritis Cartilage. 2007;15:187–197. doi: 10.1016/j.joca.2006.07.006. [DOI] [PubMed] [Google Scholar]
- 14.Elisseeff J, McIntosh W, Fu K, Blunk T, Langer R. Controlled-release of IGF-1 and TGF-β1 in a photopolymerizing hydrogel for cartilage tissue engineering. J Orthop Res. 2001;19:1098–1104. doi: 10.1016/S0736-0266(01)00054-7. [DOI] [PubMed] [Google Scholar]
- 15.Park K-H, Park W, Na K. Synthetic matrix containing glucocorticoid and growth factor for chondrogenic differentiation of stem cells. J Biosci Bioeng. 2009;108:168–173. doi: 10.1016/j.jbiosc.2009.03.008. [DOI] [PubMed] [Google Scholar]
- 16.Schmidt M, Chen E, Lynch S. A review of the effects of insulin-like growth factor and platelet-derived growth factor on in vivo cartilage healing and repair. Osteoarthritis Cartilage. 2006;14:403–412. doi: 10.1016/j.joca.2005.10.011. [DOI] [PubMed] [Google Scholar]
- 17.Mi Z, Ghivizzani S, Lechman E, Glorioso J, Evans C, Robbins P. Adverse effects of adenovirus-mediated gene transfer of human TGF-β1 into rabbit knees. Arthritis Res Ther. 2003;5:R132–R139. doi: 10.1186/ar745. [DOI] [PMC free article] [PubMed] [Google Scholar]
- 18.Davidson ENB, van der Kraan P, van den Berg W. TGF-b and osteoarthritis. Osteoarthritis Cartilage. 2007;15:597–604. doi: 10.1016/j.joca.2007.02.005. [DOI] [PubMed] [Google Scholar]
- 19.Hunziker E. Growth-factor-induced healing of partial-thickness defects in adult articular cartilage. Osteoarthritis Cartilage. 2001;9:22–32. doi: 10.1053/joca.2000.0346. [DOI] [PubMed] [Google Scholar]
- 20.Hwang NSP, Elisseeff JP. Application of Stem Cells for Articular Cartilage Regeneration. J Knee Surg. 2009;22:60–71. doi: 10.1055/s-0030-1247728. [DOI] [PubMed] [Google Scholar]
- 21.Noth U, Steinert AF, Tuan RS. Technology Insight: adult mesenchymal stem cells for osteoarthritis therapy. Nat Rev Rheumatol. 2008;4:371–380. doi: 10.1038/ncprheum0816. [DOI] [PubMed] [Google Scholar]
- 22.Frisbie D, Kisiday J, Kawcak C, Werpy N, McIlwraith C. Evaluation of adipose-derived stromal vascular fraction or bone marrow-derived mesenchymal stem cells for treatment of osteoarthritis. J Orthop Res. 2009 doi: 10.1002/jor.20933. in press. [DOI] [PubMed] [Google Scholar]
- 23.Murphy J, Fink D, Hunziker E, Barry F. Stem cell therapy in a caprine model of osteoarthritis. Arthritis Rheum. 2003;48:3464–3474. doi: 10.1002/art.11365. [DOI] [PubMed] [Google Scholar]
- 24.Wakitani S, Mitsuoka T, Nakamura N, Toritsuka Y, Nakamura Y, Horibe S. Autologous bone marrow stromal cell transplantation for repair of full-thickness articular cartilage defects in human patellae: two case reports. Cell Transplant. 2004;13:595–600. doi: 10.3727/000000004783983747. [DOI] [PubMed] [Google Scholar]
- 25.Li W, Chiang H, Kuo T, Lee H, Jiang C, Tuan R. Evaluation of articular cartilage repair using biodegradable nanofibrous scaffolds in a swine model. J Tissue Eng Regen Med. 2009;3:1–10. doi: 10.1002/term.127. [DOI] [PMC free article] [PubMed] [Google Scholar]
- 26.Wilke M, Nydam D, Nixon A. Enhanced early chondrogenesis in articular defects following arthroscopic mesenchymal stem cell implantation in an equine model. J Orthop Res. 2007;25:913–925. doi: 10.1002/jor.20382. [DOI] [PubMed] [Google Scholar]
- 27.Guo X, Park H, Young S, Kretlow J, van den Beucken J, Baggett L, et al. Repair of osteochondral defects with biodegradeable hydrogel composites encapsulating marrow mesenchymal stem cells in a rabbit model. Acta Biomaterialia. 2010;6:39–47. doi: 10.1016/j.actbio.2009.07.041. [DOI] [PMC free article] [PubMed] [Google Scholar]
- 28.Diao H, Wang J, Shen C, Xia S, Guo T, Dong L, et al. Improved cartilage regeneration utilizing mesenchymal stem cells in TGF-β1 gene-activated scaffolds. Tissue Eng Part A. 2009;15:2687–2698. doi: 10.1089/ten.TEA.2008.0621. [DOI] [PubMed] [Google Scholar]
- 29.Fan H, Hu Y, Qin L, Li X, Wu H, Lv R. Porous gelatin-chondroitin-hyaluronate tri-copolymer scaffold containing microspheres loaded with TGF-β1 induces differentiation of mesenchymal stem cells in vivo for enhancing cartilage repair. J Biomed Mater Res A. 2006;77:785–794. doi: 10.1002/jbm.a.30647. [DOI] [PubMed] [Google Scholar]
- 30.Guo C-A, Liu X-G, Huo J-Z, Jiang C, Wen X-J, Chen Z-R. Novel gene-modified-tissue engineering of cartilage using stable transforming growth factor-β1-transfected mesenchymal stem cells grown on chitosan scaffolds. J Biosci Bioeng. 2007;103:547–556. doi: 10.1263/jbb.103.547. [DOI] [PubMed] [Google Scholar]
- 31.Kisiday J, Jin M, Kurz B, Hung H, Semino C, Zhang S, et al. Self-assembling peptide hydrogel fosters chondrocyte extracellular matrix production and cell division: Implications for cartilage tissue repair. Proc Natl Acad Sci USA. 2002;99:9996–10001. doi: 10.1073/pnas.142309999. [DOI] [PMC free article] [PubMed] [Google Scholar]
- 32.Erickson IE, Huang AH, Chung C, Li RT, Burdick JA, Mauck RL. Differential maturation and structure-function relationships in mesenchymal stem cell- and chondrocyte-seeded hydrogels. Tissue Eng Part A. 2009;15:1041–52. doi: 10.1089/ten.tea.2008.0099. [DOI] [PMC free article] [PubMed] [Google Scholar]
- 33.Kisiday J, Kopesky P, Evans C, Grodzinsky AJ, McIlwraith C, Frisbie D. Evaluation of adult equine bone marrow- and adipose-derived progenitor cell chondrogenesis in hydrogel cultures. J Orthop Res. 2008;26:322–331. doi: 10.1002/jor.20508. [DOI] [PubMed] [Google Scholar]
- 34.Kopesky P, Vanderploeg E, Sandy J, Kurz B, Grodzinsky AJ. Self-assembling peptide hydrogels modulate in vitro chondrogenesis of bovine bone marrow stromal cells. Tissue Eng Part A. 2010;16:465–477. doi: 10.1089/ten.tea.2009.0158. [DOI] [PMC free article] [PubMed] [Google Scholar]
- 35.Zhang S, Holmes T, Lockshin C, Rich A. Spontaneous Assembly of a Self-Complementary Oligopeptide to Form a Stable Macroscopic Membrane. Proc Natl Acad Sci USA. 1993;90:3334–3338. doi: 10.1073/pnas.90.8.3334. [DOI] [PMC free article] [PubMed] [Google Scholar]
- 36.Sieminski AL, Semino CE, Gong H, Kamm RD. Primary sequence of ionic self-assembling peptide gels affects endothelial cell adhesion and capillary morphogenesis. J Biomed Mater Res A. 2008;87:494–504. doi: 10.1002/jbm.a.31785. [DOI] [PubMed] [Google Scholar]
- 37.Davis ME, Hsieh PCH, Takahashi T, Song Q, Zhang S, Kamm RD, et al. Local myocardial insulin-like growth factor 1 (IGF-1) delivery with biotinylated peptide nanofibers improves cell therapy for myocardial infarction. Proc Natl Acad Sci USA. 2006;103:8155–8160. doi: 10.1073/pnas.0602877103. [DOI] [PMC free article] [PubMed] [Google Scholar]
- 38.Kopesky P, Vanderploeg E, Kisiday J, Frisbie D, Sandy J, Grodzinsky A. Controlled delivery of TGF-b1 by self-assembling peptide hydrogels induces chondrogenesis of bone marrow stromal cells and modulates Smad2/3 signaling. Tissue Eng Part A. 2010 doi: 10.1089/ten.tea.2010.0198. In Press. [DOI] [PMC free article] [PubMed] [Google Scholar]
- 39.Florine E, Vanderploeg E, Kopesky P, Miller R, Grodzinsky AJ. 56th Trans Orthop Res Soc. New Orleans: 2010. Dexamethasone Suppresses Aggrecan Catabolism in BMSC-seeded Peptide Hydrogels. (Abstract) [Google Scholar]
- 40.Wei X, Messner K. Age- and injury-dependent concentrations of transforming growth factor-β1 and proteoglycan fragments in rabbit knee joint fluid. Osteoarthritis Cartilage. 1998;6:10–18. doi: 10.1053/joca.1997.0087. [DOI] [PubMed] [Google Scholar]
- 41.Fortier LA, Mohammed HO, Lust G, Nixon AJ. Insulin-like growth factor-I enhances cell-based repair of articular cartilage. J Bone Joint Surg Br. 2002;84-B:276–288. doi: 10.1302/0301-620x.84b2.11167. [DOI] [PubMed] [Google Scholar]
- 42.Frisbie D, Ghivizzani S, Robbins PD, Evans C, McIlwraith C. Treatment of experimental equine osteoarthritis by in vivo delivery of the equine interleukin-1 receptor antagonist gene. Gene Ther. 2002;9:12–20. doi: 10.1038/sj.gt.3301608. [DOI] [PubMed] [Google Scholar]
- 43.Rutgers M, van Pelt M, Dhert W, Creemers L, Saris D. Evaluation of histological scoring systems for tissue-engineered, repaired, and osteoarthritic cartilage. Osteoarthritis Cartilage. 2010;18:12–23. doi: 10.1016/j.joca.2009.08.009. [DOI] [PubMed] [Google Scholar]
- 44.Anonymous. The GLIMMIX Procedure. SAS Institute Inc; Cary, NC: 2006. p. 943. [Google Scholar]
- 45.Homandberg G, Kang Y, Zhang J, Cole A, Williams J. A single injection of fibronectin fragments into rabbit knee joints enhances catabolism in the articular cartilage followed by reparative responses but also induces systemic effects in the non-injected knee joints. Osteoarthritis Cartilage. 2001;9:673–683. doi: 10.1053/joca.2001.0419. [DOI] [PubMed] [Google Scholar]
- 46.Shapiro F, Koide S, Glimcher M. Cell origin and differentiation in the repair of full-thickness defects of articular cartilage. J Bone Joint Surg Am. 1993;75:532–553. doi: 10.2106/00004623-199304000-00009. [DOI] [PubMed] [Google Scholar]
- 47.Ikeda R, Fujioka H, Nagura I, Kokubu T, Toyokawa N, Inui A, et al. The effect of porosity and mechanical property of a synthetic polymer scaffold on repair of osteochondral defects. Int Orthop. 2009;33:821–828. doi: 10.1007/s00264-008-0532-0. [DOI] [PMC free article] [PubMed] [Google Scholar]
- 48.Wang X, Horii A, Zhang S. Designer functionalized self-assembling peptide nanofiber scaffolds for growth, migration, and tubulogenesis of human umbilical vein endothelial cells. Soft Matter. 2008;4:2388–2395. [Google Scholar]
- 49.Miller R, Grodzinsky AJ, Vanderploeg E, Lee C, Ferris DJ, Barrett MF, et al. 56th Trans Orthop Res Soc. New Orleans: 2010. Repair of Full-Thickness Articular Cartilage Defect Using Self-Assembling Peptide, Growth Factors, and BMSCs. (Abstract) [Google Scholar]
- 50.Mouw JK, Connelly JT, Wilson CG, Michael KE, Levenston ME. Dynamic Compression Regulates the Expression and Synthesis of Chondrocyte-Specific Matrix Molecules in Bone Marrow Stromal Cells. Stem Cells. 2007;25:655–663. doi: 10.1634/stemcells.2006-0435. [DOI] [PubMed] [Google Scholar]