

Abstract
The past five years have seen many scientific and biological discoveries made through the experimental design of genome-wide association studies (GWASs). These studies were aimed at detecting variants at genomic loci that are associated with complex traits in the population and, in particular, at detecting associations between common single-nucleotide polymorphisms (SNPs) and common diseases such as heart disease, diabetes, auto-immune diseases, and psychiatric disorders. We start by giving a number of quotes from scientists and journalists about perceived problems with GWASs. We will then briefly give the history of GWASs and focus on the discoveries made through this experimental design, what those discoveries tell us and do not tell us about the genetics and biology of complex traits, and what immediate utility has come out of these studies. Rather than giving an exhaustive review of all reported findings for all diseases and other complex traits, we focus on the results for auto-immune diseases and metabolic diseases. We return to the perceived failure or disappointment about GWASs in the concluding section.
Main Text
Introduction: Have GWASs Been a Failure?
In the past five years, genome-wide association studies (GWASs) have led to many scientific discoveries, and yet at the same time, many people have pointed to various problems and perceived failures of this experimental design. Let us begin by considering a number of criticisms that have been made against GWASs. We do not list these quotes to discredit any of the scientists or journalists involved, nor to deliberately cite them out of context. Rather, they serve to confirm that the points we discuss in this review are related to beliefs held by a significant number of scientific commentators and therefore warrant consideration.
From an interview with Sir Alec Jeffreys, ESHG Award Lecturer 2010:
“One of the great hopes for GWAS was that, in the same way that huge numbers of Mendelian disorders were pinned down at the DNA level and the gene and mutations involved identified, it would be possible to simply extrapolate from single gene disorders to complex multigenic disorders. That really hasn't happened. Proponents will argue that it has worked and that all sorts of fascinating genes that predispose to or protect against diabetes or breast cancer, for example, have been identified, but the fact remains that the bulk of the heritability in these conditions cannot be ascribed to loci that have emerged from GWAS, which clearly isn't going to be the answer to everything.”
From McCLellan and King, Cell 20101:
“To date, genome-wide association studies (GWAS) have published hundreds of common variants whose allele frequencies are statistically correlated with various illnesses and traits. However, the vast majority of such variants have no established biological relevance to disease or clinical utility for prognosis or treatment.”
“An odds ratio of 3.0, or even of 2.0 depending on population allele frequencies, would be robust to such population stratification. However, odds ratios of the magnitude generally detected by GWAS (<1.5) can frequently be explained by cryptic population stratification, regardless of the p value associated with them.”
“More generally, it is now clear that common risk variants fail to explain the vast majority of genetic heritability for any human disease, either individually or collectively (Manolio et al., 2009).”
“The general failure to confirm common risk variants is not due to a failure to carry out GWAS properly. The problem is underlying biology, not the operationalization of study design. The common disease–common variant model has been the primary focus of human genomics over the last decade. Numerous international collaborative efforts representing hundreds of important human diseases and traits have been carried out with large well-characterized cohorts of cases and controls. If common alleles influenced common diseases, many would have been found by now. The issue is not how to develop still larger studies, or how to parse the data still further, but rather whether the common disease–common variant hypothesis has now been tested and found not to apply to most complex human diseases.”
From Nicholas Wade in the New York Times, March 20 2011:
“More common diseases, like cancer, are thought to be caused by mutations in several genes, and finding the causes was the principal goal of the $3 billion human genome project. To that end, medical geneticists have invested heavily over the last eight years in an alluring shortcut. But the shortcut was based on a premise that is turning out to be incorrect. Scientists thought the mutations that caused common diseases would themselves be common. So they first identified the common mutations in the human population in a $100 million project called the HapMap. Then they compared patients' genomes with those of healthy genomes. The comparisons relied on ingenious devices called SNP chips, which scan just a tiny portion of the genome. (SNP, pronounced “snip,” stands for single nucleotide polymorphism.) These projects, called genome-wide association studies, each cost around $10 million or more. The results of this costly international exercise have been disappointing. About 2,000 sites on the human genome have been statistically linked with various diseases, but in many cases the sites are not inside working genes, suggesting there may be some conceptual flaw in the statistics. And in most diseases the culprit DNA was linked to only a small portion of all the cases of the disease. It seemed that natural selection has weeded out any disease-causing mutation before it becomes common.”
From Tim Crow, Molecular Psychiatry 20112:
“There comes a point at which the genetic skeptic can be pardoned the suggestion that if the genes are so small and so multiple, what they are hardly matters, the dividing line between polygenes and no genes is of little practical consequence. Have we reached this point”?
From a commentary article by Jonathan Latham, on guardian.co.uk, 17 April 2011:
“Among all the genetic findings for common illnesses, such as heart disease, cancer and mental illnesses, only a handful are of genuine significance for human health. Faulty genes rarely cause, or even mildly predispose us, to disease, and as a consequence the science of human genetics is in deep crisis.
Since the Collins paper [Manolio et al. 20093] was published nothing has happened to change that conclusion. It now seems that the original twin-study critics were more right than they imagined. The most likely explanation for why genes for common diseases have not been found is that, with few exceptions, they do not exist.”
These quotes raise a number of different issues about the methodology, research outcomes, and utility of the research findings. The pertinent points made in these quotes are:
-
(1)
GWASs are founded on a flawed assumption that genetics plays an important role in the risk to common diseases;
-
(2)
GWASs have been disappointing in not explaining more genetic variation in the population;
-
(3)
GWASs have not delivered meaningful, biologically relevant knowledge or results of clinical or any other utility; and
-
(4)
GWAS results are spurious.
In this review we will briefly give the history of GWASs and then focus on the discoveries made through this experimental design, what those discoveries tell us and do not tell us about the genetics and biology of complex traits, and what immediate utility has come out of these studies. We will focus on the results for auto-immune diseases and metabolic diseases, although there have been important findings for other diseases and complex traits. In the concluding section, we will again consider the perceived failure or disappointment of GWASs.
What Are GWASs, and How Did We Get There?
Attempts to use linkage analysis to map genomic loci that have an effect on disease or other complex traits have been ubiquitous in the last two decades. Gene mapping by linkage relies on the cosegregation of causal variants with marker alleles within pedigrees. We define and discuss what we mean by “causal” in Box 1. Because the number of recombination events per meiosis is relatively small, tagging a causal variant requires only a few genetic markers per chromosome. The downside of the small number of recombination events is that the mapping resolution, i.e., how close to the causal variant one can get through linked markers, is typically low. Linkage mapping has been extremely successful in mapping genes and gene variants affecting Mendelian traits (e.g., single-gene disorders).4 Mapping loci underlying common diseases and, in particular, identifying causative mutations have had much less success. There are many reasons for the failure of linkage analyses to reliably identify complex-trait loci in human pedigrees. One reason is that the effect sizes (“penetrance”) of individual causal variants are too small to allow detection via cosegregation within pedigrees.
Box 1. What Is a Causal Variant?
New mutations that contribute to an increase or decrease in risk to disease arise in populations all the time. Some of these mutations can reach an appreciable frequency in the population, for example by random drift or by natural selection. As discussed in the main text, these mutations will be associated with other variants in the genome through LD. Such associations will include those with SNPs that are genotyped on “SNP chips.” Because there are many more segregating variants in the population than those genotyped in GWASs, it is unlikely, but not impossible, that a mutation is genotyped itself, and so its effect usually will be detected through an association with a genotyped variant. This genotyped variant can be robustly associated with disease in multiple samples from the same population, or even across populations, but it is not the mutation that causes variation in risk. The results from GWASs have shown that variants at many genetic loci in the genome are associated with disease, and these also reflect many ancestral mutations with an effect on susceptibility to disease. Therefore, the effect size (in terms of increasing or decreasing the absolute probability of disease) is, on average, small, and individual variants are neither necessary nor sufficient to cause disease. Herein lies the problem of defining “causal”: How do we prove that a particular mutation causes the observed effect on variation in the population? Engineering the same mutation in a cell or animal model might give a relevant phenotype, but that is not a proof. The mutation can have a direct effect on gene expression in human tissues or be functional in another way, but that doesn't prove it has a causal effect on disease risk. Operationally, in this review what we mean by “causal variant” is an (unknown) variant that has a direct or indirect functional effect on disease risk, rather than a variant that is associated with disease risk through LD, even if we don't have the tools available at present to prove causality beyond reasonable doubt. Hence, it is the variant that causes the observed association signal.
GWASs are based upon the principle of linkage disequilibrium (LD) at the population level. LD is the nonrandom association between alleles at different loci. It is created by evolutionary forces such as mutation, drift, and selection and is broken down by recombination.5 Generally, loci that are physically close together exhibit stronger LD than loci that are farther apart on a chromosome. The larger the (effective) population size, the weaker the LD for a given distance.6 (Linkage analysis exploits the large LD within pedigrees.) The genomic distance at which LD decays determines how many genetic markers are needed to “tag” a haplotype, and the number of such tagging markers is much smaller than the total number of segregating variants in the population. For example, a selection of approximately 500,000 common SNPs in the human genome is sufficient to tag common variation in non-African populations, even though the total number of common SNPs exceeds 10 million.7
Geneticists realized some time ago that they could exploit population-based LD to map genes. For example, Bodmer suggested in 1986 that fine-mapping using population association could lead to closer linkage between a causative mutation and a linked marker.82 However, fine-mapping still relied on having an initial genomic location that is obtained from linkage analysis in family studies. What if we do not have any prior information on genomic loci or, alternatively, we deliberately want an unbiased scan of the genome? In a landmark paper, Risch and Merikangas83 showed that performing an association scan involving one million variants in the genome and a sample of unrelated individuals could be more powerful than performing a linkage analysis with a few hundred markers. It took only 10 years before this theoretical design became reality. What was needed was the discovery (accelerated by the sequencing of the human genome) of hundreds of thousands of single-nucleotide variants, the quantification of the correlation (LD) structure of those markers in the human genome, and the ability to accurately genotype hundreds of thousands of markers in an automated and affordable manner. The LD structure was investigated in the HapMap project,7 and the outcome was a list of tag SNPs that captured most of the common genomic variation in a number of human populations. Concurrently, commercial companies produced dense SNP arrays that could genotype many markers in a single assay. The technological advances together with biobanks of either population cohorts or case-control samples facilitated the ability to conduct GWASs.
Although GWASs are unbiased with respect to prior biological knowledge (or prior beliefs) and with respect to genome location, they are not unbiased in terms of what is detectable. GWASs rely on LD between genotyped SNPs and ungenotyped causal variants. The strength of statistical association between alleles at two loci in the genome strongly depends on their allele frequencies, such that a rare variant (say, one with a frequency <0.01) will be in low LD (as measured by r2) with a nearby common variant, even if they map to the same recombination interval.84 But the SNPs that are on the SNP chips have been selected to be common (most have a minor allele frequency >0.05). Therefore, GWASs are by design powered to detect association with causal variants that are relatively common in the population. Is it realistic to assume common causal variants for disease segregate in the population? This is discussed in Box 2.
Box 2. The CDCV Hypothesis.
Currently, the allele frequency of variants that contribute to cause common disease is a subject of some debate.85, 86 The common disease-common variant (CDCV) hypothesis is sometimes said to be one side of this debate; the other side holds that disease-causing alleles are typically rare. But what is the precise “hypothesis” in the CDCV hypothesis? We tried to find the origin of the CDCV hypothesis. Many researchers cite either Lander87 or Risch and Merikangas.83 We will add Chakravarti88 and Reich and Lander89 as key studies. Lander87 noted from the then-available data that there is a limited diversity in coding regions at genes, in that most variants are very rare, and therefore the effective number of alleles is small. In addition, he provided “tantalizing examples” of common alleles with large effects (for example, such alleles include APOE [MIM 107741], MTHFR [MIM 607093], and ACE [MIM 106180]). Reich and Lander89 presented a theoretical population-genetics model that predicted a relatively simple spectrum of the frequency of disease risk alleles at a particular disease locus. They (re)phrased the CDCV hypothesis as the prediction that the expected allelic identity is high for those disease loci that are responsible for most of the population risk for disease. These studies did not appear to make any prediction about the number of disease loci or, therefore, about the effect size. What the authors stated was that if a disease was common, there was likely to be one disease-causing allele that was much more common than all the other disease-causing alleles at the same locus.87, 89
Risch and Merikangas83 quantified two important points regarding the detection of disease loci: first, that detection by association is more powerful than linkage when the genotype-relative risk is modest or small and the risk-allele frequency is large (say, >10%); and second, that the multiple-testing burden of a genome scan by association does not prevent the detection of genome-wide-significant findings. This paper was essentially about experimental design and statistical power (and hence feasibility), not about the CDCV hypothesis as such. Finally, Chakravarti88 pointed out that if individuals with disease needed to be homozygous for risk variants at multiple loci, then the risk alleles at those loci must be more common than they would be in a model in which homozygosity at any risk locus is sufficient to cause disease. We note that without the assumption of strong epistasis on the scale of liability, there is no need for risk variants to be common. For example, Risch's multilocus multiplicative model,90 which implies an additive model on the log (risk) scale (it is one of the “exchangeable” models91), does not rely on a particular allelic spectrum of risk-allele frequencies.
What all these landmark papers have in common is a remarkable foresight in predicting the GWAS era well before the publication of the full draft of the human genome sequence, the HapMap project, or the availability of commercial genotyping. But what can we conclude about the origin and specifics of the CDCV hypothesis? As implicitly or explicitly stated in these key papers, there is no strong prediction about the exact allele-frequency spectrum of risk variants in the genome, nor a prediction about the effect size at any disease loci and hence about the total number of risk alleles in the genome.
The current debate is about the frequency spectrum of disease-causing alleles. Phrasing the debate as an either/or question is not very helpful because examples of both common and rare alleles are already known, but there is still an open question as to whether most genetic variation contributing to complex traits in the population is caused by rare variants or common variants. A more general question regards the spectrum of allele frequencies of disease-causing alleles and the joint distribution between risk-allele frequency and effect size. In the special case of an evolutionarily neutral model and a constant effective population size, most causal variants that are segregating in the population will be rare, but most heritability will be due to common variants.79, 92 The reason for this apparent paradox is that the number of segregating variants is proportional to 1/[p(1 − p), where p is the allele frequency of a risk-increasing allele (so the smaller p, the more variants of that frequency), whereas the heritability contributed at that frequency is proportional to p(1 − p). The net effect is that the heritability is distributed equally over all frequencies, and cumulatively most heritability is contributed by common variants.
(Nearly) Five Years of Discovery
Although the first results from a GWAS were reported in 20058 and 2006,9 we take the 2007 Wellcome Trust Case Control Consortium (WTCCC) paper in Nature10 as a starting point. The reason for this is that the WTCCC study was the first large, well-designed GWAS for complex diseases to employ a SNP chip that had good coverage of the genome.
There are many ways to summarize the discoveries based on GWASs in the last five years. We have tried to separate the discoveries quantitatively and to focus on the biology. There are now well over 2000 loci that are significantly and robustly associated with one or more complex traits (see GWAS catalog in Web Resources), as shown in Figure 1. The vast majority of the loci identified are new, i.e., before 2007 their association with disease or other complex traits was not known. Essentially, these are 2000 new biological leads. The number of loci identified per complex trait varies substantially, from a handful for psychiatric diseases to a hundred or more for inflammatory bowel disease (IBD1 [MIM 266600], including Crohn disease [CD]11 and ulcerative colitis [UC]12) and stature.13 Importantly, the number of discovered variants is strongly correlated with experimental sample size (Figure 2), which predicts that an ever-increasing discovery sample size will increase the number of discovered variants: very roughly, after a minimum sample-size threshold below which no variants are detected is reached, a doubling in sample size leads to a doubling of the number of associated variants discovered. The proportion of genetic variation explained by significantly associated SNPs is usually low (typically less than 10%) for many complex traits, but for diseases such as CD and multiple sclerosis (MS [MIM 126200]), and for quantitative traits such as height and lipid traits, between 10% and 20% of genetic variance has been accounted for (Table 1). In comparison to the pre-GWAS era, the proportion of genetic variation accounted for by newly discovered variants that are segregating in the population is large.
Figure 1.
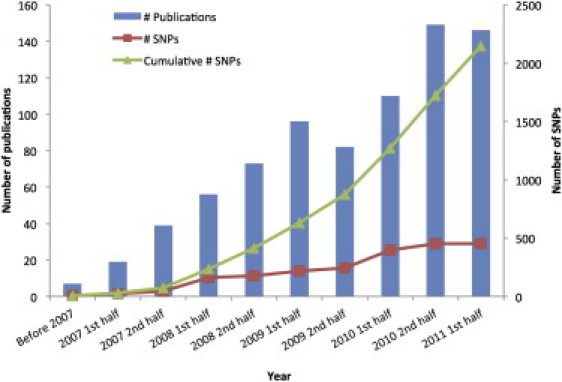
GWAS Discoveries over Time
Data obtained from the Published GWAS Catalog (see Web Resources). Only the top SNPs representing loci with association p values < 5 × 10⁻⁸ are included, and so that multiple counting is avoided, SNPs identified for the same traits with LD r2 > 0.8 estimated from the entire HapMap samples are excluded.
Figure 2.
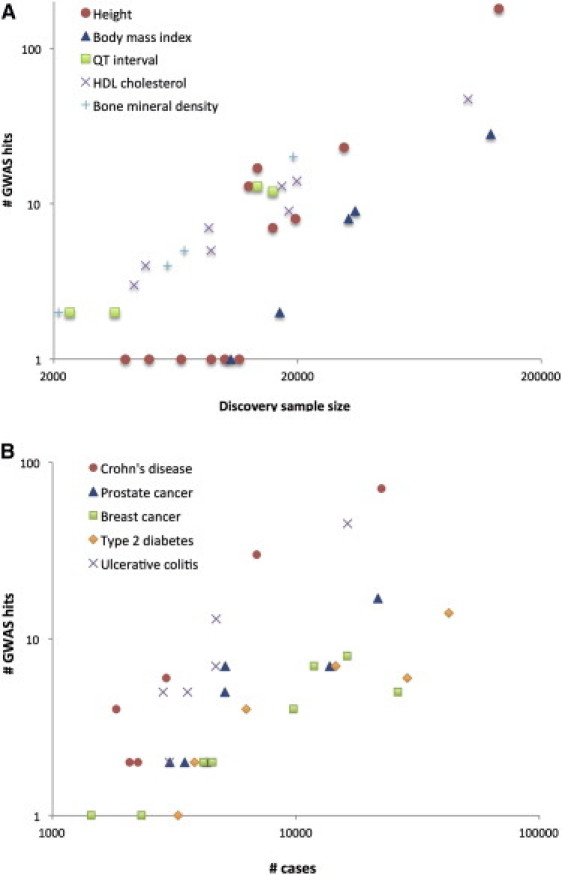
Increase in Number of Loci Identified as a Function of Experimental Sample Size
(A) Selected quantitative traits.
(B) Selected diseases.
The coordinates are on the log scale. The complex traits were selected with the criteria that there were at least three GWAS papers published on each in journals with a 2010–2011 journal impact factor >9 (e.g., Nature, Nature Genetics, the American Journal of Human Genetics, and PLoS Genetics) and that at least one paper contained more than ten genome-wide significant loci. These traits are a representative selection among all complex traits that fulfilled these criteria.
Table 1.
Population Variation Explained by GWAS for a Selected Number of Complex Traits
| Trait or Disease | h2 Pedigree Studies | h2 GWAS Hitsa | h2 All GWAS SNPsb |
|---|---|---|---|
| Type 1 diabetes | 0.998 | 0.699,c | 0.312 |
| Type 2 diabetes | 0.3–0.6100 | 0.05-0.1034 | |
| Obesity (BMI) | 0.4–0.6101, 102 | 0.01-0.0236 | 0.214 |
| Crohn's disease | 0.6–0.8103 | 0.111 | 0.412 |
| Ulcerative colitis | 0.5103 | 0.0512 | |
| Multiple sclerosis | 0.3–0.8104 | 0.145 | |
| Ankylosing spondylitis | >0.90105 | 0.2106 | |
| Rheumatoid arthritis | 0.6107 | ||
| Schizophrenia | 0.7–0.8108 | 0.0179 | 0.3109 |
| Bipolar disorder | 0.6–0.7108 | 0.0279 | 0.412 |
| Breast cancer | 0.3110 | 0.08111 | |
| Von Willebrand factor | 0.66–0.75112, 113 | 0.13114 | 0.2514 |
| Height | 0.8115, 116 | 0.113 | 0.513, 14 |
| Bone mineral density | 0.6-0.8117 | 0.05118 | |
| QT interval | 0.37–0.60119, 120 | 0.07121 | 0.214 |
| HDL cholesterol | 0.5122 | 0.157 | |
| Platelet count | 0.8123 | 0.05–0.158 |
Proportion of phenotypic variance or variance in liability explained by genome-wide-significant and validated SNPs. For a number of diseases, other parameters were reported, and these were converted and approximated to the scale of total variation explained. Blank cells indicate that these parameters have not been reported in the literature.
Proportion of phenotypic variance or variance in liability explained when all GWAS SNPs are considered simultaneously. Blank cell indicate that these parameters have not been reported in the literature.
Includes pre-GWAS loci with large effects.
It is clear that for most complex traits that have been investigated by GWAS, multiple identified loci have genome-wide statistical significance, and thus it is likely that there are (many) other loci that have not been identified because of a lack of statistical significance (false negatives). Recently, researchers have developed and applied methods to quantify the proportion of phenotypic variation that is tagged when one considers all SNPs simultaneously.12, 13, 14 These methods focus on estimation rather than hypothesis testing and do not suffer from false negatives caused by small effect sizes.15 Whole-genome approaches to estimating genetic variation have shown that approximately one-third to one-half of additive genetic variation in the population is being tagged when all GWAS SNPs are considered simultaneously.12, 13, 14 This is a surprisingly large proportion given that evolutionary theory predicts that most variants affecting disease risk ought to be found at a low frequency in the population if they affect fitness,16, 17 and such risk variants would not be in sufficient LD with the common SNPs to be detected in GWASs.
Autoimmune Diseases
We concentrate on seven auto-immune diseases, ankylosing spondylitis (AS [MIM 106300]), rheumatoid arthritis (RA [MIM 180300), systemic lupus erythematosus (SLE [MIM 152700]), and type 1 diabetes (T1D [MIM 222100]), MS, CD, and UC. Table 2 summarizes the number of genes that have been identified for these diseases. Across these diseases, 19 loci (mainly related to human leukocyte antigen) were known prior to 2007, and 277 have been discovered from 2007 onward. The total of 277 includes multiple counts of loci that have been implicated across a number of diseases; such loci include BLK (MIM 191305), TNFAIP3 (MIM 191163) and CD40 (MIM 109535).
Table 2.
Summary of GWAS Findings for Seven Autoimmune Diseasesa
|
Prior to 2007 |
2007 onward |
|||
|---|---|---|---|---|
| Disease | Number of Loci | Loci | Number of Loci | Some or All of the Loci |
| Ankylosing spondylitis | 1 | HLA-B27 | 13 | IL23R, ERAP1, 2p15, 21q22, CARD9 (MIM 607212), IL12B (MIM 161561), PTGER4 (MIM 601586), IL1R2 (MIM 147811), TNFR1, TBKBP1 (MIM 608476), ANTXR2 (MIM 608041), RUNX3 (MIM 600210), KIF21B (MIM 608322) |
| Rheumatoid arthritis | 3 | HLA-DRB1, PADI4, CTLA4 | 30 | AFF3 (MIM 601464), BLK, CCL21 (MIM 602737), CD2/CD58 (MIM 186990)/153420], CD28, CD40, FCGR2A (MIM 146790), HLA-DRB1, IL2/IL21 (MIM 147680/605384), IL2RA, IL2RB (MIM 146710), KIF5A/PIP4K2C, PRDM1 (MIM 603423), PRKCQ (MIM 600448), PTPRC (MIM 151460), REL (MIM 164910), STAT4 (MIM 600558), TAGAP, TNFAIP3, TNFRSF14, TRAF1/C5 (MIM 120900/601711), TRAF6 (MIM 602355), IL6ST (MIM 600694), SPRED2 (MIM 609292), RBPJ (MIM 147183), CCR6 (MIM 601835), IRF5 (MIM 607218), PXK (MIM 611450) |
| Systemic lupus erythematosus | 3 | HLA, PTPN22, IRF5 (MIM 607218) | 31 | BANK1 (MIM 610292), BLK (MIM 191305), C1q, C2 (MIM 613927), C4A/B (MIM 120820/120810), CRP (MIM 123260), ETS1 (MIM 164720), FcGR2A–FcGR3A (MIM 146790/146740), FcGR3B (MIM 610665), HIC2-UBE2L3 (MIM 607712/603721), IKZF1 (MIM 603023), IL10 (MIM 124092), IRAK1 (MIM 300283), ITGAM–ITGAX (MIM 120980)/151510], JAZF1, KIAA1542/PHRF1, LRRC18-WDFY4, LYN (MIM 165120), NMNAT2 (MIM 608701), PRDM1 (MIM 603423), PTTG1 (MIM 604147), PXK (MIM 611450), RASGRP3 (MIM 609531), SLC15A4, STAT1 (MIM 600555), TNFAIP3, TNFSF4 (MIM 603594), TNIP1 (MIM 607714), TREX1 (MIM 606609), UHRF1BP1, XKR6 |
| Type 1 diabetes | 4 | HLA, INS (MIM 176730), PTPN22, CTLA4 | 40 | RGS1, IL18RAP (MIM 604509), IFIH1 (MIM 606951), CCR5 (MIM 601373), IL2 (MIM 147680), IL7R, MHC, BACH2 (MIM 605394), TNFAIP3, TAGAP, IL2RA, PRKCQ (MIM 600448), INS (MIM 176730), ERBB3 (MIM 190151), 12q13.3, SH2B3 (MIM 605093), CTSH (MIM 116820), CLEC16A (MIM 611303), PTPN2 (MIM 176887), CD226 (MIM 605397), UBASH3A (MIM 605736), C1QTNF6, IL10 (MIM 124092), 4p15.2, C6orf173, 7p15.2, COBL (MIM 610317), GLIS3 (MIM 610192), C10orf59, CD69 (MIM 107273), 14q24.1, 14q32.2, IL27 (MIM 608273), 16q23.1, ORMDL3 (MIM 610075), 17q21.2, 19q13.32, 20p13, 22q12.2, Xq28 |
| Multiple sclerosis | 1 | HLA | 52 | BACH2 (MIM 605394), BATF (MIM 612476), CBLB, CD40, CD58, CD6 (MIM 186720), CD86, CLEC16A (MIM 611303), CLECL1, CYP24A1, CYP27B1, DKKL1 (MIM 605418), EOMES (MIM 604615), EVI5 (MIM 602942), GALC (MIM 606890), HHEX (MIM 604420), IL12A, IL12B, IL22RA2, IL2RA, IL7, IL7R, IRF8, KIF21B (MIM 608322), MALT1, MAPK1 (MIM 176948), MERTK (MIM 604705), MMEL1, MPHOSPH9 (MIM 605501), MPV17L2, MYB (MIM 189990), MYC (MIM 190080), OLIG3 (MIM 609323), PLEK (MIM 173570), PTGER4 (MIM 601586), PVT1 (MIM 165140), RGS1, SCO2 (MIM 604272), SP140 (MIM 608602), STAT3, TAGAP, THEMIS (MIM 613607), TMEM39A, TNFRSF1A, TNFSF14 (MIM 604520), TYK2, VCAM1, ZFP36L1 (MIM 601064), ZMIZ1 (MIM 607159), ZNF767 |
| Crohn's disease | 4 | NOD2 (MIM 605956), IBD5 (MIM 606348), DRB1∗0103, IL23R | 67 | SMAD3 (MIM 603109), ERAP2 (MIM 609497), IL10 (MIM 124092), IL2RA, TYK2, FUT2 (MIM 182100), DNMT3A (MIM 602769), DENND1B (MIM 613292), BACH2 (MIM 605394), ATG16L1 (MIM 610767) |
| Ulcerative colitis | 3 | DRB1∗1502, DRB1∗0103, IL23R | 44 | IL1R2 (MIM 147811), IL8RA-IL8RB, IL7R, IL12B, DAP (MIM 600954), PRDM1 (MIM 603423), JAK2 (MIM 147796), IRF5 (MIM 607218), GNA12 (MIM 604394), LSP1 (MIM 153432), ATG16L1 (MIM 610767) |
| Total | 19 | 277 | ||
The names of the loci are signposts and do not indicate that these loci are necessarily biologically relevant. A number of associated variants are distant from protein-coding genes.
Inflammatory bowel disease (IBD, not to be confused here with identity by descent) is thought to arise from dysregulation of intestinal homeostasis.18 GWASs of IBD (CD and UC) have been highly successful in terms of the number of loci identified (99 nonoverlapping loci in total18), and a substantial proportion of familial risk, about 20%, has been accounted for.11, 12, 18 Twenty-eight risk loci are shared between CD and UC, despite the fact that these diseases display distinct clinical features, and it has been suggested that the two diseases share pathways and are part of a mechanistic continuum.18 There are also strong overlaps between genes involved in CD and UC, AS,19 and psoriasis (MIM 177900), again suggesting shared aetiopathogenic mechanisms in these conditions. Pleiotropic genetic effects are becoming increasing widely identified, including in classical autoimmune diseases.20 For example, a coding variant in the gene PTPN22 (MIM 600716) confers strong risk for T1D and RA as well as protection against CD.18
Metabolic Diseases
In terms of metabolic diseases, we focus here specifically on type 2 diabetes (T2D [MIM 125853]); fasting glucose and insulin levels; body-mass index (BMI) and obesity; and fat distribution. A recent review21 already covered these complex traits, but we have updated that review wherever necessary. Table 3 gives an overview of the number of loci identified.
Table 3.
Summary of GWAS Findings for Metabolic Traitsa
|
Prior to 2007 |
2007 onward |
|||
|---|---|---|---|---|
| Disease | Number of Loci | Loci | Number of Loci | Some or All of the Loci |
| Type 2 diabetes | 3 | PPARG, KCNJ11 (MIM 600937), TCF7L2 | 50 | NOTCH2 (MIM 600275), PROX1 (MIM 601546), GCKR, THADA (MIM 611800), BCL11A (MIM 606557), RBMS1 (MIM 602310), IRS1, ADAMTS9, ADCY5 (MIM 600293), IGF2BP2 (MIM 608289), WFS1, ZBED3, CDKAL1, DGKB (MIM 604070), JAZF1, GCK, KLF14, TP53INP1 (MIM 606185), SLC30A8 (MIM 611145), PTPRD (MIM 601598), CDKN2A, CHCHD9, CDC123, HHEX (MIM 604420), DUSP8 (MIM 602038), KCNQ1, CENTD2, MTNR1B, HMGA2 (MIM 600698), TSPAN8 (MIM 600769), HNF1A, ZFAND6 (MIM 610183), PRC1 (MIM 603484), FTO, SRR (MIM 606477), HNF1B (MIM 189907), DUSP9 (MIM 300134), CDCD4A, UBE2E2 (MIM 602163), GRB14 (MIM 601524), ST6GAL1 (MIM 109675), VPS26A (MIM 605506), HMG20A (MIM 605534), AP3S2 (MIM 602416), HNF4A (MIM 600281), SPRY2 (MIM 602466) |
| Body-mass index | 1 | MC4R | 30 | NEGR1 (MIM 613173), TNNI3K (MIM 613932), PTBP2 (MIM 608449), TMEM18 (MIM 613220), POMC, FANCL (MIM 608111), LRP1B (MIM 608766), CADM2 (MIM 609938), ETV5 (MIM 601600), GNPDA2 (MIM 613222), SLC39A8 (MIM 608732), HMGCR (MIM 142910), PCSK1, ZNF608, NCR3 (MIM 611550), HMGA1 (MIM 600701), LRRN6C, TUB (MIM 601197), BDNF, MTCH2 (MIM 613221), FAIM3 (MIM 606015), MTIF3, PRKD1 (MIM 605435), MAP2K5 (MIM 602520), FTO, SH2B1, GPRC5B (MIM 605948), KCTD15, GIPR, TMEM160 |
| Glucose or insulin | 1 | GCK | 15 | GCKR, G6PC2, IGF1, ADCY5 (MIM 600293), MADD (MIM 603584), ADRA2A, CRY2 (MIM 603732), FADS1 (MIM 606148), GLIS3 (MIM 610192), SLC2A2, PROX1 (MIM 601546), C2CD4B (MIM 610344), DGKB (MIM 604070), GIPR, VPS13C (MIM 608879) |
| Fat distribution | 0 | 20 | TBX15 (MIM 604127), LYPLAL1, IRS1, SPRY2 (MIM 602466), GRB14 (MIM 601524), STAB1 (MIM 608560), ADAMTS9, CPEB4 (MIM 610607), VEGFA (MIM 192240), TFAP2B (MIM 601601), LY86 (MIM 605241), RSPO3 (MIM 610574), NFE2L3 (MIM 604135), MSRA (MIM 601250), ITPR2 (MIM 600144), HOXC13 (MIM 142976), NRXN3 (MIM 600567), ZNRF3 (MIM 612062), PIGC (MIM 601730) | |
| Total | 5 | 107 | ||
The names of the loci are signposts and do not indicate that these loci are necessarily biologically relevant. A number of associated variants are distant from protein-coding genes.
More than 20 major GWASs for T2D have been published to date21, 22, 23, 24, and there has been a cumulative tally of around 50 genome-wide-significant hits,21, 23, 24 only three of which were known before the GWAS era. Most of these studies have involved individuals of European descent; the latest published effort is from the DIAGRAM (Diabetes Genetics Replication and Meta-analysis) Consortium and includes more than 47,000 GWAS individuals and 94,000 samples for replication. More recently, equivalent studies have emerged from samples of East Asians,23, 25, 26, 27 South Asians,22 and Hispanics,28, 29 and large studies involving African Americans and other major ethnic groups are underway. Notwithstanding differences in allele frequency and LD patterns, most of the signals found in one ethnic group show some evidence of association in others, indicating that the common-variant signals identified by GWASs are likely to be the result of widely distributed causal alleles that are of relatively high frequency. This is an important observation because it indicates that most of the GWAS-identified associations for T2D reflect high LD with a causal variant that has a small effect size rather than low LD with a causal variant that has a large effect size. The largest common-variant signal identified for T2D remains TCF7L2 (MIM 602228) (detected just prior to the GWAS era30), which has a per-allele odss ratio (OR) of around 1.35. The remaining signals detected by GWAS have allelic ORs in the range between 1.05 and 1.25. Collectively, the most-strongly associated variants at these loci are estimated to explain around 10% of familial aggregation of T2D in European populations.
The MAGIC (Meta-Analysis of Glucose- and Insulin-Related Traits Consortium) investigators have been carrying out equivalent analyses focused on the identification of variants influencing variation in glucose and insulin levels in healthy nondiabetic individuals.31, 32, 33 Prior to the GWAS era, the only compelling association signal for fasting glucose levels was known at GCK (MIM 138079) (glucokinase),34 but GWAS in European samples (46,000 GWAS and 76,000 replication samples) have expanded that number to 1632. These variants explain around 10% of the inherited variation in fasting glucose levels. Only two signals (near GCKR [MIM 600842] and IGF1 [MIM 147440]) were shown to influence fasting insulin levels in the same analysis. Equivalent analyses for 2h glucose33 (15,000 GWAS samples and up to 30,000 replication samples) identified further signals, including variants near the GIP (MIM 137240) receptor (GIPR [MIM 137241]).
Before the GWAS era, the only robust association between DNA sequence variation and either BMI or weight involved low-frequency variants in MC4R (MIM 155541).35 Now, there are more than 30. In the most recent study from the GIANT consortium,36 these analyses extended to almost 250,000 samples, half of them in the stage 1 GWAS, the remainder for replication. The largest signal remains that at FTO (MIM 610966),37 where the average between-homozygotes difference in weight is around 2.5 kg. The effects at other loci are smaller, and in combination, these variants explain no more than 1%–2% of overall variation in adult BMI (although this percentage rises to almost 20% if the analysis is extended to all GWA variants, not just those that reach genome-wide significance14). As well as these studies of BMI and obesity in population samples, there have been several studies focused on extreme obesity phenotypes.38, 39 The genome-wide-significant loci thrown up by these efforts only partially overlap with those emerging from population-based studies, raising the possibility that some of the most extreme cases of obesity are driven by highly penetrant, low-frequency variants. Variation at copy-number variants (CNVs) has some impact on BMI. This is true of common CNVs (the NEGR1 association seems likely to be driven by a common CNV40) and also rarer CNVs for which evidence is starting to accumulate (e.g., 16p CNV and effect on morbid obesity and developmental delay41).
The adverse metabolic effects of obesity depend not only on the overall level of adiposity but also on the distribution of fat around the body; visceral (abdominal) fat has particularly adverse consequences for overall health. GWASs of fat-distribution phenotypes (including waist circumference, waist:hip ratio, and body-fat percentage studied in close to 200,000 individuals) have revealed almost 20 loci with genome-wide significance40, 42, 43, 44 and relatively little overlap with those loci influencing overall adiposity. As with BMI, the proportion of variance explained by these loci is small (around 1% after adjustment for BMI, age, and sex).
New Biology Arising from GWAS Discoveries
Autoimmune Diseases
Thus far nearly all genes associated with MS have been involved in autoimmune pathways rather than in neurologic degenerative diseases.45 Indeed, of the two MS-associated genes involved in neurodegeneration, one (KIF21B) is also associated with AS and CD, suggesting that it is actually an autoimmunity gene. The genes involved in MS include genes coding for components of the cytokine pathway (CXCR5 [MIM 601613], IL2RA [MIM 147730], IL7R [MIM 146661], IL7 [MIM 146660], IL12RB1 [MIM 601604], IL22RA2 [MIM 606648], IL12A [MIM 161560], IL12B [MIM 161561], IRF8 [MIM 601565], TNFRSF1A [MIM 191190], TNFRSF14 [MIM 602746], and TNFSF14 [MIM 604520]), costimulatory molecules (CD37 [MIM 151523], CD40, CD58 [MIM 153420], CD80 [MIM 112203], CD86 [MIM 601020], and CLECL1 [MIM 607467]), and signal-transduction molecules of immunological relevance (CBLB [MIM 604491], GPR65 [MIM 604620], MALT1 [MIM 604860], RGS1 [MIM 600323], STAT3 [MIM 102582], TAGAP [MIM 609667], and TYK2 [MIM 176941]). Interestingly, these genes mainly implicate T-helper cells in MS pathogenesis.
Genetic findings have had a major impact on AS research and therapeutics. The association of the genes IL23R (MIM 607562)46 and IL12B19 have pointed to the involvement of the IL-23R pathway, and hence IL-17-producing proinflammatory cell populations, in the aetiopathogenesis of AS. The involvement of this pathway in AS was not considered until the genetic discoveries were reported. The recent demonstration that ERAP1 (MIM 606832) polymorphisms are associated with HLA-B27-positive but not HLA-B27-negative AS has shed important light on research into the mechanism by which HLA-B27 induces AS; this mechanism has remained an enigma since the discovery of the association of HLA-B27 with AS in the early 1970s. ERAP1 is involved in peptide processing before HLA class I molecule presentation; the restriction of the association of ERAP1 variants to HLA-B27-positive disease indicates that HLA-B27 operates to cause AS by a mechanism that involves peptide presentation. Protective variants of ERAP1 have been shown to have lower peptide-processing capacity and thus to reduce the amount of peptide available to HLA-B27.47 Thus HLA-B27 is more likely to cause AS when it is processing more peptides.
The finding that PADI4 (MIM 605347) is associated with RA focused research interest on the role of anti-citrullinated peptide antibodies (ACPAs) and disease.48 PADI4 is involved in the citrullination of peptides against which ACPAs develop. The association of PADI4 variants with RA therefore indicated that ACPAs are directly involved in RA pathogenesis, not an indirect manifestation of immune dysregulation in the disease. Subsequently, it was discovered that the association of HLA-DRB1 (MIM 142857) with RA was restricted to ACPA-positive disease and that there was a strong gene-environment interaction, such that cigarette smoking increases the risk of ACPA-positive but not ACPA-negative RA.49 Because ACPA-positive disease is more severe than ACPA-negative disease and has a greater propensity toward joint-damaging erosion, this provided further evidence supporting public-health measures against cigarette smoking.
The genetic loci identified for IBD through GWASs have highlighted a number of pathways, including antibacterial autophagy and signaling pathways (e.g., IL-10 signaling, T-cell-negative regulators, and pathways involving B cells and innate sensors).18 Some of these pathways were previously not suspected to be important for these diseases. The role of a number of pathways, for example the IL-23R pathway, the autophagy pathway, and innate immunity, have all come from hypothesis-generating genetics research, not from immunology or hypothesis-driven research.
Similar advances could be described for many other autoimmune diseases but are beyond the scope of this review.
Metabolic Traits
Most loci affecting T2D and fasting glucose levels map to regulatory sequences, and in many cases, the “causal” transcript, i.e., the transcript responsible for mediating the effect of the associated variants, is not yet known. At other loci, a combination of coding variants, strong biological candidates, and/or cis expression QTL data has defined the transcript through which the effect is mediated (HNF1A [MIM 142410], GCK, IRS1 [MIM 147545], WFS1 [MIM 606201], PPARG [MIM 601487], CAMK1D [MIM 607957], JAZF1 [MIM 606246], KLF14 [MIM 609393] and others) as a first step to inferring biology.50 Some of these stories are now starting to be fleshed out into biological mechanisms (e.g., KLF1451).
There is incomplete overlap with the loci influencing physiological variation in glucose and insulin. Some loci (e.g., MTNR1B [MIM 600804]) have a relatively large effect on both, whereas others (e.g., G6PC2 [MIM 608058]) influence fasting glucose levels but have a minimal effect on T2D risk. Still others (e.g., CDKN2A and CDKN2 B [MIM 600160 and 600431]) impact T2D and have surprisingly modest effects on fasting glucose levels in healthy, nondiabetic individuals32, 33, 50. Most of these loci appear to have their primary effect on the function of beta cells rather than on insulin resistance, highlighting the importance of the former with respect to normal and abnormal glucose homeostasis.50 Of the subset of loci (including PPARG, KLF14, and ADAMTS9 [MIM 605421]) shown to influence T2D risk through a primary effect on insulin resistance, only FTO seems to act primarily through an effect on obesity.50 Several of the T2D loci overlap genes that are known to harbor rare variants responsible for penetrant, monogenic forms of diabetes (such genes include KCNQ1 [MIM 607542], PPARG, HNF1A, GCK, and WFS1), indicating that multiple causal variants at the same locus segregate in the population at difference frequencies. There is overlap between signals influencing T2D risk and those influencing body weight (CDKAL1 [MIM 611259] and ADCY5 [MIM 600293]) indicating that some of the observed epidemiological associations between these traits are attributable to shared susceptibility variants.52
Whereas many of the fasting-glucose and fasting-insulin signals map near strong biological candidates for relevant traits (such candidate genes include IRS1, IGF1, ADRA2A [MIM 104210], SLC2A2 [MIM 138160], GCK and GCKR) and fit within established models of our understanding of islet biology, this is far from the case with the loci identified for T2D. Efforts to demonstrate that the genes mapping close to T2D risk loci are enriched for particular pathways or processes have met with only limited success; the most robust finding yet has been in relation to cell-cycle regulation (and was consistent with a model in which the regulation of islet mass is a key component of risk50). Either T2D is especially heterogeneous or else key aspects of its pathophysiology are as yet poorly codified in existing databases.
As for T2D and fasting glucose, most of the signals for obesity and fat distribution map to regulatory signals, the causal transcript is known at only a minority of the loci. Signals influencing BMI appear to be enriched for genes implicated in neuronal processes, whereas those influencing fat distribution seem to be more closely related to adipose development.36, 43 Overlap with signals and genes implicated in more severe forms of disease (morbid obesity, lipodystrophy) is seen at some loci (PCSK1 [MIM 162150], POMC [MIM 176830], BDNF [MIM 113505], MC4R, and SH2B1 [MIM 608937]) but is far from complete (some loci implicated in extreme obesity case-control studies show no association with BMI at the population level36). The strongest signal for overall adiposityis the one mapping to FTO37. FTO is thought to be a DNA methylase,53 but its function is poorly understood. Murine models demonstrate that modulation of Fto expression is associated with changes in body weight,54, 55, 56 but no direct evidence linking coding variants in FTO in humans to body-weight variation has been demonstrated. For the time being, FTO remains the strongest candidate, but the role of other genes (e.g., RPGRIP1L [MIM 610937]) in the region cannot be discounted. This example demonstrates the difficulties that remain in relating GWAS signals to downstream biology. Fat distribution is a strongly gender-dimorphic phenotype, and many of the signals associated with fat distribution seem to have a selective effect on this phenotype in women.43
Quantitative Traits
In addition to having been performed on the quantitative traits discussed previously (e.g., BMI and fasting-glucose and -insulin levels), GWASs have been done on a number of quantitative risk factors for disease and for traits that are models for the genetic architecture of complex traits. For bone mineral density (BMD), a risk factor for osteoporotic fracture, a total of 34 loci, together explaining ∼5% of narrow sense heritability, have been identified (Estrada et al., abstract presented at the American Society for Bone and Mineral Research 2010 Annual Meeting, published in J. Bone. Med. Res. 25 [Suppl S1], p. 1243). Among these genes, there is a major over-representation of genes in the Wnt-signaling pathway, which was first implicated in osteoporosis (MIM 166710) from studies in families with high or low BMD phenotypes. Many other examples exist in osteoporosis and other human diseases in which GWASs have demonstrated that more-prevalent but less-severe genetic variants in genes initially identified from studies of severe familial diseases have proven to be important in the risk of disease in the general population. For human height, a combined discovery and validation cohort of ∼180,000 samples identified 180 robustly associated loci, many in meaningful biological pathways and with evidence for multiple segregating variants at the same loci.13 Together these loci explain approximately 12%–14% of additive genetic variation (∼10% of phenotypic variation). A meta-analysis of more than 100,000 individuals of European ancestry detected a total of 95 loci significantly associated with plasma concentrations of cholesterol and triglycerides, known risk factors for coronary artery disease,57 and it provided evidence that the GWAS loci were of biological and clinical relevance. A meta-analysis from the HaemGen consortium on platelet count and platelet volume, which are endophenotypes for myocardial infarction (MIM 608446), discovered 68 loci.58 When the genes of a number of these loci were silenced in Drosophila, 11 showed a clear platelet phenotype. These genes are previously unknown regulators of blood cell formation. The identification of so many loci has uncovered new gene functions in megakaryopoiesis and platelet formation. That is, new biology has resulted directly from the identification of SNPs that are associated with variation in platelet phenotypes.
Across these quantitative traits, a number of loci discovered through GWASs were known to be a mutational target for those traits because Mendelian forms with extreme phenotypes existed. Taken together, the inference from quantitative traits in terms of the (large) number of loci involved, the allelic frequency spectrum of associated variants, and the nature of the candidate genes suggest that models arising from quantitative traits appropriately reflect the genetic architecture of disease and reinforce the emerging evidence that it is the cumulative effect of many loci that underlies susceptibility to disease.
From GWAS to Translation: Clinical Relevance
Autoimmune Diseases
Many of the MS-associated genes discovered by GWASs represent excellent potential therapeutic targets. Of particular note is the identification of two genes involved in vitamin D metabolism (CYP27B1 [MIM 609506] and CYP24A1 [MIM 126065]). This identification might help to explain the latitudinal variation in MS incidence—i.e., higher MS prevalence at more extreme latitudes is most likely due to higher rates of vitamin D deficiency. Two other identified genes are already targets of MS therapies, highlighting the relevance of the findings to the disease pathogenesis (natalizumab targets VCAM1 [MIM 192225], and daclizumab targets IL2RA). The findings for AS have stimulated the trial of therapies against identified pathways. Anti-IL-17 treatment has been shown in a phase 2 trial to have equivalent efficacy as the current gold-standard treatment, TNF-inhibition, in the treatment of AS. The relevance of the RA-related genetic findings to therapeutic development is highlighted by the fact that some existing therapies already target genes or gene pathways highlighted by the genetic associations with RA; such therapies include those involving TNF inhibitors (e.g., infliximab) and co-stimulation inhibitors (e.g., abatacept). Abatacept is a fusion protein of CTLA-4 and immunoglobulin. It acts by preventing costimulation of T-helper cells by the binding of the T cell's CD28 protein to the B7 protein on the antigen-presenting cell. CTLA4 (MIM 123890) and CD28 (MIM 186760) polymorphisms are associated with RA. The RA-associated genes include many involved in the NfKB signaling pathway and place this pathway at the center of RA pathogenesis. As in MS, mouse research prior to the genetic discoveries had implicated the IL-23-dependent Th17-lymphocyte pathway in RA pathogenesis. To date there has been very little genetic support for this with regard to human diseases, in contrast to the situation in seronegative diseases such as AS, psoriasis and IBD, where strong genetic associations exist and treatments targeting the pathway are in clinical use.
Metabolic Diseases
The main relevance of GWASs lies in the insights into disease biology (see above) and the potential for clinical translation through novel approaches to the diagnosis, prevention, treatment, and monitoring of disease. This will take some time, in particular given that most GWAS discoveries were made in the last few years. The predictive power of disease risk ascertained from genetic data remains poor because for most diseases only a small proportion of additive genetic variation has been accounted for. Although it is possible for T2D to identify individuals who are at the extremes of the genotype risk score distribution and who differ appreciably in T2D risk (they have twice or half the average risk for the upper and lower 1%–2%, respectively), many of these would already be identifiable on the basis of classical risk factors. In fact, when using receiver operating characteristic (ROC) analyses, BMI and age do a far better job of discrimination than the genetic variants so far discovered.59 This may change as low frequency and rare causal alleles are found. Although individual prediction is not yet practical with the variants at hand, it should be possible to identify groups of individuals who are at a substantially greater-than-average risk for diabetes, and this might be of value, for example, with respect to clinical-trial enrichment.
One obvious route to early translation involves the identification of diagnostic biomarkers on the basis of the processes that have been uncovered. These may have predictive impact well beyond the genetic variants that led to their discovery. This was recently demonstrated by a GWAS of C-reactive protein (CRP) levels; that study found that common variants near the HNF1A gene were associated with variation in CRP.60 The authors asked whether rare HNF1A mutations that are causal for the Mendelian MODY (MIM 606391) subtype of diabetes are also associated with differences in CRP levels and whether it would be possible to use CRP levels as a diagnostic marker to help identify individuals who have early-onset diabetes and who are likely to have HNF1A-MODY (and to direct those individuals to sequence-based diagnostics). They were able to show marked differences in CRP levels between HNF1A -MODY and other types of diabetes and demonstrated that diagnoses based on CRP levels has a discriminative accuracy of more than 80% for this diagnostic classification.61, 62 Otherwise, GWAS findings have as yet had no impact on therapeutic optimization. Recent studies have identified variants that influence therapeutic response to metformin63 and might herald better understanding of how these drugs work.
New Science Facilitated by GWASs
Although the GWAS approach was designed for the detection of associations between DNA markers and disease, as a by-product such studies have generated new scientific discoveries. A detailed description and discussion is outside the scope of this review, and we highlight only a few of these advances: the discovery of genes affecting genetic recombination and their correlation with natural selection64, 65, 66 and new insight in human population structure and evolution.67, 68, 69, 70, 71, 72, 73
Interpretation of GWAS Results
GWASs conducted in the last five years were designed and powered to detect associations through LD between genotyped (or imputed) common SNP markers and unknown causal variants. What do the results imply in terms of variance explained in the population, common versus rare variants underlying complex traits, and the nature of complex-trait variation and evolution? It is too early to be able to quantify the joint distribution of risk-allele frequencies and their effect sizes because there are very few causal variants identified by GWAS and because systematic study of rare variants (through exome or whole-genome sequencing) is in an early stage. To understand the allelic spectrum of risk variants and thereby inform optimal design of experiments aiming to detect causal variants, one must differentiate between two explanations for observed associations between genotyped common SNPs and disease: the association can be caused by one or more causal variants that have large effect sizes and are in low LD with the genotyped SNPs, or it can be caused by causal variants that have small effects and are in high LD with the genotyped SNPs. Low LD occurs when the allele frequencies of the unknown causal variants and those at the genotyped SNPs are very different from each other, for example when the allele frequency of causal variants is much lower than that of the SNPs. For a single robustly associated SNP in a homogeneous population, we cannot distinguish between the hypotheses that the association signal is caused by a rare variant of large effect or a common variant with small effect. However, variants at multiple loci and GWASs in other ethnic populations help to narrow the boundaries of the genetic architecture of diseases. At this point in time, we can conclude that
-
(1)
Many loci contribute to complex-trait variation (e.g., Figure 2).
-
(2)
At a number of identified risk loci, there are multiple alleles associated with disease at a wide range of frequencies.
-
(3)
There is evidence for pleiotropy, i.e., that the same variants are associated with multiple traits.66, 74, 75
-
(4)
A number of variants associated with disease or complex traits in one ethnic population are also associated the same disease or traits in other populations (see above for T2D examples).
-
(5)
The hypothesis76 that causal variant(s) that lead to the association between common SNPs and disease are mostly rare (say, have an allele frequency of 1% or lower) is not consistent with theoretical and empirical results.77, 78 In particular, there is no widespread evidence for the existence of “synthetic associations” (see Box 3). Numerically, we expect that most causal variants that segregate in the population are rare, consistent with evolutionary theory, but the proportion of genetic variation that these variants cumulatively explain depends on their correlation with fitness.79
-
(6)
A surprisingly large proportion of additive genetic variation is tagged when all SNPs are considered simultaneously.12, 13, 14
Box 3. Synthetic Associations.
Dickson and colleagues suggested that the observed association between a common SNP and a complex trait might result when one or more rare variants at the locus is in LD with that SNP.76, 93 Because common SNP alleles and rare causal variants cannot be highly correlated because of the properties of LD,84 the hypothesis of “synthetic” associations implies that the effect sizes of the causal variants are much larger than the effect size observed at the common SNP and suggests that (re)sequencing studies might detect such variants. The hypothesis is not about whether GWASs work as an experimental design but what the likely interpretation of GWAS hits is in terms of the allele spectrum of causal risk alleles. Are empirical data consistent with this hypothesis? Several lines of evidence suggest that associations observed with common SNP associations are rarely due to synthetic associations with rare variants. First, because the LD correlation between common and rare variants is so low (typically 0.01–0.02), synthetic associations imply that variation explained by the causal variants at the locus is 50–100 times larger than the variance explained at the genotyped SNP.78 So, if the SNP explains 0.1% of phenotypic variation in the population, the causal variant would explain 5%–10%. But as shown in this review, for many complex traits and diseases tens to hundred of common variants are identified, and so their combined effects would explain too much variation if synthetic associations were the norm. Second, empirical data from (re)sequencing studies and trans-ethnic mapping suggest that both common and rare variants contribute to disease risk.77 At most loci detected by GWASs, there is no evidence (despite extensive genotyping and/or re-sequencing) that the common-variant signal is driven by low-frequency or rarer variants. Where rare risk alleles are uncovered at the same loci, they seem much more likely to be independent signals.94, 95, 96
Together these observations point to a highly polygenic model of disease susceptibility with causal variants across the entire range of the allele-frequency spectrum. By “polygenic,” we mean that segregating variants at many genomic loci (tens, hundreds, or even thousands) contribute to genetic variation for susceptibility in the population. The observations imply that, for most common complex diseases, nearly everyone in the population carries some risk alleles and that affected individuals are likely to have a different portfolio of risk alleles.79 They also imply that any single risk allele is neither necessary nor sufficient to cause disease. For the etiology of disease, these observations provide empirical evidence to support a threshold or burden model involving multiple variants and environmental factors, and they appear to be inconsistent with a single cause (e.g., a single mutation). A rare-variant only model of disease, characterized by locus heterogeneity and rare mutations of large effects and proposed by, for example, McClellan and King,1 is not consistent with empirical observations.77, 79, 97
The Cost of GWASs
If we assume that the GWAS results from Figure 1 represent a total of 500,000 SNP chips and that on average a chip costs $500, then this is a total investment of $250 million. If there are a total of ∼2,000 loci detected across all traits, then this implies an investment of $125,000 per discovered locus. Is that a good investment? We think so: The total amount of money spent on candidate-gene studies and linkage analyses in the 1990s and 2000s probably exceeds $250M, and they in total have had little to show for it. Also, it is worthwhile to put these amounts in context. $250M is of the order of the cost of a one-two stealth fighter jets and much less than the cost of a single navy submarine. It is a fraction of the ∼$9 billion cost of the Large Hadron Collider. It would also pay for about 100 R01 grants. Would those 100 non-funded R01 grants have made breakthrough discoveries in biology and medicine? We simply can't answer this question, but we can conclude that a tremendous number of genuinely new discoveries have been made in a period of only five years.
Concluding Comments
In this review we have attempted to summarize the tremendous quality and quantity of discoveries that have been made by GWASs in the last five years. Because of space limitations, we have been able to discuss only a subset of diseases and have not mentioned those made in common cancers, pediatric diseases, and ophthalmological diseases, to name but a few. We now return to the perceived failure of GWASs as summarized in the introductory section:
-
(1)
Is the GWAS approach founded on a flawed assumption that genetics plays an important role in the risk for common diseases? Pedigree studies, including those involving twins, suggest that a substantial proportion of variation in susceptibility for common disease is due to genetic factors. The proportion of total variation explained by genome-wide-significant variants has reached 10%–20% for a number of diseases, and clearly there are additional variants with such small effect sizes that they have not been detected with stringent significance. As reviewed here, many of the detected loci are in biologically meaningful pathways for the diseases investigated. Whole-genome analyses involving GWAS data have estimated that 20%–50% of phenotypic variation is captured when all SNPs are considered simultaneously for a number of complex diseases and traits. These estimates are based on population-wide studies and provide a lower limit of the total proportion of phenotypic variation due to genetic factors. Inference from GWASs is independent of inference drawn from close relatives (pedigree/family studies), and therefore these studies have provided independent evidence for the role of genetics in common diseases.
-
(2)
Have GWASs been disappointing in not explaining more genetic variation in the population? This criticism implies that the aim of GWASs is to explain all genetic variation. This is a misrepresentation of the objective of GWASs. As was the aim of linkage studies in pedigrees for complex diseases prior to the GWAS era, the aim of GWAS is to detect loci that are associated with complex traits. The detection of such loci has led to the discovery of new biological knowledge about disease—knowledge that was absent only five years ago. But even ignoring the aim of GWASs, for a number of complex traits the proportion of genetic variation uncovered by GWASs is actually substantial. For example, for T2D, MS, and CD, approximately 10%, 20%, and 20%, respectively, of genetic variation in the population has been accounted for. Apart from diseases with a known major locus (which is usually the major histocompatibility locus), the baseline of variation explained five years ago was essentially zero.
-
(3)
Have GWASs delivered meaningful biologically relevant knowledge or results of clinical or any other utility? As we have highlighted in this review, the answer to this question is a definite “yes.” For example, the discovery of the importance of the autophagy pathway in Crohn disease, the IL-23R pathway in rheumatoid arthritis, and factor H in age-related macular degeneration (MIM 610149)9 have given important biological insight with direct clinical relevance. Hunter and Kraft put it this way back in 2007: “There have been few, if any, similar bursts of discovery in the history of medical research.”80
-
(4)
Are GWAS results spurious? The combination of large sample sizes and stringent significance testing has led to a large number of robust and replicable associations between complex traits and genetic variants, many of which are in meaningful biological pathways. A number of variants or different variants at the same loci have been shown to be associated with the same trait in different ethnic populations, and some loci are even replicated across species.81 The combination of multiple variants with small effect sizes has been shown to predict disease status or phenotype in independent samples from the same population. Clearly, these results are not consistent with flawed inferences from GWASs.
In conclusion, in a period of less than five years, the GWAS experimental design in human populations has led to new discoveries about genes and pathways involved in common diseases and other complex traits, has provided a wealth of new biological insights, has led to discoveries with direct clinical utility, and has facilitated basic research in human genetics and genomics. For the future, technological advances enabling the sequencing of entire genomes in large samples at affordable prices is likely to generate additional genes, pathways, and biological insights, as well as to identify causal mutations.
Acknowledgments
We acknowledge funding from the Australian National Health and Medical Research Council (NHMRC grants 389892, 496667, 613672, 613601, and 1011506) and the Australian Research Council (ARC grant DP1093502). P.M.V. and M.A.B. are funded by NHMRC Senior Principal Research Fellowships. We thank two referees for many helpful comments.
Web Resources
The URLs for data presented herein are as follows:
Online Mendelian Inheritance in Man (OMIM), http://www.omim.org
GWAS Catalog, http://www.genome.gov/26525384
References
- 1.McClellan J., King M.C. Genetic heterogeneity in human disease. Cell. 2010;141:210–217. doi: 10.1016/j.cell.2010.03.032. [DOI] [PubMed] [Google Scholar]
- 2.Crow T.J. ‘The missing genes: what happened to the heritability of psychiatric disorders?’. Mol. Psychiatry. 2011;16:362–364. doi: 10.1038/mp.2010.92. [DOI] [PubMed] [Google Scholar]
- 3.Manolio T.A., Collins F.S., Cox N.J., Goldstein D.B., Hindorff L.A., Hunter D.J., McCarthy M.I., Ramos E.M., Cardon L.R., Chakravarti A., et al. Finding the missing heritability of complex diseases. Nature. 2009;461:747–753. doi: 10.1038/nature08494. [DOI] [PMC free article] [PubMed] [Google Scholar]
- 4.Botstein D., Risch N. Discovering genotypes underlying human phenotypes: Past successes for mendelian disease, future approaches for complex disease. Nat. Genet. 2003;33(Suppl):228–237. doi: 10.1038/ng1090. [DOI] [PubMed] [Google Scholar]
- 5.Hartl D.L., Clark A.G. Sinauer Associates; Sunderland: 1997. Principles of population genetics. [Google Scholar]
- 6.Hill W.G., Robertson A. The effects of inbreeding at loci with heterozygote advantage. Genetics. 1968;60:615–628. doi: 10.1093/genetics/60.3.615. [DOI] [PMC free article] [PubMed] [Google Scholar]
- 7.Altshuler D., Brooks L.D., Chakravarti A., Collins F.S., Daly M.J., Donnelly P., International HapMap Consortium A haplotype map of the human genome. Nature. 2005;437:1299–1320. doi: 10.1038/nature04226. [DOI] [PMC free article] [PubMed] [Google Scholar]
- 8.Dewan A., Liu M., Hartman S., Zhang S.S., Liu D.T., Zhao C., Tam P.O., Chan W.M., Lam D.S., Snyder M., et al. HTRA1 promoter polymorphism in wet age-related macular degeneration. Science. 2006;314:989–992. doi: 10.1126/science.1133807. [DOI] [PubMed] [Google Scholar]
- 9.Klein R.J., Zeiss C., Chew E.Y., Tsai J.Y., Sackler R.S., Haynes C., Henning A.K., SanGiovanni J.P., Mane S.M., Mayne S.T., et al. Complement factor H polymorphism in age-related macular degeneration. Science. 2005;308:385–389. doi: 10.1126/science.1109557. [DOI] [PMC free article] [PubMed] [Google Scholar]
- 10.Wellcome Trust Case Control Consortium Genome-wide association study of 14,000 cases of seven common diseases and 3,000 shared controls. Nature. 2007;447:661–678. doi: 10.1038/nature05911. [DOI] [PMC free article] [PubMed] [Google Scholar]
- 11.Franke A., McGovern D.P., Barrett J.C., Wang K., Radford-Smith G.L., Ahmad T., Lees C.W., Balschun T., Lee J., Roberts R., et al. Genome-wide meta-analysis increases to 71 the number of confirmed Crohn's disease susceptibility loci. Nat. Genet. 2010;42:1118–1125. doi: 10.1038/ng.717. [DOI] [PMC free article] [PubMed] [Google Scholar]
- 12.Anderson C.A., Boucher G., Lees C.W., Franke A., D'Amato M., Taylor K.D., Lee J.C., Goyette P., Imielinski M., Latiano A., et al. Meta-analysis identifies 29 additional ulcerative colitis risk loci, increasing the number of confirmed associations to 47. Nat. Genet. 2011;43:246–252. doi: 10.1038/ng.764. [DOI] [PMC free article] [PubMed] [Google Scholar]
- 13.Lango Allen H., Estrada K., Lettre G., Berndt S.I., Weedon M.N., Rivadeneira F., Willer C.J., Jackson A.U., Vedantam S., Raychaudhuri S., et al. Hundreds of variants clustered in genomic loci and biological pathways affect human height. Nature. 2010;467:832–838. doi: 10.1038/nature09410. [DOI] [PMC free article] [PubMed] [Google Scholar]
- 14.Yang J., Manolio T.A., Pasquale L.R., Boerwinkle E., Caporaso N., Cunningham J.M., de Andrade M., Feenstra B., Feingold E., Hayes M.G., et al. Genome partitioning of genetic variation for complex traits using common SNPs. Nat. Genet. 2011;43:519–525. doi: 10.1038/ng.823. [DOI] [PMC free article] [PubMed] [Google Scholar]
- 15.Yang J., Benyamin B., McEvoy B.P., Gordon S., Henders A.K., Nyholt D.R., Madden P.A., Heath A.C., Martin N.G., Montgomery G.W., et al. Common SNPs explain a large proportion of the heritability for human height. Nat. Genet. 2010;42:565–569. doi: 10.1038/ng.608. [DOI] [PMC free article] [PubMed] [Google Scholar]
- 16.Eyre-Walker A. Evolution in health and medicine Sackler colloquium: Genetic architecture of complex traits and its implications for fitness and genome-wide association studies. Proc. Natl. Acad. Sci. USA. 2010;107(Suppl 1):1752–1756. doi: 10.1073/pnas.0906182107. [DOI] [PMC free article] [PubMed] [Google Scholar]
- 17.Pritchard J.K. Are rare variants responsible for susceptibility to complex diseases? Am. J. Hum. Genet. 2001;69:124–137. doi: 10.1086/321272. [DOI] [PMC free article] [PubMed] [Google Scholar]
- 18.Khor B., Gardet A., Xavier R.J. Genetics and pathogenesis of inflammatory bowel disease. Nature. 2011;474:307–317. doi: 10.1038/nature10209. [DOI] [PMC free article] [PubMed] [Google Scholar]
- 19.Danoy P., Pryce K., Hadler J., Bradbury L.A., Farrar C., Pointon J., Ward M., Weisman M., Reveille J.D., Wordsworth B.P., et al. Australo-Anglo-American Spondyloarthritis Consortium. Spondyloarthritis Research Consortium of Canada Association of variants at 1q32 and STAT3 with ankylosing spondylitis suggests genetic overlap with Crohn's disease. PLoS Genet. 2010;6:e1001195. doi: 10.1371/journal.pgen.1001195. [DOI] [PMC free article] [PubMed] [Google Scholar]
- 20.Cotsapas C., Voight B.F., Rossin E., Lage K., Neale B.M., Wallace C., Abecasis G.R., Barrett J.C., Behrens T., Cho J., et al. FOCiS Network of Consortia Pervasive sharing of genetic effects in autoimmune disease. PLoS Genet. 2011;7:e1002254. doi: 10.1371/journal.pgen.1002254. [DOI] [PMC free article] [PubMed] [Google Scholar]
- 21.McCarthy M.I. Genomics, type 2 diabetes, and obesity. N. Engl. J. Med. 2010;363:2339–2350. doi: 10.1056/NEJMra0906948. [DOI] [PubMed] [Google Scholar]
- 22.Kooner J.S., Saleheen D., Sim X., Sehmi J., Zhang W., Frossard P., Been L.F., Chia K.S., Dimas A.S., Hassanali N., et al. DIAGRAM. MuTHER Genome-wide association study in individuals of South Asian ancestry identifies six new type 2 diabetes susceptibility loci. Nat. Genet. 2011;43:984–989. doi: 10.1038/ng.921. [DOI] [PMC free article] [PubMed] [Google Scholar]
- 23.Yamauchi T., Hara K., Maeda S., Yasuda K., Takahashi A., Horikoshi M., Nakamura M., Fujita H., Grarup N., Cauchi S., et al. A genome-wide association study in the Japanese population identifies susceptibility loci for type 2 diabetes at UBE2E2 and C2CD4A-C2CD4B. Nat. Genet. 2010;42:864–868. doi: 10.1038/ng.660. [DOI] [PubMed] [Google Scholar]
- 24.Shu X.O., Long J., Cai Q., Qi L., Xiang Y.B., Cho Y.S., Tai E.S., Li X., Lin X., Chow W.H., et al. Identification of new genetic risk variants for type 2 diabetes. PLoS Genet. 2010;6:e1001127. doi: 10.1371/journal.pgen.1001127. [DOI] [PMC free article] [PubMed] [Google Scholar]
- 25.Yasuda K., Miyake K., Horikawa Y., Hara K., Osawa H., Furuta H., Hirota Y., Mori H., Jonsson A., Sato Y., et al. Variants in KCNQ1 are associated with susceptibility to type 2 diabetes mellitus. Nat. Genet. 2008;40:1092–1097. doi: 10.1038/ng.207. [DOI] [PubMed] [Google Scholar]
- 26.Unoki H., Takahashi A., Kawaguchi T., Hara K., Horikoshi M., Andersen G., Ng D.P., Holmkvist J., Borch-Johnsen K., Jørgensen T., et al. SNPs in KCNQ1 are associated with susceptibility to type 2 diabetes in East Asian and European populations. Nat. Genet. 2008;40:1098–1102. doi: 10.1038/ng.208. [DOI] [PubMed] [Google Scholar]
- 27.Tsai F.J., Yang C.F., Chen C.C., Chuang L.M., Lu C.H., Chang C.T., Wang T.Y., Chen R.H., Shiu C.F., Liu Y.M., et al. A genome-wide association study identifies susceptibility variants for type 2 diabetes in Han Chinese. PLoS Genet. 2010;6:e1000847. doi: 10.1371/journal.pgen.1000847. [DOI] [PMC free article] [PubMed] [Google Scholar]
- 28.Below J.E., Gamazon E.R., Morrison J.V., Konkashbaev A., Pluzhnikov A., McKeigue P.M., Parra E.J., Elbein S.C., Hallman D.M., Nicolae D.L., et al. Genome-wide association and meta-analysis in populations from Starr County, Texas, and Mexico City identify type 2 diabetes susceptibility loci and enrichment for expression quantitative trait loci in top signals. Diabetologia. 2011;54:2047–2055. doi: 10.1007/s00125-011-2188-3. [DOI] [PMC free article] [PubMed] [Google Scholar]
- 29.Parra E.J., Below J.E., Krithika S., Valladares A., Barta J.L., Cox N.J., Hanis C.L., Wacher N., Garcia-Mena J., Hu P., et al. Diabetes Genetics Replication and Meta-analysis (DIAGRAM) Consortium Genome-wide association study of type 2 diabetes in a sample from Mexico City and a meta-analysis of a Mexican-American sample from Starr County, Texas. Diabetologia. 2011;54:2038–2046. doi: 10.1007/s00125-011-2172-y. [DOI] [PMC free article] [PubMed] [Google Scholar]
- 30.Grant S.F., Thorleifsson G., Reynisdottir I., Benediktsson R., Manolescu A., Sainz J., Helgason A., Stefansson H., Emilsson V., Helgadottir A., et al. Variant of transcription factor 7-like 2 (TCF7L2) gene confers risk of type 2 diabetes. Nat. Genet. 2006;38:320–323. doi: 10.1038/ng1732. [DOI] [PubMed] [Google Scholar]
- 31.Prokopenko I., Langenberg C., Florez J.C., Saxena R., Soranzo N., Thorleifsson G., Loos R.J., Manning A.K., Jackson A.U., Aulchenko Y., et al. Variants in MTNR1B influence fasting glucose levels. Nat. Genet. 2009;41:77–81. doi: 10.1038/ng.290. [DOI] [PMC free article] [PubMed] [Google Scholar]
- 32.Dupuis J., Langenberg C., Prokopenko I., Saxena R., Soranzo N., Jackson A.U., Wheeler E., Glazer N.L., Bouatia-Naji N., Gloyn A.L., et al. DIAGRAM Consortium. GIANT Consortium. Global BPgen Consortium. Anders Hamsten on behalf of Procardis Consortium. MAGIC investigators New genetic loci implicated in fasting glucose homeostasis and their impact on type 2 diabetes risk. Nat. Genet. 2010;42:105–116. doi: 10.1038/ng.520. [DOI] [PMC free article] [PubMed] [Google Scholar]
- 33.Saxena R., Hivert M.F., Langenberg C., Tanaka T., Pankow J.S., Vollenweider P., Lyssenko V., Bouatia-Naji N., Dupuis J., Jackson A.U., et al. GIANT consortium. MAGIC investigators Genetic variation in GIPR influences the glucose and insulin responses to an oral glucose challenge. Nat. Genet. 2010;42:142–148. doi: 10.1038/ng.521. [DOI] [PMC free article] [PubMed] [Google Scholar]
- 34.Weedon M.N., Clark V.J., Qian Y., Ben-Shlomo Y., Timpson N., Ebrahim S., Lawlor D.A., Pembrey M.E., Ring S., Wilkin T.J., et al. A common haplotype of the glucokinase gene alters fasting glucose and birth weight: Association in six studies and population-genetics analyses. Am. J. Hum. Genet. 2006;79:991–1001. doi: 10.1086/509517. [DOI] [PMC free article] [PubMed] [Google Scholar]
- 35.Larsen L.H., Echwald S.M., Sørensen T.I., Andersen T., Wulff B.S., Pedersen O. Prevalence of mutations and functional analyses of melanocortin 4 receptor variants identified among 750 men with juvenile-onset obesity. J. Clin. Endocrinol. Metab. 2005;90:219–224. doi: 10.1210/jc.2004-0497. [DOI] [PubMed] [Google Scholar]
- 36.Speliotes E.K., Willer C.J., Berndt S.I., Monda K.L., Thorleifsson G., Jackson A.U., Allen H.L., Lindgren C.M., Luan J., Mägi R., et al. MAGIC. Procardis Consortium Association analyses of 249,796 individuals reveal 18 new loci associated with body mass index. Nat. Genet. 2010;42:937–948. doi: 10.1038/ng.686. [DOI] [PMC free article] [PubMed] [Google Scholar]
- 37.Frayling T.M., Timpson N.J., Weedon M.N., Zeggini E., Freathy R.M., Lindgren C.M., Perry J.R., Elliott K.S., Lango H., Rayner N.W., et al. A common variant in the FTO gene is associated with body mass index and predisposes to childhood and adult obesity. Science. 2007;316:889–894. doi: 10.1126/science.1141634. [DOI] [PMC free article] [PubMed] [Google Scholar]
- 38.Meyre D., Delplanque J., Chèvre J.C., Lecoeur C., Lobbens S., Gallina S., Durand E., Vatin V., Degraeve F., Proença C., et al. Genome-wide association study for early-onset and morbid adult obesity identifies three new risk loci in European populations. Nat. Genet. 2009;41:157–159. doi: 10.1038/ng.301. [DOI] [PubMed] [Google Scholar]
- 39.Scherag A., Dina C., Hinney A., Vatin V., Scherag S., Vogel C.I., Müller T.D., Grallert H., Wichmann H.E., Balkau B., et al. Two new Loci for body-weight regulation identified in a joint analysis of genome-wide association studies for early-onset extreme obesity in French and german study groups. PLoS Genet. 2010;6:e1000916. doi: 10.1371/journal.pgen.1000916. [DOI] [PMC free article] [PubMed] [Google Scholar]
- 40.Willer C.J., Speliotes E.K., Loos R.J., Li S., Lindgren C.M., Heid I.M., Berndt S.I., Elliott A.L., Jackson A.U., Lamina C., et al. Wellcome Trust Case Control Consortium. Genetic Investigation of ANthropometric Traits Consortium Six new loci associated with body mass index highlight a neuronal influence on body weight regulation. Nat. Genet. 2009;41:25–34. doi: 10.1038/ng.287. [DOI] [PMC free article] [PubMed] [Google Scholar]
- 41.Walters R.G., Jacquemont S., Valsesia A., de Smith A.J., Martinet D., Andersson J., Falchi M., Chen F., Andrieux J., Lobbens S., et al. A new highly penetrant form of obesity due to deletions on chromosome 16p11.2. Nature. 2010;463:671–675. doi: 10.1038/nature08727. [DOI] [PMC free article] [PubMed] [Google Scholar]
- 42.Heard-Costa N.L., Zillikens M.C., Monda K.L., Johansson A., Harris T.B., Fu M., Haritunians T., Feitosa M.F., Aspelund T., Eiriksdottir G., et al. NRXN3 is a novel locus for waist circumference: A genome-wide association study from the CHARGE Consortium. PLoS Genet. 2009;5:e1000539. doi: 10.1371/journal.pgen.1000539. [DOI] [PMC free article] [PubMed] [Google Scholar]
- 43.Heid I.M., Jackson A.U., Randall J.C., Winkler T.W., Qi L., Steinthorsdottir V., Thorleifsson G., Zillikens M.C., Speliotes E.K., Mägi R., et al. MAGIC Meta-analysis identifies 13 new loci associated with waist-hip ratio and reveals sexual dimorphism in the genetic basis of fat distribution. Nat. Genet. 2010;42:949–960. doi: 10.1038/ng.685. [DOI] [PMC free article] [PubMed] [Google Scholar]
- 44.Kilpelainen T.O., Zillikens M.C., Stancakova A., Finucane F.M., Ried J.S., Langenberg C., Zhang W., Beckmann J.S., Luan J., Vandenput L., et al. Genetic variation near IRS1 associates with reduced adiposity and an impaired metabolic profile. Nat. Genet. 2011;43:753–760. doi: 10.1038/ng.866. [DOI] [PMC free article] [PubMed] [Google Scholar]
- 45.Sawcer S., Hellenthal G., Pirinen M., Spencer C.C., Patsopoulos N.A., Moutsianas L., Dilthey A., Su Z., Freeman C., Hunt S.E., et al. International Multiple Sclerosis Genetics Consortium. Wellcome Trust Case Control Consortium 2 Genetic risk and a primary role for cell-mediated immune mechanisms in multiple sclerosis. Nature. 2011;476:214–219. doi: 10.1038/nature10251. [DOI] [PMC free article] [PubMed] [Google Scholar]
- 46.Burton P.R., Clayton D.G., Cardon L.R., Craddock N., Deloukas P., Duncanson A., Kwiatkowski D.P., McCarthy M.I., Ouwehand W.H., Samani N.J., et al. Wellcome Trust Case Control Consortium. Australo-Anglo-American Spondylitis Consortium (TASC) Biologics in RA Genetics and Genomics Study Syndicate (BRAGGS) Steering Committee. Breast Cancer Susceptibility Collaboration (UK) Association scan of 14,500 nonsynonymous SNPs in four diseases identifies autoimmunity variants. Nat. Genet. 2007;39:1329–1337. doi: 10.1038/ng.2007.17. [DOI] [PMC free article] [PubMed] [Google Scholar]
- 47.Evans D.M., Spencer C.C., Pointon J.J., Su Z., Harvey D., Kochan G., Oppermann U., Dilthey A., Pirinen M., Stone M.A., et al. Spondyloarthritis Research Consortium of Canada (SPARCC) Australo-Anglo-American Spondyloarthritis Consortium (TASC) Wellcome Trust Case Control Consortium 2 (WTCCC2) Interaction between ERAP1 and HLA-B27 in ankylosing spondylitis implicates peptide handling in the mechanism for HLA-B27 in disease susceptibility. Nat. Genet. 2011;43:761–767. doi: 10.1038/ng.873. [DOI] [PMC free article] [PubMed] [Google Scholar]
- 48.Suzuki A., Yamada R., Chang X., Tokuhiro S., Sawada T., Suzuki M., Nagasaki M., Nakayama-Hamada M., Kawaida R., Ono M., et al. Functional haplotypes of PADI4, encoding citrullinating enzyme peptidylarginine deiminase 4, are associated with rheumatoid arthritis. Nat. Genet. 2003;34:395–402. doi: 10.1038/ng1206. [DOI] [PubMed] [Google Scholar]
- 49.Padyukov L., Silva C., Stolt P., Alfredsson L., Klareskog L. A gene-environment interaction between smoking and shared epitope genes in HLA-DR provides a high risk of seropositive rheumatoid arthritis. Arthritis Rheum. 2004;50:3085–3092. doi: 10.1002/art.20553. [DOI] [PubMed] [Google Scholar]
- 50.Voight B.F., Scott L.J., Steinthorsdottir V., Morris A.P., Dina C., Welch R.P., Zeggini E., Huth C., Aulchenko Y.S., Thorleifsson G., et al. MAGIC investigators. GIANT Consortium Twelve type 2 diabetes susceptibility loci identified through large-scale association analysis. Nat. Genet. 2010;42:579–589. doi: 10.1038/ng.609. [DOI] [PMC free article] [PubMed] [Google Scholar]
- 51.Small K.S., Hedman A.K., Grundberg E., Nica A.C., Thorleifsson G., Kong A., Thorsteindottir U., Shin S.Y., Richards H.B., Soranzo N., et al. GIANT Consortium. MAGIC Investigators. DIAGRAM Consortium. MuTHER Consortium Identification of an imprinted master trans regulator at the KLF14 locus related to multiple metabolic phenotypes. Nat. Genet. 2011;43:561–564. doi: 10.1038/ng.833. [DOI] [PMC free article] [PubMed] [Google Scholar]
- 52.Freathy R.M., Mook-Kanamori D.O., Sovio U., Prokopenko I., Timpson N.J., Berry D.J., Warrington N.M., Widen E., Hottenga J.J., Kaakinen M., et al. Genetic Investigation of ANthropometric Traits (GIANT) Consortium. Meta-Analyses of Glucose and Insulin-related traits Consortium. Wellcome Trust Case Control Consortium. Early Growth Genetics (EGG) Consortium Variants in ADCY5 and near CCNL1 are associated with fetal growth and birth weight. Nat. Genet. 2010;42:430–435. doi: 10.1038/ng.567. [DOI] [PMC free article] [PubMed] [Google Scholar]
- 53.Gerken T., Girard C.A., Tung Y.C., Webby C.J., Saudek V., Hewitson K.S., Yeo G.S., McDonough M.A., Cunliffe S., McNeill L.A., et al. The obesity-associated FTO gene encodes a 2-oxoglutarate-dependent nucleic acid demethylase. Science. 2007;318:1469–1472. doi: 10.1126/science.1151710. [DOI] [PMC free article] [PubMed] [Google Scholar]
- 54.Church C., Lee S., Bagg E.A., McTaggart J.S., Deacon R., Gerken T., Lee A., Moir L., Mecinović J., Quwailid M.M., et al. A mouse model for the metabolic effects of the human fat mass and obesity associated FTO gene. PLoS Genet. 2009;5:e1000599. doi: 10.1371/journal.pgen.1000599. [DOI] [PMC free article] [PubMed] [Google Scholar]
- 55.Church C., Moir L., McMurray F., Girard C., Banks G.T., Teboul L., Wells S., Brüning J.C., Nolan P.M., Ashcroft F.M., Cox R.D. Overexpression of Fto leads to increased food intake and results in obesity. Nat. Genet. 2010;42:1086–1092. doi: 10.1038/ng.713. [DOI] [PMC free article] [PubMed] [Google Scholar]
- 56.Freathy R.M., Timpson N.J., Lawlor D.A., Pouta A., Ben-Shlomo Y., Ruokonen A., Ebrahim S., Shields B., Zeggini E., Weedon M.N., et al. Common variation in the FTO gene alters diabetes-related metabolic traits to the extent expected given its effect on BMI. Diabetes. 2008;57:1419–1426. doi: 10.2337/db07-1466. [DOI] [PMC free article] [PubMed] [Google Scholar]
- 57.Teslovich T.M., Musunuru K., Smith A.V., Edmondson A.C., Stylianou I.M., Koseki M., Pirruccello J.P., Ripatti S., Chasman D.I., Willer C.J., et al. Biological, clinical and population relevance of 95 loci for blood lipids. Nature. 2010;466:707–713. doi: 10.1038/nature09270. [DOI] [PMC free article] [PubMed] [Google Scholar]
- 58.Gieger C., Radhakrishnan A., Cvejic A., Tang W., Porcu E., Pistis G., Serbanovic-Canic J., Elling U., Goodall A.H., Labrune Y., et al. New gene functions in megakaryopoiesis and platelet formation. Nature. 2011;480:201–208. doi: 10.1038/nature10659. [DOI] [PMC free article] [PubMed] [Google Scholar]
- 59.Mihaescu R., Meigs J., Sijbrands E., Janssens A.C. Genetic risk profiling for prediction of type 2 diabetes. PLoS Curr. 2011;3:RRN1208. doi: 10.1371/currents.RRN1208. [DOI] [PMC free article] [PubMed] [Google Scholar]
- 60.Elliott P., Chambers J.C., Zhang W., Clarke R., Hopewell J.C., Peden J.F., Erdmann J., Braund P., Engert J.C., Bennett D., et al. Genetic Loci associated with C-reactive protein levels and risk of coronary heart disease. JAMA. 2009;302:37–48. doi: 10.1001/jama.2009.954. [DOI] [PMC free article] [PubMed] [Google Scholar]
- 61.Owen K.R., Thanabalasingham G., James T.J., Karpe F., Farmer A.J., McCarthy M.I., Gloyn A.L. Assessment of high-sensitivity C-reactive protein levels as diagnostic discriminator of maturity-onset diabetes of the young due to HNF1A mutations. Diabetes Care. 2010;33:1919–1924. doi: 10.2337/dc10-0288. [DOI] [PMC free article] [PubMed] [Google Scholar]
- 62.Thanabalasingham G., Shah N., Vaxillaire M., Hansen T., Tuomi T., Gasperikova D., Szopa M., Tjora E., James T.J., Kokko P., et al. A large multi-centre European study validates high-sensitivity C-reactive protein (hsCRP) as a clinical biomarker for the diagnosis of diabetes subtypes. Diabetologia. 2011;54:2801–2810. doi: 10.1007/s00125-011-2261-y. [DOI] [PubMed] [Google Scholar]
- 63.Zhou K., Bellenguez C., Spencer C.C., Bennett A.J., Coleman R.L., Tavendale R., Hawley S.A., Donnelly L.A., Schofield C., Groves C.J., et al. GoDARTS and UKPDS Diabetes Pharmacogenetics Study Group. Wellcome Trust Case Control Consortium 2. MAGIC investigators Common variants near ATM are associated with glycemic response to metformin in type 2 diabetes. Nat. Genet. 2011;43:117–120. doi: 10.1038/ng.735. [DOI] [PMC free article] [PubMed] [Google Scholar]
- 64.Stefansson H., Helgason A., Thorleifsson G., Steinthorsdottir V., Masson G., Barnard J., Baker A., Jonasdottir A., Ingason A., Gudnadottir V.G., et al. A common inversion under selection in Europeans. Nat. Genet. 2005;37:129–137. doi: 10.1038/ng1508. [DOI] [PubMed] [Google Scholar]
- 65.Kong A., Barnard J., Gudbjartsson D.F., Thorleifsson G., Jonsdottir G., Sigurdardottir S., Richardsson B., Jonsdottir J., Thorgeirsson T., Frigge M.L., et al. Recombination rate and reproductive success in humans. Nat. Genet. 2004;36:1203–1206. doi: 10.1038/ng1445. [DOI] [PubMed] [Google Scholar]
- 66.Hinch A.G., Tandon A., Patterson N., Song Y., Rohland N., Palmer C.D., Chen G.K., Wang K., Buxbaum S.G., Akylbekova E.L., et al. The landscape of recombination in African Americans. Nature. 2011;476:170–175. doi: 10.1038/nature10336. [DOI] [PMC free article] [PubMed] [Google Scholar]
- 67.Seldin M.F., Tian C., Shigeta R., Scherbarth H.R., Silva G., Belmont J.W., Kittles R., Gamron S., Allevi A., Palatnik S.A., et al. Argentine population genetic structure: Large variance in Amerindian contribution. Am. J. Phys. Anthropol. 2007;132:455–462. doi: 10.1002/ajpa.20534. [DOI] [PMC free article] [PubMed] [Google Scholar]
- 68.Seldin M.F., Shigeta R., Villoslada P., Selmi C., Tuomilehto J., Silva G., Belmont J.W., Klareskog L., Gregersen P.K. European population substructure: Clustering of northern and southern populations. PLoS Genet. 2006;2:e143. doi: 10.1371/journal.pgen.0020143. [DOI] [PMC free article] [PubMed] [Google Scholar]
- 69.Tian C., Hinds D.A., Shigeta R., Kittles R., Ballinger D.G., Seldin M.F. A genomewide single-nucleotide-polymorphism panel with high ancestry information for African American admixture mapping. Am. J. Hum. Genet. 2006;79:640–649. doi: 10.1086/507954. [DOI] [PMC free article] [PubMed] [Google Scholar]
- 70.McEvoy B.P., Montgomery G.W., McRae A.F., Ripatti S., Perola M., Spector T.D., Cherkas L., Ahmadi K.R., Boomsma D., Willemsen G., et al. Geographical structure and differential natural selection among North European populations. Genome Res. 2009;19:804–814. doi: 10.1101/gr.083394.108. [DOI] [PMC free article] [PubMed] [Google Scholar]
- 71.Heath S.C., Gut I.G., Brennan P., McKay J.D., Bencko V., Fabianova E., Foretova L., Georges M., Janout V., Kabesch M., et al. Investigation of the fine structure of European populations with applications to disease association studies. Eur. J. Hum. Genet. 2008;16:1413–1429. doi: 10.1038/ejhg.2008.210. [DOI] [PubMed] [Google Scholar]
- 72.Novembre J., Johnson T., Bryc K., Kutalik Z., Boyko A.R., Auton A., Indap A., King K.S., Bergmann S., Nelson M.R., et al. Genes mirror geography within Europe. Nature. 2008;456:98–101. doi: 10.1038/nature07331. [DOI] [PMC free article] [PubMed] [Google Scholar]
- 73.Price A.L., Butler J., Patterson N., Capelli C., Pascali V.L., Scarnicci F., Ruiz-Linares A., Groop L., Saetta A.A., Korkolopoulou P., et al. Discerning the ancestry of European Americans in genetic association studies. PLoS Genet. 2008;4:e236. doi: 10.1371/journal.pgen.0030236. [DOI] [PMC free article] [PubMed] [Google Scholar]
- 74.Manolio T.A. Genomewide association studies and assessment of the risk of disease. N. Engl. J. Med. 2010;363:166–176. doi: 10.1056/NEJMra0905980. [DOI] [PubMed] [Google Scholar]
- 75.Sivakumaran S., Agakov F., Theodoratou E., Prendergast J.G., Zgaga L., Manolio T., Rudan I., McKeigue P., Wilson J.F., Campbell H. Abundant pleiotropy in human complex diseases and traits. Am. J. Hum. Genet. 2011;89:607–618. doi: 10.1016/j.ajhg.2011.10.004. [DOI] [PMC free article] [PubMed] [Google Scholar]
- 76.Dickson S.P., Wang K., Krantz I., Hakonarson H., Goldstein D.B. Rare variants create synthetic genome-wide associations. PLoS Biol. 2010;8:e1000294. doi: 10.1371/journal.pbio.1000294. [DOI] [PMC free article] [PubMed] [Google Scholar]
- 77.Anderson C.A., Soranzo N., Zeggini E., Barrett J.C. Synthetic associations are unlikely to account for many common disease genome-wide association signals. PLoS Biol. 2011;9:e1000580. doi: 10.1371/journal.pbio.1000580. [DOI] [PMC free article] [PubMed] [Google Scholar]
- 78.Wray N.R., Purcell S.M., Visscher P.M. Synthetic associations created by rare variants do not explain most GWAS results. PLoS Biol. 2011;9:e1000579. doi: 10.1371/journal.pbio.1000579. [DOI] [PMC free article] [PubMed] [Google Scholar]
- 79.Visscher P.M., Goddard M.E., Derks E.M., Wray N.R. Evidence-based psychiatric genetics, AKA the false dichotomy between common and rare variant hypotheses. Molecular Psychiatry. 2011 doi: 10.1038/mp.2011.65. in press. Published online 14 June 2011. 2010.1038/mp.2011.2065. [DOI] [PubMed] [Google Scholar]
- 80.Hunter D.J., Kraft P. Drinking from the fire hose—Statistical issues in genomewide association studies. N. Engl. J. Med. 2007;357:436–439. doi: 10.1056/NEJMp078120. [DOI] [PubMed] [Google Scholar]
- 81.Pryce J.E., Hayes B.J., Bolormaa S., Goddard M.E. Polymorphic regions affecting human height also control stature in cattle. Genetics. 2011;187:981–984. doi: 10.1534/genetics.110.123943. [DOI] [PMC free article] [PubMed] [Google Scholar]
- 82.Bodmer W.F. Human genetics: The molecular challenge. Cold Spring Harb. Symp. Quant. Biol. 1986;51:1–13. doi: 10.1101/sqb.1986.051.01.003. [DOI] [PubMed] [Google Scholar]
- 83.Risch N., Merikangas K. The future of genetic studies of complex human diseases. Science. 1996;273:1516–1517. doi: 10.1126/science.273.5281.1516. [DOI] [PubMed] [Google Scholar]
- 84.Wray N.R. Allele frequencies and the r2 measure of linkage disequilibrium: impact on design and interpretation of association studies. Twin Res. Hum. Genet. 2005;8:87–94. doi: 10.1375/1832427053738827. [DOI] [PubMed] [Google Scholar]
- 85.McClellan J.M., Susser E., King M.C. Schizophrenia: A common disease caused by multiple rare alleles. Br. J. Psychiatry. 2007;190:194–199. doi: 10.1192/bjp.bp.106.025585. [DOI] [PubMed] [Google Scholar]
- 86.Craddock N., O'Donovan M.C., Owen M.J. Phenotypic and genetic complexity of psychosis. Invited commentary on … Schizophrenia: a common disease caused by multiple rare alleles. Br. J. Psychiatry. 2007;190:200–203. doi: 10.1192/bjp.bp.106.033761. [DOI] [PubMed] [Google Scholar]
- 87.Lander E.S. The new genomics: Global views of biology. Science. 1996;274:536–539. doi: 10.1126/science.274.5287.536. [DOI] [PubMed] [Google Scholar]
- 88.Chakravarti A. Population genetics—Making sense out of sequence. Nat. Genet. 1999;21(1, Suppl):56–60. doi: 10.1038/4482. [DOI] [PubMed] [Google Scholar]
- 89.Reich D.E., Lander E.S. On the allelic spectrum of human disease. Trends Genet. 2001;17:502–510. doi: 10.1016/s0168-9525(01)02410-6. [DOI] [PubMed] [Google Scholar]
- 90.Risch N. Linkage strategies for genetically complex traits. I. Multilocus models. Am. J. Hum. Genet. 1990;46:222–228. [PMC free article] [PubMed] [Google Scholar]
- 91.Slatkin M. Exchangeable models of complex inherited diseases. Genetics. 2008;179:2253–2261. doi: 10.1534/genetics.107.077719. [DOI] [PMC free article] [PubMed] [Google Scholar]
- 92.Hill W.G., Goddard M.E., Visscher P.M. Data and theory point to mainly additive genetic variance for complex traits. PLoS Genet. 2008;4:e1000008. doi: 10.1371/journal.pgen.1000008. [DOI] [PMC free article] [PubMed] [Google Scholar]
- 93.Wang K., Dickson S.P., Stolle C.A., Krantz I.D., Goldstein D.B., Hakonarson H. Interpretation of association signals and identification of causal variants from genome-wide association studies. Am. J. Hum. Genet. 2010;86:730–742. doi: 10.1016/j.ajhg.2010.04.003. [DOI] [PMC free article] [PubMed] [Google Scholar]
- 94.Nejentsev S., Walker N., Riches D., Egholm M., Todd J.A. Rare variants of IFIH1, a gene implicated in antiviral responses, protect against type 1 diabetes. Science. 2009;324:387–389. doi: 10.1126/science.1167728. [DOI] [PMC free article] [PubMed] [Google Scholar]
- 95.Momozawa Y., Mni M., Nakamura K., Coppieters W., Almer S., Amininejad L., Cleynen I., Colombel J.F., de Rijk P., Dewit O., et al. Resequencing of positional candidates identifies low frequency IL23R coding variants protecting against inflammatory bowel disease. Nat. Genet. 2011;43:43–47. doi: 10.1038/ng.733. [DOI] [PubMed] [Google Scholar]
- 96.Rivas M.A., Beaudoin M., Gardet A., Stevens C., Sharma Y., Zhang C.K., Boucher G., Ripke S., Ellinghaus D., Burtt N., et al. National Institute of Diabetes and Digestive Kidney Diseases Inflammatory Bowel Disease Genetics Consortium (NIDDK IBDGC) United Kingdom Inflammatory Bowel Disease Genetics Consortium. International Inflammatory Bowel Disease Genetics Consortium Deep resequencing of GWAS loci identifies independent rare variants associated with inflammatory bowel disease. Nat. Genet. 2011;43:1066–1073. doi: 10.1038/ng.952. [DOI] [PMC free article] [PubMed] [Google Scholar]
- 97.Wang K., Bucan M., Grant S.F., Schellenberg G., Hakonarson H. Strategies for genetic studies of complex diseases. Cell. 2010;142:351–353. doi: 10.1016/j.cell.2010.07.025. author reply 353–355. [DOI] [PubMed] [Google Scholar]
- 98.Hyttinen V., Kaprio J., Kinnunen L., Koskenvuo M., Tuomilehto J. Genetic liability of type 1 diabetes and the onset age among 22,650 young Finnish twin pairs: A nationwide follow-up study. Diabetes. 2003;52:1052–1055. doi: 10.2337/diabetes.52.4.1052. [DOI] [PubMed] [Google Scholar]
- 99.Polychronakos C., Li Q. Understanding type 1 diabetes through genetics: Advances and prospects. Nat. Rev. Genet. 2011;12:781–792. doi: 10.1038/nrg3069. [DOI] [PubMed] [Google Scholar]
- 100.Poulsen P., Kyvik K.O., Vaag A., Beck-Nielsen H. Heritability of type II (non-insulin-dependent) diabetes mellitus and abnormal glucose tolerance—A population-based twin study. Diabetologia. 1999;42:139–145. doi: 10.1007/s001250051131. [DOI] [PubMed] [Google Scholar]
- 101.Magnusson P.K., Rasmussen F. Familial resemblance of body mass index and familial risk of high and low body mass index. A study of young men in Sweden. Int. J. Obes. Relat. Metab. Disord. 2002;26:1225–1231. doi: 10.1038/sj.ijo.0802041. [DOI] [PubMed] [Google Scholar]
- 102.Schousboe K., Willemsen G., Kyvik K.O., Mortensen J., Boomsma D.I., Cornes B.K., Davis C.J., Fagnani C., Hjelmborg J., Kaprio J., et al. Sex differences in heritability of BMI: A comparative study of results from twin studies in eight countries. Twin Res. 2003;6:409–421. doi: 10.1375/136905203770326411. [DOI] [PubMed] [Google Scholar]
- 103.Tysk C., Lindberg E., Järnerot G., Flodérus-Myrhed B. Ulcerative colitis and Crohn's disease in an unselected population of monozygotic and dizygotic twins. A study of heritability and the influence of smoking. Gut. 1988;29:990–996. doi: 10.1136/gut.29.7.990. [DOI] [PMC free article] [PubMed] [Google Scholar]
- 104.Hawkes C.H., Macgregor A.J. Twin studies and the heritability of MS: A conclusion. Mult. Scler. 2009;15:661–667. doi: 10.1177/1352458509104592. [DOI] [PubMed] [Google Scholar]
- 105.Brown M.A., Kennedy L.G., MacGregor A.J., Darke C., Duncan E., Shatford J.L., Taylor A., Calin A., Wordsworth P. Susceptibility to ankylosing spondylitis in twins: The role of genes, HLA, and the environment. Arthritis Rheum. 1997;40:1823–1828. doi: 10.1002/art.1780401015. [DOI] [PubMed] [Google Scholar]
- 106.Brown M.A. Progress in the genetics of ankylosing spondylitis. Brief. Funct. Genomics. 2011;10:249–257. doi: 10.1093/bfgp/elr023. [DOI] [PubMed] [Google Scholar]
- 107.MacGregor A.J., Snieder H., Rigby A.S., Koskenvuo M., Kaprio J., Aho K., Silman A.J. Characterizing the quantitative genetic contribution to rheumatoid arthritis using data from twins. Arthritis Rheum. 2000;43:30–37. doi: 10.1002/1529-0131(200001)43:1<30::AID-ANR5>3.0.CO;2-B. [DOI] [PubMed] [Google Scholar]
- 108.Lichtenstein P., Yip B.H., Björk C., Pawitan Y., Cannon T.D., Sullivan P.F., Hultman C.M. Common genetic determinants of schizophrenia and bipolar disorder in Swedish families: A population-based study. Lancet. 2009;373:234–239. doi: 10.1016/S0140-6736(09)60072-6. [DOI] [PMC free article] [PubMed] [Google Scholar]
- 109.Purcell S.M., Wray N.R., Stone J.L., Visscher P.M., O'Donovan M.C., Sullivan P.F., Sklar P., International Schizophrenia Consortium Common polygenic variation contributes to risk of schizophrenia and bipolar disorder. Nature. 2009;460:748–752. doi: 10.1038/nature08185. [DOI] [PMC free article] [PubMed] [Google Scholar]
- 110.Lichtenstein P., Holm N.V., Verkasalo P.K., Iliadou A., Kaprio J., Koskenvuo M., Pukkala E., Skytthe A., Hemminki K. Environmental and heritable factors in the causation of cancer—Analyses of cohorts of twins from Sweden, Denmark, and Finland. N. Engl. J. Med. 2000;343:78–85. doi: 10.1056/NEJM200007133430201. [DOI] [PubMed] [Google Scholar]
- 111.Turnbull C., Ahmed S., Morrison J., Pernet D., Renwick A., Maranian M., Seal S., Ghoussaini M., Hines S., Healey C.S., et al. Breast Cancer Susceptibility Collaboration (UK) Genome-wide association study identifies five new breast cancer susceptibility loci. Nat. Genet. 2010;42:504–507. doi: 10.1038/ng.586. [DOI] [PMC free article] [PubMed] [Google Scholar]
- 112.Orstavik K.H., Magnus P., Reisner H., Berg K., Graham J.B., Nance W. Factor VIII and factor IX in a twin population. Evidence for a major effect of ABO locus on factor VIII level. Am. J. Hum. Genet. 1985;37:89–101. [PMC free article] [PubMed] [Google Scholar]
- 113.de Lange M., Snieder H., Ariëns R.A., Spector T.D., Grant P.J. The genetics of haemostasis: A twin study. Lancet. 2001;357:101–105. doi: 10.1016/S0140-6736(00)03541-8. [DOI] [PubMed] [Google Scholar]
- 114.Smith N.L., Chen M.H., Dehghan A., Strachan D.P., Basu S., Soranzo N., Hayward C., Rudan I., Sabater-Lleal M., Bis J.C., et al. Wellcome Trust Case Control Consortium Novel associations of multiple genetic loci with plasma levels of factor VII, factor VIII, and von Willebrand factor: The CHARGE (Cohorts for Heart and Aging Research in Genome Epidemiology) Consortium. Circulation. 2010;121:1382–1392. doi: 10.1161/CIRCULATIONAHA.109.869156. [DOI] [PMC free article] [PubMed] [Google Scholar]
- 115.Visscher P.M., Medland S.E., Ferreira M.A., Morley K.I., Zhu G., Cornes B.K., Montgomery G.W., Martin N.G. Assumption-free estimation of heritability from genome-wide identity-by-descent sharing between full siblings. PLoS Genet. 2006;2:e41. doi: 10.1371/journal.pgen.0020041. [DOI] [PMC free article] [PubMed] [Google Scholar]
- 116.Silventoinen K., Sammalisto S., Perola M., Boomsma D.I., Cornes B.K., Davis C., Dunkel L., De Lange M., Harris J.R., Hjelmborg J.V., et al. Heritability of adult body height: A comparative study of twin cohorts in eight countries. Twin Res. 2003;6:399–408. doi: 10.1375/136905203770326402. [DOI] [PubMed] [Google Scholar]
- 117.Peacock M., Turner C.H., Econs M.J., Foroud T. Genetics of osteoporosis. Endocr. Rev. 2002;23:303–326. doi: 10.1210/edrv.23.3.0464. [DOI] [PubMed] [Google Scholar]
- 118.Duncan E.L., Danoy P., Kemp J.P., Leo P.J., McCloskey E., Nicholson G.C., Eastell R., Prince R.L., Eisman J.A., Jones G., et al. Genome-wide association study using extreme truncate selection identifies novel genes affecting bone mineral density and fracture risk. PLoS Genet. 2011;7:e1001372. doi: 10.1371/journal.pgen.1001372. [DOI] [PMC free article] [PubMed] [Google Scholar]
- 119.Dalageorgou C., Ge D., Jamshidi Y., Nolte I.M., Riese H., Savelieva I., Carter N.D., Spector T.D., Snieder H. Heritability of QT interval: how much is explained by genes for resting heart rate? J. Cardiovasc. Electrophysiol. 2008;19:386–391. doi: 10.1111/j.1540-8167.2007.01030.x. [DOI] [PubMed] [Google Scholar]
- 120.Russell M.W., Law I., Sholinsky P., Fabsitz R.R. Heritability of ECG measurements in adult male twins. J. Electrocardiol. 1998;30(Suppl):64–68. doi: 10.1016/s0022-0736(98)80034-4. [DOI] [PubMed] [Google Scholar]
- 121.Shah S.H., Pitt G.S. Genetics of cardiac repolarization. Nat. Genet. 2009;41:388–389. doi: 10.1038/ng0409-388. [DOI] [PubMed] [Google Scholar]
- 122.Hunt S.C., Hasstedt S.J., Kuida H., Stults B.M., Hopkins P.N., Williams R.R. Genetic heritability and common environmental components of resting and stressed blood pressures, lipids, and body mass index in Utah pedigrees and twins. Am. J. Epidemiol. 1989;129:625–638. doi: 10.1093/oxfordjournals.aje.a115175. [DOI] [PubMed] [Google Scholar]
- 123.Evans D.M., Frazer I.H., Martin N.G. Genetic and environmental causes of variation in basal levels of blood cells. Twin Research: The Official Journal of the International Society for Twin Studies. 1999;2:250–257. doi: 10.1375/136905299320565735. [DOI] [PubMed] [Google Scholar]