

Abstract
'q-titration' refers to the systematic comparison of signal intensities in solution NMR spectra of uniformly 15N labeled membrane proteins solubilized in micelles and isotropic bicelles as a function of the molar ratios (q) of the long-chain lipids (typically DMPC) to short-chain lipids (typically DHPC). In general, as q increases, the protein resonances = broaden and correspondingly have reduced intensities due to the overall slowing of protein reorientation. Since the protein backbone signals do not broaden uniformly, the differences in line widths (and intensities) enable the narrower (more intense) signals associated with mobile residues to be differentiated from the broader (less intense) signals associated with “structured” residues. For membrane proteins with between one and seven trans-membrane helices in isotropic bicelles, we have been able to find a value of q between 0.1 and 1.0 where only signals from mobile residues are observed in the spectra. The signals from the structured residues are broadened so much that they cannot be observed under standard solution NMR conditions. This q value corresponds to the ratio of DMPC: DHPC where the signals from the structured residues are “titrated out” of the spectrum. This q value is unique for each protein in magnetically aligned bilayers (q > 2.5) no signals are observed in solution NMR spectra of membrane proteins because they are “immobilized” by their interactions with the phospholipid bilayers on the relevant NMR timescale (~105 Hz). No signals are observed from proteins in liposomes (only long-chain lipids) either. We show that it is feasible to obtain complementary solution NMR and solid-state NMR spectra of the same membrane protein, where signals from the mobile residues are present in solution NMR spectra, and signals from the structured residues are present in the solid-state NMR spectra. With assigned backbone amide resonances, these data are sufficient to describe major features of the secondary structure and basic topology of the protein. Even in the absence of assignments, this information can be used to help establish optimal experimental conditions.
Keywords: CXCR1, MerF, MerE, Pf1, Vpu, p7, solid-state NMR, membranes, dynamics
Introduction
Proteins exhibit a wide range of dynamics, including global reorientation, local backbone fluctuations, and side chain motions of various types. Often the motions are correlated with specific structural features of the protein, and this is certainly the case for helical membrane proteins, which typically have mobile residues near their N- and C- termini, and sometimes associated with surface amphipathic helices. NMR spectroscopy is adept at describing the dynamics of proteins because both relatively slow motions (> 105 Hz), which average static powder patterns, and fast motions (108 – 109 Hz), which have strong affects on relaxation rates, can be detected and characterized experimentally. A thorough description of the amplitudes, directions, and frequencies of motions requires the analysis of many experimental measurements obtained at multiple field strengths. However, our understanding of the fundamental principles of nuclear spin relaxation is well established (1), and qualitative conclusions can be derived from the simplest measurements; for example the spin-spin relaxation time, T2, which can be determined from the resonance line width, and indirectly through its effect on the intensity of signals. A major benefit of using uniformly 15N labeled protein samples is that each backbone amide nitrogen has a single covalently bonded 1H, therefore the motional averaging of powder patterns and the induction of nuclear spin relaxation result from fluctuations of the same heteronuclear dipole-dipole interaction. This enables complementary results to be obtained from solution NMR of micelle/isotropic bicelle samples and from solid-state NMR of bilayer samples (2).
The situation is further simplified by the assumption that individual signal intensities, which can be readily measured in two-dimensional spectra, are determined principally by their line widths since the area for each backbone amide signal is the same. Consequently, the combined effects of local backbone and global reorientation amplitudes and rates are the principal determinants of signal intensities in solution NMR spectra of uniformly 15N labeled proteins. For soluble, globular proteins, the global isotropic reorientation rate is determined primarily by the size of the protein, and is effectively measured by the backbone 1H-15N or 1H-13Cα relaxation times (3); most backbone sites are structured and have the same rotational correlation time as the protein itself. Larger globular proteins reorient more slowly than smaller monomeric proteins at the same temperature; consequently, the signals of larger proteins have broader line widths and lower signal intensities in the spectra (1). The situation is more complex for helical membrane proteins; their global reorientation rate is affected by not only the number of residues in the polypeptide chain, but also the overall shape of the protein, i.e. whether is it “I”, “L”, or “H” shaped, or compactly folded. Moreover, the global reorientation also depends on the properties of the solubilizing detergent molecules and their assemblies (4).
The ‘q-titration’ experiment relies on the measurement of relative signal intensities in two-dimensional 1H/15N heteronuclear single quantum correlation (HSQC) spectra of uniformly 15N labeled membrane proteins solubilized in isotropic bicelles over a range of q values, typically between 0.1 and 1.0. When the global reorientation is slow at a relatively high q value, the resonances from structured residues disappear into the baseline because of the very limited capability of solution NMR experiments and spectrometers to detect the rapidly decaying free induction decays associated with resonances with very broad line widths. Local dynamics also affect signal intensities, and even quite large membrane proteins typically yield spectra that have some narrow, intense signals from mobile residues near the N- or C- termini (5).
Here we demonstrate that the measurement of signal intensities in solution NMR spectra of membrane proteins that are solubilized in DHPC micelles and DMPC: DHPC isotropic bicelles with q values < 1.0 serves as an effective tool for the qualitative characterization of the structure, dynamics, and topology of helical membrane proteins in micelle and isotropic bicelle environments (6). An important advantage of the ‘q-titration’ experiment is that it can be applied at a very early stage of an investigation, yielding insights into a protein’s properties long before its three-dimensional structure can be determined. With partial resonance assignments, the major transitions between structured and mobile regions can be identified, and as additional assignments are obtained, the structural resolution improves to that of single residues. This is particularly valuable for helical membrane proteins, which tend to have well defined transitions between secondary structure elements of helices, loops, and terminal segments. Even without assignments, the ‘q-titration’ experiment provides insights into the behavior of the membrane protein in a wide range of lipid preparations, which is an extremely helpful initial step towards the optimization of sample conditions for Solution NMR, Oriented Sample (OS) solid-state NMR, and Magic Angle Spinning (MAS) solid-state NMR studies. This assumes that there are similarities between proteins in micelle and isotropic bicelle environments and in bilayers.
Membrane proteins can be solubilized in micelles (7, 8), isotropic bicelles (9), and nanodiscs (10–12) for solution NMR studies. However, careful optimization of the sample conditions is essential in order to obtain well resolved two-dimensional 1H/15N HSQC solution NMR spectra that include signals from all of the backbone amide sites (13, 14). Most successful applications of solution NMR have been performed on samples of relatively small membrane proteins where the global reorientation rate of the solubilized polypeptide is relatively rapid (15). In general, larger membrane proteins give weaker, less well resolved spectra, regardless of the solubilization media; except for some narrow, intense signals a from mobile residues in linker regions or near the N- and C- termini (16). There are a few exceptional cases, in particular the sensory rhodopsins (17, 18), where a relatively large helical membrane proteins does yield well-resolved solution NMR spectra.
In studies of membrane proteins from bacteria, viruses, and humans with between one and seven trans-membrane helices, we have found that they behave in a consistent and predictable manner with the full set of solubilization detergents/lipids (micelles, isotropic bicelles, and nanodiscs) used to prepare samples for solution NMR experiments. Notably, we have not studied proteins from archae, such as the sensory rhodopsins, which apparently have unique physical properties. The line widths of backbone amide resonances increase and the peak heights decrease in rough proportion to both the size of the polypeptide and the q of the isotropic bicelles, the molar ratio of the ‘long’ chain lipid (typically DMPC) to the ‘short’ chain lipid (typically DHPC or a detergent such as CHAPSO or Triton X-100). Smaller q values (0 – 0.5) are associated with faster global reorientation, and larger q values (0.5 – 1.0), are associated with slower global motion. We find that helical membrane proteins embedded in nanodiscs give spectra with line widths and intensities roughly equivalent to those obtained in isotropic bicelles with a q value of 0.5. As a result, a few spectra in samples with a range of q values enables a prediction of the feasibility of solution NMR structural studies of individual membrane proteins in micelle, isotropic bicelle, and nanodisc environments.
To illustrate the ‘q-titration’ experiment in the simplest terms, simulated ‘spectra’ representative of those observed from a “typical” protein with two trans-membrane helices (Figure 1A) are shown in Figure 1B for q values between 0 and 3.2. Each ‘dot’ represents a single 1H/15N correlation signal from a backbone amide site of the protein. These dots are drawn with a range of sizes in order to explain the experiment. They are not calculated by a sophisticated algorithm. The relative intensities of the observed signals vary within each ‘spectrum’. Notably, even in the ‘spectrum’ from the protein in micelles (q=0), which would be expected to undergo the fastest and most isotropic global reorientation some signals are more intense than others. This is shown clearly in Figure 1C where relative signal intensities are plotted as a function of residue number. In this example, signals from residues near the N- and C- termini are more intense than those in the middle of the protein. The data in Figure 1 were arbitrarily chosen to demonstrate the potential of the approach to differentiate regional dynamics within the protein by comparison of spectra using samples with q values of 0, 0.5, and 1.0. Notably, even for a small membrane proteins, many signals are broadened or missing in isotropic bicelles of q=0.5 where there is evidence of bilayers surrounding the proteins (19), and this is reflected in the corresponding intensity versus residue number plot in Figure 1C. The “spectrum” of the protein in q=1.0 isotropic bicelles contains only a subset of the total number of resonances observed in the q=0 micelles; the signals from the structured interior residues are ‘titrated out’, because they are too broad to be detected. In contrast the residues with local backbone mobility have resonances that are narrow and intense enough to be easily observed. All of the visible resonances in the Figure 1B q=1.0 spectrum are associated with residues near the N- and C- termini. When the q value is greater than about 2.5, a magnetically alignable bilayer phase is formed. In this case, the lipids in the bilayers immobilize the protein on the NMR timescales (20), and no reliable backbone signals can be observed in solution NMR spectra of these samples (Figure 1B).
FIGURE 1.
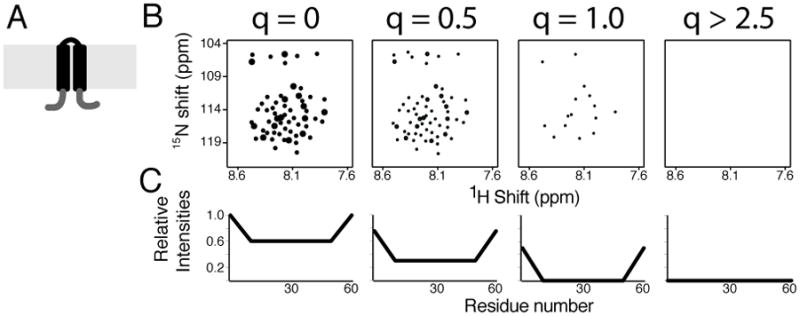
Illustration of the q-titration experiment for a membrane protein with two trans membrane helices using artificial data. A. Cartoon of a membrane protein with two trans membrane helices with the structured helical and loop residues in black and the mobile residues near the N- and C- termini in grey. B. Simulated two-dimensional 1H/15N HSQC solution NMR spectra of the protein in a mixture of long-chain and short-chain lipids over the range of q values shown at the top of each spectrum. C. Relative signal intensities measured from the spectra in B plotted as a function of residue number.
As q is increased from 0 to 1.0 in an experimental titration, the intensities of the signals from structured residues, such as those in trans-membrane helices or stable inter-helical loops, decrease much more dramatically than those associated with mobile backbone sites, such as those near the N- and C- termini of the protein or in mobile, internal segments. In all of the examples that we have examined, it has been possible to find a value of q where the signals from the structured residues disappear completely into the baseline of the solution NMR spectra due to severe line broadening while the narrow signals from mobile residues remain observable with somewhat decreased intensity. This is illustrated in Figure 2 using experimental data from MerFt; where the behaviors of a signal assigned to a mobile residue (Leu 17) near the N-terminus and a signal assigned to a structured residue in a hydrophobic trans membrane helix (Leu 57), respectively, are compared. At all q values the signal from Leu 17 is narrower and more intense than that from Leu 57. However, the difference is most dramatic at q values between about 0.3 and 0.5 where the signal from Leu 57 is broadened to undetectable levels under normal high-resolution solution NMR experimental conditions. The q value with the greatest intensity difference between mobile and structured residues differs for each protein, but the trends are clear and it is feasible to find a q value where the spectrum contains only signals from mobile residues and the signals from the structured residues are “titrated out” of the spectrum because they are so broad. This provides a clear picture of which residues are structured and which are mobile, the most basic goal of these experiments.
FIGURE 2.
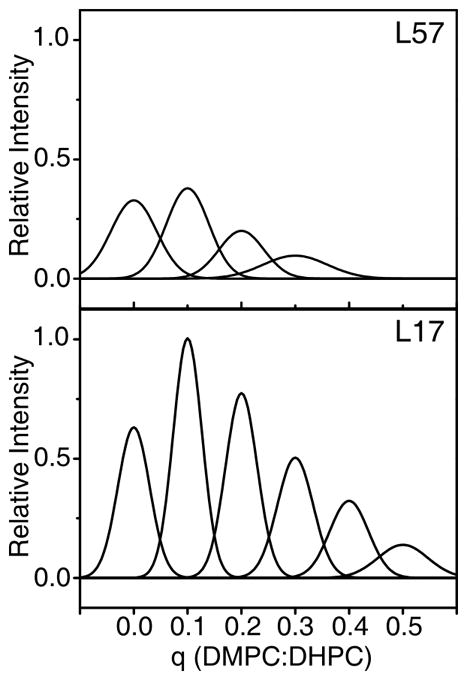
Peak height vs. q ratio for the L57 and L17 amide resonances of the Mer Ft construct. Data points are represented as Gaussians and centered about their respective q ratio. All Gaussians are defined by peak heights and line width measured from experimental data with the program SPARKY and normalized with respect to the point for L17 q=0.1. L17 is located in the mobile N-terminus, gives rise to narrow, high intensity peaks at low q values, and is observable over a large range of q values. L57 is centrally located in the second trans membrane helix, and gives rise to relatively broad, low intensity peaks at low q values, and is not observable at q>0.3.
In summary, the experimental spectra, and plots of signal intensities as a function of residue number, segregate the signals observable in the starting q=0 or q=0.1 samples into two classes: those that disappear (structured residues that are ‘titrated out’) at a certain q value, and those that are still observable in the spectra at high but still isotropic q values (0.5 – 1.0).
The choice of detergents, lipids, or the various combinations used to solubilize membrane proteins is one of the most important decisions at the start of solution NMR studies (21). The development of solubilized membrane protein samples for structure determination has gone through three distinct phases. The first was to find conditions that would yield high resolution NMR spectra of trans-membrane helix containing proteins in detergent or lipid environments without spectral artificats, such as misssing peaks or peak doublings (22). The second was to find conditions that would allow the protein in micelles or isotropic bicelles to be soaked into polyacrylamide gels that can be stressed for the measurement of residual dipolar couplings (23–25). And the third, which remains a subject of much current research is to find combinations of detergents, lipids, and proteins that preserve the native structure of the membrane protein of interest, while simultaneously fulfilling the first two criteria. The issue of how much the micelles or isotropic bicelles perturb the structure of a membrane protein is profound, and remains to be resolved. There may not be a general answer, and each protein will need to be independently evaluated. Here we assume that the structures and dynamics of our panel of membrane proteins are roughly similar in isotropic bicelles and in bilayers. Nanodiscs have been proposed as a practical compromise where a protein embedded in a bilayer environment reorients rapidly enough to yield high-resolution spectra. While an attractive approach, we have found that for helical membrane proteins the spectra in nanodiscs approximate those with q value of 0.5, which are generally broad and missing most or all signals from the structured residues. We have not yet examined beta barrel membrane proteins, and their greater spread of chemical shifts may make it easier to tolerate the line broadening from the lipid environment, including in nanodiscs.
Results and Discussion
The first step in a ‘q-titration’ experiment is to prepare uniformly 15N labeled protein by expression in bacteria (26, 27). The protein is then isolated from the cell membranes or as inclusion bodies, purified using one or more types of chromatography, and then refolded and solubilized in aqueous solution containing DHPC. In the absence of long chain lipids, the short-chain DHPC acts as a micelle-forming detergent, and provides a favorable environment for the refolding and solubilization of helical membrane proteins. As with other detergents, DHPC’s merit as a mimic of a membrane proteins’ native environment remains an open question, especially since in many examples the spectra obtained from a membrane protein solubilized in pure DHPC in aqueous solution (q=0) are improved by adding a small amount of DMPC. In order to facilitate direct comparisons, we use q=0.1 bicelle spectra as the baseline for the measurement of signal intensities. We define the most intense signal in the spectrum of a protein in a q=0.1 isotropic bicelle as having a relative intensity of 1.0 for all plots of signal intensities as a function of residue number.
In addition to solubilizing the hydrophobic membrane protein, DHPC has a second role in the ‘q-titration’ experiment. DHPC serves as the ‘short chain’ phospholipid required in combination with a ‘long chain’ phospholipid, generally DMPC (9, 28, 29) for the formation of bicelles. Bicelles have also been made using CHAPSO(30) and Triton-X 100(31) as the ‘short chain’ phospholipid, which have similar properties to the DHPC: DMPC bicelles used here. As described above in the Introduction, the ‘q-titration’ experiment itself consists of obtaining a series of two-dimensional HSQC spectra (32) of a uniformly 15N labeled membrane protein (33) solubilized in DHPC micelles. The spectra are obtained on samples containing increasing amounts of DMPC in order to form DMPC: DHPC isotropic bicelles with q between 0.1 and 1.0. All other experimental conditions, such as temperature, pH, etc., remain constant. The intensities of all the resonances are measured, and normalized to the most intense signal in the q=0.1 spectrum of the protein. The spectra in Figure 1B illustrate how a plot of signal intensities as a function of residue number for several q values can be used to obtain a visual map of the dynamics of individual residues within the context of the protein sequence. Samples with q<1.5 are generally referred to as isotropic bicelles, and are potentially suitable for solution NMR spectroscopy; however, for most proteins it is not possible to obtain any reliable solution NMR signals in bicelles with q > 1.0. The long chain lipids in bicelles with q>2.5 form a planar bilayer phase, which immobilizes the protein on the relevant NMR timescales, and these samples also yield no reliable backbone signals in solution NMR spectra (29). However, these samples are well suited for solid-state NMR experiments (29, 34).
Experimental data for eight different domains, truncated constructs, and full-length membrane proteins are compared in Figure 3. The second column from the right, which is labeled q = 3.2 contains no verifiable solution NMR signals from the backbone amide sites of any of the proteins, which range in size from 46 to 350 residues. The rightmost column, also labeled q=3.2, presents one-dimensional solid-state NMR spectra of the same proteins; because these 1H decoupled 15N signals were obtained by spin-lock cross-polarization, the signals must arise from “immobile” residues with strong heteronuclear dipolar couplings. The order parameter deduced from these spectra is ~0.85, which is typical for both the lipids and proteins in magnetically aligned bilayers with q=3.2. Solid-state NMR spectra cannot be obtained from any of the protein samples with q between 0 and 1.0, since the proteins are reorienting relatively rapidly in aqueous solution, and average out the heteronuclear dipolar coupling require for cross polarization and 1H decoupling.
FIGURE 3.

Experimental demonstration of the q-titration experiment applied to eight different constructs of membrane proteins that are shown as cartoon in the left most column. As in Figure 1, black is associated with structured residues and gray with mobile residues The next column show a plot of resonance intensity as a function of residue number for q=0.3 or q=0.5. A. The membrane-bound form of Pf1 coat protein. B. The cytoplasmic domain of the Vpu from HIV-1. C. Full-length Vpu from HIV-1. D. p7 from HCV. E. - G. Mercury transport membrane proteins from the bacterial mercury detoxification system. E. MerFt, which is a N- and C- terminal truncated construct of MerF. F. Full-length MerF. G. MerE. H. CXCR1. The two-dimensional [15N, 1H]-HSQC NMR spectra were obtained from samples with q values between 0 and 3.2, as indicated on the top of the columns, at 50°C and 600 MHz, except for those from CXCR1, which were obtained at 800 MHz. There are no authentic backbone signals observed in the solution NMR spectra of the q=3.2 samples. The one-dimensional spectra in the rightmost column were acquired on samples of the membrane proteins in magnetically aligned bilayers (q=3.2) using the solid-state NMR methods of cross-polarization and high power 1H decoupling during acquisition of the 15N signals.
The properties of the ‘q titration’ experiment illustrated with simulated data in Figure 1 are reiterated by the experimental data in Figure 3. In the left most column cartoon representations of the various polypeptides are displayed. Black indicates that the residues are structured and reorient with the same correlation time as the entire polypeptide-lipid ensemble, and grey indicates the presence of local backbone motions, as determined from the experimental data in Figure 3. The locations of the structured and mobile segments of the protein are based on the plots of signal intensity as a function of residue number shown in the second column from the left.
The top row of Figure 3A contains the experimental data from the 46-residue membrane-bound form of Pf1 coat protein. This protein has a hydrophobic trans-membrane helix and an N-terminal amphipathic helix. In the cartoon representation on the left, the amphipathic N-terminal helix is shown on the surface of the membrane, although these data and previous studies show that this helix is flicking on and off the surface due to segmental motions centered at the ‘hinge’ between the two helices (19). This motion is essential for the assembly of the protein subunits into virus particles, during which the protein undergoes a substantial structural rearrangement at the membrane surface. The “L” shaped conformation shown in the leftmost column, changes to the “I” shaped conformation found in the structural form of the assembled virus particles. During assembly, the amphipathic surface helix rotates about 90° to a position roughly parallel to the hydrophobic helix. In q = 1.0 bicelles, only a subset of signals are observable, with the rest ‘titrated out’. These signals are mainly from residues in the mobile N-terminal amphipathic helix and a few from the N-terminus; the signals from the trans-membrane helix are so broad under these conditions that they are not detectable in solution NMR experiments. By contrast, only signals from the structured trans membrane helix are present in the solid-state NMR spectrum obtain from the sample with q = 3.2, as shown in the rightmost column. The effects of local dynamics makes the solution NMR spectrum with q = 1.0 and the solid-state NMR spectrum with q = 3.2 fully complementary; the former contains signals from all the mobile residues (mainly the mobile amphipathic helix), and the latter contains signals from all the structured residues (mainly the hydrophobic trans membrane helix). Between these two spectra, signals from all of the residues in the protein can be assigned and accounted for. The discrimination between the two classes of resonances is based solely on local protein dynamics, which becomes more obvious in the data obtained from samples with slower global reorientation rates, such as isotropic bicelles with large q values.
Figure 3B and C contains experimental data obtained from two constructs of the membrane protein Vpu from HIV-1; the data are aligned by the sequence of the full-length protein. The 81-residue protein has one trans membrane helix (35)and two amphipathic helices associated with the cytoplasmic domain on the surface of the bilayer . The amphipathic surface helices are separated by a small stretch of mobile residues. The data in Figure 3B are from an N-terminal truncated construct of Vpu that contains only the residues from the cytoplasmic domain. In Figure 3C the data are from the full-length protein; the spectra obtained from samples in q=0 micelles and q=0.1 isotropic bicelles include all of the signals from the trans membrane helix in addition to those from the cytoplasmic domain. The signals from residues in the trans membrane helix are significantly broader when the protein is associated with q=0.5 isotropic bicelles. In contrast, the signals from residues in the mobile inter-helical region between the two surface amphipathic helices, whether in the cytoplasmic domain alone or the full-length protein, are readily observable in isotropic bicelles with q=0.5 and q=1.0. This is remarkable; as shown in the plots of intensity as a function of residue number (second from the left column), the intensities of these residues are barely affected in samples with q=0.5 or q=1.0. In the smaller cytoplasmic domain polypeptide the broadening of the signals from the helical residues is not as dramatic as for the full-length protein in isotropic bicelles with the higher q values. Regardless of the balance between the effects of changes in global reorientation rates and local backbone dynamics, the plot of intensities as a function of residue number in Figure 3B shows that the polypeptide corresponding to the cytoplasmic domain of Vpu has five distinct regions: a mobile N-terminus, near the site of truncation; a mobile connecting region between the two amphipathic helices; a mobile C-terminus; and two structured helices. The results for the full-length protein (Figure 3C) indicate that the trans-membrane helix behaves as an independent domain, and does not influence the cytoplasmic domain of the protein The native full-length protein is unusual for a helical membrane protein in that it has mobile residues neither at the N-terminus, nor at the bend between the trans membrane helix and the first cytoplasmic amphipathic helix.
Both Vpu (Figure 3B and 3C) from HIV-1 and p7 (Figure 3D) from human Hepatitis C Virus (HCV) are classified as viroporins, which are small membrane proteins with roles in the production of new virus particles from infected cells. Although like other viroporins, Vpu and p7 have functional similarities, including ion channel activities, they have quite different architectures (36), as can be seen in the schematic representations in Figure 3C (Vpu) and 3D (p7). p7 has mobile C- and N- terminal residues, and a small, structured inter-helical loop that connects two hydrophobic trans-membrane helices. One of the most interesting findings is that in the middle of the protein there is region that displays somewhat higher signal intensities in the experimental spectra. This region is observable in the plot of relative intensities as a function of residue number in Figure 3D. These residues are from a segment of a trans-membrane helix that displays internal dynamics. Evidence for motions in this internal helical segment comes not only from these data, but also from more detailed studies performed on truncated constructs of p7 in micelles and isotropic bicelles, and on full-length and truncated constructs in bilayers investigated by solid-state NMR spectroscopy (37). However, the data in Figure 3D are sufficient to establish this finding.
Figure 3E, F, and G contain results obtained from constructs of mercury transport membrane proteins from the bacterial mercury detoxification system (38). This is a family of proteins of interest for their functions as heavy metal transporters and their range of structural properties; in particular, there are members with two, three, and four trans-membrane helices, and there are several different metal-binding motifs involving cysteine residues. The full-length two TM protein MerF is shown in Figure 3F. This is a prototypical small membrane protein with two hydrophobic trans-membrane helices separated by a ~10 residue structured inter-helical loop. The plot of intensities as a function of residue number shows that only N- and C- terminal residues are mobile. Even though this is a relatively small 81-residue membrane protein many residues are broadened beyond detection in the q=0.5 isotropic bicelle sample. The mobile terminal residues of the full-length protein were removed by preparation of a truncated construct, MerFt, whose data are shown in Figure 3E. At the sites of truncation, there are a few mobile residues that clearly do not retain their stable folding in the absence of adjacent residues; however the interior of the protein, including the two trans-membrane helices and the inter-helical loop appears to be essentially the same.
MerE is a mercury transport protein with similarity to MerF, since it too has two TM helices. The overall properties of MerE are described by the data in Figure 3G. The plot of signal intensities as a function of residue number is consistent with the relatively long N-terminal region that extends beyond the first TM helix having internal backbone mobility. The central portion of the protein, consisting of two TM helices separated by an inter-helical loop, appears to be fully structured, with evidence for only a few mobile residues near the C-terminus.
The example in Figure 3H is a much larger membrane protein, the G-protein coupled receptor CXCR1, with seven trans membrane helices and 350 residues. Even in isotropic bicelles with a q=0.1, no signals from the residues in the helices and internal loops can be observed. This demonstrates that these regions of the protein are structured and reorient with a longer overall correlation time consistent with a large protein-lipid complex. Only signals from the mobile residues near the N- and C- termini are present in the spectra, and many of these are broadened beyond detection in the q=0.5 isotropic bicelle sample. In detailed studies of the local and global dynamics of CXCR1, many different micelle, bicelle, and nanodisc environments were prepared, and only signals from the terminal residues could be observed in solution NMR spectra under all of the sample and experimental conditions examined (16).
Conclusions
The ‘q-titration’ experiment is effective because of the differential line broadening between signals from residues with local backbone motions and those that are structured. The relative line widths of individual signals can be deduced by examining their signal intensities, which are readily measured even in relatively broad and marginally resolved spectra. For smaller membrane proteins, the effect is enhanced as long-chain lipids are added to the sample, which increases the q value and slows the global rotational correlation time. This is observed most clearly in the plots of relative signal intensities as a function of residue number at each q value. The differences between the signals from mobile and structured sites for membrane proteins with one or two trans membrane helices are most dramatic at q values around 0.5. It is possible to find a q value where the signals from the structured residues broaden beyond detection (“titrated out”) whereas only relatively minor decreases in intensities are observed for the signals associated with residues at the mobile sites near the N- and C- termini. Typically, the q=1.0 spectrum contains only signals from mobile residues. By contrast, at q=3.2 where magnetically aligned bilayers are formed, the signals from all backbone residues disappear, including those undergoing local backbone motions.
The proteins examined with the data in Figure 3 range from 46 residues (Pf1 coat protein) to 350 residues (CXCR1) are consistent in having no authentic backbone resonances in solution NMR spectra of q=3.2 samples. However, all of the proteins yield substantial resonance intensity in solid-state NMR spectra with q=3.2. Although all of the samples are uniformly labeled with 15N, the solid-state NMR spectra have resonance frequencies and fine structure consistent with their retaining folded structures while highly aligned along with the bilayers by the magnetic field.
Based on the data in Figure 3 we found that helical membrane proteins behave predictably in a wide range of lipid environments. The line widths from signals associated with structured residues broaden as the sizes of the proteins and the q value of the isotropic bicelles increase. By itself, the ‘q-titration’ experiment provides a reliable, qualitative description of the backbone dynamics and topology of a membrane protein. It also has a role in the optimization of sample conditions for both solution NMR and solid-state NMR studies, since the signals monitor folding and aggregation in addition to the details of the polypeptide chain. We have found general agreement between those residues found to be mobile by solution NMR in micelles, isotropic bicelles, and nanodiscs and those found to be mobile by solid-state NMR in bilayers. However, these findings must be interpreted cautiously because of the known effects of detergent on perturbing the structures of membrane proteins.
The optimization of conditions for micelle, isotropic bicelle, or nanodisc samples for solution NMR of membrane proteins is a mostly empirical process that began thirty years ago (7, 13) and continues to be an active area of research (15, 39–41). Here we show how a very simple experimental protocol based on the most fundamental principles of NMR spectroscopy (1) can provide a first glimpse at the principal features of a membrane protein and accelerate the sample optimization process. We routinely perform the ‘q titration’ experiment on every new polypeptide that is expressed in order to characterize its properties and to find a starting point for the design of conditions and experiments that accelerates the sample optimization process.
4. Experimental Methods
Plasmid DNAs were obtained from Novagen (EMD Biosciences, www.emd-chemicals.com), C41 (DE3) bacterial strains were obtained from Lucigen (www.lucigen.com), and other competent cells were from New England Biolabs (www.neb.com). The 15N ammonium sulfate was obtained from Cambridge Isotope Laboratories (www.isotope.com). Unlabeled DMPC and DHPC were purchased from Avanti Polar Lipids (www.avantilipids.com) and Anatrace (Affymetrix, www.affymetrix.com).
Uniformly 15N labeled proteins were prepared by expression in bacteria grown in minimal media containing 15N ammonium sulfate as the sole nitrogen source (26). The proteins were generally isolated as inclusion bodies with a fusion partner and purified using nickel chelated chromatography to take advantage of the presence of added histidines tags. The proteins were then subject to HPLC or FPLC for final purification. Following removal of solvent, they were lyophilized and stored as powders (42, 43).
The q=0 micelle samples were prepared by dissolving ~2 mg of the purified protein powder in 500 ul of 1H2O with 100 mM perdeuterated DHPC and 10% (v/v) 2H2O, at pH 6.7. The isotropic bicelle samples were prepared by successively adding DMPC to the original DHPC (q=0) sample in the appropriate amounts for the various q values.
The magnetically aligned bilayer samples for solid-state NMR were prepared by solubilizing 1 mg – 6 mg of the purified protein in a solution containing DHPC, which was then added to a dispersion of the long chain lipid, DMPC to achieve q=3.2. The samples had a lipid concentration of 28% (w/v) and contained 300 mM DMPC in a volume of 180 μl of 1H2O at pH 6.7. For solid-state NMR experiments, a flat-bottomed NMR tube with 5 mm OD (New Era Enterprises, www.newera-spectro.com) was filled with 160 μl of the sample solution.
The solution NMR experiments were performed at temperatures between 0°C – 50°C on a Bruker Avance 600 MHz or a Varian VNMRS 800 MHz spectrometers equipped with 1H/13C/15N triple-resonance cryogenic probes. A WATERGATE pulse sequence (44) for water suppression was incorporated into the fast HSQC (32) experiment to acquire the data for the experimental two-dimensional HSQC spectra shown in Figure 3. The NMR data were processed and analyzed using NMRPipe/NMRDraw (45).
The solid-state NMR experiments were performed between 40°C – 42°C on a Bruker Avance 700 spectrometer equipped with a homebuilt (1H/15N) double-resonance probe with a 5 mm inner diameter solenoid coil. The one-dimensional 15N NMR spectra were obtained by spin-lock cross-polarization (46) with a contact time of 1 ms, a recycle delay of 4 s – 6 s, and an acquisition time of 10 ms – 20 ms.
Membrane protein dynamics can be identified based on signal intensities.
It is possible to find q values where signals from structured residues are absent.
Signals from structured residues in smaller proteins disappear at higher q values.
Acknowledgments
This research was supported by grants from the National Institutes of Health. It utilized the Biomedical Technology Resource for NMR Molecular Imaging of Proteins at the University of California, San Diego, which is supported by grant P41EB002031.
Footnotes
Publisher's Disclaimer: This is a PDF file of an unedited manuscript that has been accepted for publication. As a service to our customers we are providing this early version of the manuscript. The manuscript will undergo copyediting, typesetting, and review of the resulting proof before it is published in its final citable form. Please note that during the production process errors may be discovered which could affect the content, and all legal disclaimers that apply to the journal pertain.
References
- 1.Bloembergen N, Purcell EM, Pound RV. Relaxation effects in nuclear magnetic resonance absorption. Phys Rev. 1948;73:679–712. [Google Scholar]
- 2.Bogusky MJ, Schiksnis RA, Leo GC, Opella SJ. Protein backbone dynamics by solid state and solution 15N NMR spectroscopy. J Magn Reson. 1987;72:186–190. [Google Scholar]
- 3.Bauer DR, Opella SJ, Nelson DJ, Pecora R. Depolarized light scattering and carbon nuclear resonance measurements of the isotropic rotational correlation time of muscle calcium binding protein. J Am Chem Soc. 1975;97:2580–2582. doi: 10.1021/ja00842a067. [DOI] [PubMed] [Google Scholar]
- 4.Gangabadage CS, Najda A, Bogdan D, Wilmenga SS, Tessari M. Dependence of the size of a protein-SD complex on degetergent and Na+ concentrations. J Phys Chem B. 2008;112:4242–4245. doi: 10.1021/jp710045e. [DOI] [PubMed] [Google Scholar]
- 5.Tian C, Breyer RM, Kim HJ, Karra MD, Friedman DB, Karpay A, Sanders CR. Solution NMR spectroscopy of the human vasopressin V2 receptor, A G protein-coupled receptor. J Am Chem Soc. 2006;128:5300. doi: 10.1021/ja051161b. [DOI] [PubMed] [Google Scholar]
- 6.Sanders CR, 2nd, Schwonek JP. Characterization of magnetically orientable bilayers in mixtures of dihexanoylphosphatidylcholine and dimyristoylphosphatidylcholine by solid-state NMR. Biochemistry. 1992;31:8898–8905. doi: 10.1021/bi00152a029. [DOI] [PubMed] [Google Scholar]
- 7.Cross TA, Opella SJ. Structural properties of fd coat protein in sodium dodecyl sulfate micelles. Biochem Biophys Res Commun. 1980;92:478–484. doi: 10.1016/0006-291x(80)90358-7. [DOI] [PubMed] [Google Scholar]
- 8.Lauterwein J, Bosch C, Brown LR, Wuthrich K. Physicochemical studies of the protein-lipid interactions in melittin-containing micelles. Biochim Biophys Acta. 1979;556:244–264. doi: 10.1016/0005-2736(79)90046-4. [DOI] [PubMed] [Google Scholar]
- 9.Glover KJ, Whiles JA, Wu G, Yu N, Deems R, Struppe JO, Stark RE, Komives EA, Vold RR. Structural evaluation of phospholipid bicelles for solution-state studies of membrane-associated biomolecules. Biophys J. 2001;81:2163–2171. doi: 10.1016/s0006-3495(01)75864-x. [DOI] [PMC free article] [PubMed] [Google Scholar]
- 10.Shenkarv XO, Paramonov AS, Lyukmanova EN, Shingarova LN, Yakimov SA, Dubinnyi MA, Chupin VV, Kirpichnikov MP, Blommers MJ, Arseniev AS. Lipid-protein nanodiscs as reference medium in detergent screening for high-resolution NMR studies of integral membrane proteins. J Amer Chem Soc. 2010;132:5628–5629. doi: 10.1021/ja9097498. [DOI] [PubMed] [Google Scholar]
- 11.Ritchie TK, Grinkova YV, Bayburt TH, Denisov IG, Zolnerciks JK, Atkins WM, Sligar SG. Reconstitutiion of membrane proteins in phospholipid bilayer nanodiscs. Meth Enzymol. 2009;464:211–231. doi: 10.1016/S0076-6879(09)64011-8. [DOI] [PMC free article] [PubMed] [Google Scholar]
- 12.Raschle T, Hiller S, Yu TY, Rice AJ, Walz T, Wagner G. Structural and functional characterization of the integral membrane protein VDAC-1 in lipid bilayer nanodiscs. Journal of the American Chemical Society. 2009;131:17777–17779. doi: 10.1021/ja907918r. [DOI] [PMC free article] [PubMed] [Google Scholar]
- 13.McDonnell PA, Opella SJ. Effect of detergent concentration on multidimensional solution NMR spectra of membrane proteins in micelles. J Magn Reson. 1993;B102:120–125. [Google Scholar]
- 14.Kruger-Koplin RD, Sorgen PL, Druieger-Koplin ST, Rivera-Torres IO, Cahill SM, Krulwich TA, Girvin ME. An evaluation of detergents for NMR structural studies of membrane proteins. J Biomol NMR. 2004;28:1980–1987. doi: 10.1023/B:JNMR.0000012875.80898.8f. [DOI] [PubMed] [Google Scholar]
- 15.Kim HJ, Howell SC, Van Horn WD, Jeon YH, Sanders CR. Recent Advances in the Application of Solution NMR Spectroscopy to Multi-Span Integral Membrane Proteins. Progress in nuclear magnetic resonance spectroscopy. 2009;55:335–360. doi: 10.1016/j.pnmrs.2009.07.002. [DOI] [PMC free article] [PubMed] [Google Scholar]
- 16.Park SH, Casagrande F, Das BB, Albrecht L, Chu M, Opella SJ. Local and global dynamics of the G-protein-coupled receptor CXCR1. Biochemistry. 2011:2371–2380. doi: 10.1021/bi101568j. [DOI] [PMC free article] [PubMed] [Google Scholar]
- 17.Gautier A, Kirkpatrick JP, Nietlispach D. Solution-state NMR spectroscopy of a seven-helix transmembrane protein receptor: backbone assignmnet, secondary structure, and dynamics. Angew Chem Int Ed Engl. 2008;47:7297–7300. doi: 10.1002/anie.200802783. [DOI] [PubMed] [Google Scholar]
- 18.Gautier A, Mott HR, Bostock MJ, Kirkpatrick JP, Nietlispach D. Structure determination of the seven-helx transmembrane receptor sensory rhodopsin II by solution NMR. Nautre Structural & Molecular Biology. 2010;17:768–775. doi: 10.1038/nsmb.1807. [DOI] [PMC free article] [PubMed] [Google Scholar]
- 19.Lee D, Walter KFA, Bruckner AK, Hilty C, Becker S, Griesinger C. Bilayer in small bicelles revealed by lipid-protein interactions using NMR spectroscopy. J Am Chem Soc. 2008;130:13822–13823. doi: 10.1021/ja803686p. [DOI] [PubMed] [Google Scholar]
- 20.Cross TA, Opella SJ. Solid-state NMR structural studies of peptides and proteins in membranes. Curr Opin Struct Biol. 1994;4:574–581. [Google Scholar]
- 21.Anderssson A, Almqvist J, Hagn F, Maler L. Diffusion and dynamics of penetratin in different membrane mimicking media. Biochim Biophys Acta- Biomembranes. 2004;1161:18–25. doi: 10.1016/j.bbamem.2003.11.014. [DOI] [PubMed] [Google Scholar]
- 22.McDonnell PA, Opella SJ. Effect of detergent concentration on multidimensional solution NMR spectra of membrane proteins in micelles. J Magn Reson. 1993;B102:120–125. [Google Scholar]
- 23.Chou JJ, Gaemers S, Howder B, Louis JM, Bax A. A simple apparatus for generating stretched polyacrylamide gels, yielding uniform alignment of proteins and detergent micelles. J Biomol NMR. 2001;21:377–382. doi: 10.1023/a:1013336502594. [DOI] [PubMed] [Google Scholar]
- 24.Jones DH, Opella SJ. Weak alignment of membrane proteins in stressed polyacrylamide gels. J Magn Reson. 2004;171:258–269. doi: 10.1016/j.jmr.2004.08.022. [DOI] [PubMed] [Google Scholar]
- 25.Cierpicki T, Bushweller J. Charged gels as orienting media for measurement of residual dipolar couplings in soluble and integral membrane proteins. J Am Chem Soc. 2004;126:16259–16266. doi: 10.1021/ja046054g. [DOI] [PubMed] [Google Scholar]
- 26.Cross TA, DiVerdi JA, Opella SJ. Strategy for nitrogen NMR of biopolymers. J Am Chem Soc. 1982;104:1759–1761. [Google Scholar]
- 27.Meselson M, Stahl F. The replication of DNA in Escherichia coli. Proc Natl Acad Sci. 1958;44:671–682. doi: 10.1073/pnas.44.7.671. [DOI] [PMC free article] [PubMed] [Google Scholar]
- 28.Prosser RS, Evanics F, Kitevski JL, Al-Abdul-Wahid MS. Current applications of bicelles in NMR studies of membrane-associated amphiphiles and proteins. Biochemistry. 2006:8453–8465. doi: 10.1021/bi060615u. [DOI] [PubMed] [Google Scholar]
- 29.Sanders CR, Hare B, Howard KP, Prestegard JH. Magnetically-oriented phospholipid micelles as a tool for the study of membrane-associated molecules. Progr NMR Spectrosc. 1994;26:421–444. [Google Scholar]
- 30.Sanders CR, 2nd, Prestegard JH. Magnetically orientable phospholipid bilayers containing small amounts of a bile salt analogue, CHAPSO. Biophysical journal. 1990;58:447–460. doi: 10.1016/S0006-3495(90)82390-0. [DOI] [PMC free article] [PubMed] [Google Scholar]
- 31.Park SH, Opella SJ. Triton X-100 as the 'short-chain lipid' improves the magentic alignment and stability of membrane proteins in phosphatidylcholine bilayers for oriented-sample solid-state NMR spectroscopy. J Am Chem Soc. 2010;132:12552–12553. doi: 10.1021/ja1055565. [DOI] [PMC free article] [PubMed] [Google Scholar]
- 32.Mori S, Abeygunawardana C, Johnson M, VanZijl P. Improved sensitivity of HSQC spectra of exchanging protons at short interscan delays using a new fast HSQC (FHSQC) detection scheme that avoids water saturation. J Magn Reson B. 1995;108:94–98. doi: 10.1006/jmrb.1995.1109. [DOI] [PubMed] [Google Scholar]
- 33.Bogusky MJ, Leighton P, Schiksnis RA, Khoury A, Lu P, Opella SJ. 15N NMR spectroscopy of proteins in solution. J Magn Reson. 1990;86:11–29. [Google Scholar]
- 34.DeAngelis AA, Nevzorov AA, Park SH, Howell SC, Mrse AA, Opella SJ. High-resolution NMR spectroscopy of membrane proteins in aligned bicelles. J Am Chem Soc. 2004;126:15340–15341. doi: 10.1021/ja045631y. [DOI] [PubMed] [Google Scholar]
- 35.Park SH, De Angelis AA, Nevzorov AA, Wu CH, Opella SJ. Three-dimensional structure of the transmembrane domain of Vpu from HIV-1 in aligned phospholipid bicelles. Biophys J. 2006;91:3032–3042. doi: 10.1529/biophysj.106.087106. [DOI] [PMC free article] [PubMed] [Google Scholar]
- 36.Cook GA, Zhang H, Park SH, Wang Y, Opella SJ. Comparative NMR studies demonstrate profound differences between two viroporins: p7 of HCV and Vpu of HIV-1. Biochimica et biophysica acta. 2011;1808:554–560. doi: 10.1016/j.bbamem.2010.08.005. [DOI] [PMC free article] [PubMed] [Google Scholar]
- 37.Cook GA, Zhang H, Park SH, Wang Y, Opella SJ. Comparative NMR studies demonstrate profound differences between the viroporins: p7 of HCV and Vpu of HIV-1. Biochimica et Biophysica Acta 1808. 2010:554–560. doi: 10.1016/j.bbamem.2010.08.005. [DOI] [PMC free article] [PubMed] [Google Scholar]
- 38.Howell SC, Mesleh MF, Opella SJ. NMR structure determination of a membrane protein with two transmembrane helices in micelles: MerF of the bacterial mercurry detoxification system. Biochemistry. 2005;44:5196–5206. doi: 10.1021/bi048095v. [DOI] [PubMed] [Google Scholar]
- 39.Sanders CR, Sonnichsen F. Solution NMR of membrane proteins: practice and challenges. Magn Reson Chem S. 2006:24–40. doi: 10.1002/mrc.1816. [DOI] [PubMed] [Google Scholar]
- 40.Poget SF, Girvin ME. Solution NMR of membrane proteins in bilayer mimics: small is beautiful, but sometimes bigger is better. Biochim Biophys Acta. 2007:3098–3106. doi: 10.1016/j.bbamem.2007.09.006. [DOI] [PMC free article] [PubMed] [Google Scholar]
- 41.Page RC, Moore JD, Nguyen HB, Sharma M, Chase R, Gao FP, Mobley CK, Sanders CR, Ma L, Sonnichsen FD, Lee S, Howell SC, Opella SJ, Cross TA. Comprehensive evaluation of solution nuclear magnetic resonance spectroscopy sample preparation for helical integral membrane proteins. Journal of structural and functional genomics. 2006;7:51–64. doi: 10.1007/s10969-006-9009-9. [DOI] [PubMed] [Google Scholar]
- 42.De Angelis AA, Nevzorov AA, Park SH, Howell SC, Mrse AA, Opella SJ. High-resolution NMR spectroscopy of membrane proteins in aligned bicelles. J Am Chem Soc. 2004;126:15340–15341. doi: 10.1021/ja045631y. [DOI] [PubMed] [Google Scholar]
- 43.Cook GA, Opella SJ. Secondary structure, dynamics, and architecture of the p7 membrane protein from hepatitis C virus by NMR spectroscopy. Biochimica et biophysica acta. 2011;1808:1448–1453. doi: 10.1016/j.bbamem.2010.08.010. [DOI] [PMC free article] [PubMed] [Google Scholar]
- 44.Piotto M, Saudek V, Sklenar V. Gradient-tailored excitation for single-quantum NMR spectroscopy of aqueous solution. J Biomol NMR. 1992;2:661–665. doi: 10.1007/BF02192855. [DOI] [PubMed] [Google Scholar]
- 45.Delaglio F, Grzesiek S, Vuister G, Zhu G, Pfeifer J, Bax A. NMRPipe: a multidimeensional spectral processing system based on UNIX pipes. J Biomol NMR. 1995;6:277–293. doi: 10.1007/BF00197809. [DOI] [PubMed] [Google Scholar]
- 46.Pines A, Gibby MG, Waugh JS. Proton-enhanced nuclear induction spectroscopy - method for high-resolution NMR of dilute spins in solids. J Chem Phys. 1972;56:1776–1777. [Google Scholar]