

Summary
The ecological and adaptive significance of plant polyploidization is not well understood and no clear pattern of association between polyploid frequency and environment has emerged. Climatic factors are expected to predict cytotype distribution. However, the relationship between climate, cytotype distribution and variation of abiotic stress tolerance traits has rarely been examined.
Here, we use flow cytometry and root-tip squashes to examine the cytotype distribution in the temperate annual grass Brachypodium distachyon in 57 natural populations distributed across an aridity gradient in the Iberian Peninsula. We further investigate the link between environmental aridity, ploidy, and variation of drought tolerance and drought avoidance (flowering time) traits.
istribution of diploids (2n = 10) and allotetraploids (2n = 30) in this species is geographically structured throughout its range in the Iberian Peninsula, and is associated with aridity gradients. Importantly, after controlling for geographic and altitudinal effects, the link between aridity and polyploidization occurrence persisted. Water use efficiency varied between ploidy levels, with tetraploids being more efficient in the use of water than diploids under water-restricted growing conditions.
Our results indicate that aridity is an important predictor of polyploid occurrence in B. distachyon, suggesting a possible adaptive origin of the cytotype segregation.
Keywords: Brachypodium distachyon, carbon isotope discrimination, cytotype segregation, environmental aridity, flow cytometry, natural variation, ploidy, water use efficiency(WUE)
Introduction
Polyploidy, the addition of whole sets of chromosomes to the genome, is a key process in the evolution of vascular plants (Levin, 2001; Soltis et al., 2004). The origin and magnitude of variation in ploidy level in plants have been studied from different perspectives, including systematics, evolution, reproductive biology, conservation and genetics (recently reviewed in Soltis et al., 2004, 2010; Parisod et al., 2010). However, in contrast to the attention received by the genetic and genomic issues of polyploidization, the ecological and adaptive significance of plant polyploidization remains under-investigated (Soltis et al., 2010).
Numerous studies of spatial distribution of cytotypes of heteroploid species (i.e. species with different ploidy) have documented that polyploids and their lower-ploid progenitors frequently differ in their geographical ranges (reviewed in Levin, 2002; see also e.g. Baack, 2004; Besnard et al., 2008; Kubátová et al., 2008; Balao et al., 2009; Sonnleitner et al., 2010; see however Martin & Husband, 2009). Nonetheless, whether such differences are attributable to adaptive ecological divergence, or arise from nonadaptive ecological processes (e.g. phylogeographical factors and/or dispersal limitation) is still not well understood (Lumaret et al., 1987; Baack & Stanton, 2005; Buggs & Pannell, 2007; Raabová et al., 2008; Duchoslav et al., 2010, see however Ramsey, 2011), and no clear pattern of association between polyploid occurrence and environment has yet emerged (Buggs & Pannell, 2007). A first approach to investigate the ecological and adaptive significance of ploidal shift is to analyze whether ploidy variations across a species distribution are significantly associated with environmental factors that govern plant species range and abundance. In this sense, examining the relationship between within-species ploidy variation and ecogeographical and climatic variables (Husband & Schemske, 1988; Johnson et al., 2003; Sonnleitner et al., 2010) may be particularly insightful. In particular, climatic factors may be important determinants of differential cytotype distribution at large spatial scales (Treier et al., 2009; Parisod et al., 2010). Some findings support these expectations: polyploids often differ from their diploid progenitors in ecophysiological tolerance to abiotic stresses (Levin, 2002; see also Buggs & Pannell, 2007; Maherali et al., 2009), and polyploidy is particularly common in habitats affected by climatic fluctuations and/or under extreme climatic conditions (Brochmann et al., 2004; Parisod et al., 2010 and references therein). However, ascertaining accurately which specific physical habitat variables influence cytotype distribution is challenging (Husband & Schemske, 1998). In addition, the presumed relationship between climate and cytotype spatial distribution has rarely been explored empirically through a direct quantitative evaluation of the correlation between the variation in specific climatic parameters and shifts in the frequency of polyploidization, especially at large scales (but see Treier et al., 2009).
Shift in ploidy level is thought to influence differential stress tolerances (Levin, 2002; see also references cited above), which underlies ecological divergence and adaptation of cytotypes to novel environments (e.g. Ramsey, 2011). If natural variation of stress tolerance mediated by polyploidization is adaptive, then we should expect a significant association among stress tolerance-related traits and cytotype distribution across a particular stress gradient. This prediction holds regardless of whether ecological divergence of diploids and polyploids arises by ploidal increase itself, or due to natural selection operating in polyploid populations. To our knowledge, only one study has previously explored natural variation of abiotic stress tolerance traits in plants from multiple diploid and polyploid populations (Buggs & Pannell, 2007), yet the relationship between such trait variation and the occurrence of polyploidy has not been analyzed across an abiotic stress gradient.
Here, as a part of broader analysis of the ecological and adaptive significance of polyploidy, we use flow cytometry and root-tip squashes to examine the cytotype distribution in the temperate annual grass Brachypodium distachyon (Poaceae) in 57 natural populations distributed across a precipitation and aridity gradient in the Iberian Peninsula. In addition, we analyze the link between environmental aridity, ploidy level variation and natural variation of drought tolerance (i.e. water use efficiency) and drought avoidance (i.e. time to flowering) traits at a regional scale. Throughout its geographical range, B. distachyon shows variation in chromosome number, plants with 2n = 10, 2n = 20, and 2n = 30 chromosomes have been described (Robertson, 1981; Hasterok et al., 2004; Opanowicz et al., 2008), although it is unknown whether such ploidy variation is geographically structured and whether such structure arises in response to environmental cues. We focus here on precipitation, aridity and drought stress tolerance because B. distachyon grows in contrasting habitats which are subjected to marked temporal and spatial variations in precipitation and aridity across the Iberian Peninsula and the Mediterranean Basin (Liancourt & Tielbörger, 2009) and significant natural variation in drought tolerance traits has been recently reported for this plant species (Schwartz et al., 2010; Luo et al., 2011), although the putative role of ploidal shifts in drought tolerance has not been investigated. Specifically, we address the following questions. What is the relative frequency of diploids and polyploids in the Iberian B. distachyon populations? Is the distribution of each cytotype geographically structured? After accounting for spatial-geographic autocorrelation, is the distribution of cytotypes significantly associated with variation in precipitation and/or aridity? And, is variation in water use efficiency and flowering time contingent on variation in ploidy level?
Materials and Methods
Study species
Brachypodium distachyon (L.) P. Beauv., is a temperate annual small grass (10–20 cm) widely distributed across the Mediterranean Basin, Middle and Near East (Catalán & Olmstead, 2000; Opanowicz et al., 2008). In the Iberian Peninsula B. distachyon is wide-spread, although more abundant in the south and east, and less frequent toward north and northwest. It grows in a wide variety of habitats under different climatic and ecological conditions (Supporting Information Table S1), although it is particularly frequent either in altered habitats such as roadsides and/or abandoned fields, and in natural xerophytic meadows and forest edges (Table S1).
B. distachyon has a short life-cycle, although its life span varies remarkably among genotypes from different latitudes and elevations (seed to seed cycle time ranges from 6 to 20 wk under long-day laboratory conditions, with 16 h light : 8 h dark; A. J. Manzaneda, unpublished). B. distachyon is self-compatible (Catalán & Olmstead, 2000) and seed production, maturation and shedding occurs during summer (June–August), but the species may perform either as a winter annual (i.e. germination and seedling emergence occurs, without any latency, between September and November), or as a spring annual (i.e. germination occurs in March–April). Germination studies (A. J. Manzaneda & P. J. Rey, unpublished) show that both winter annuals and spring annuals are present in the Iberian Peninsula, but they are not segregated geographically since, independently of germination phenology, winter annuals are clearly overrepresented in our study sites.
Genetic control of flowering time varies notably between winter-annuals (which require vernalization before flowering) vs spring-annuals (which have no vernalization requirement), and also within the winter-annual and spring-annual groups (Schwartz et al., 2010). In any case, flowering occurs naturally between April and June in the Iberian Peninsula populations.
B. distachyon exhibits variation in somatic chromosome number (2n = 10, 20, 30). Polyploid cytotypes with 20 and 30 chromosomes were initially thought to be tetraploids and hexaploids respectively, originated from a diploid form (2n = 2x =10) by simple multiplication of the same chromosome set (Robertson, 1981). However, detailed comparative cytological analyses using fluorescence in situ hybridization (FISH) revealed an allotetraploid origin of all forms with 2n = 30 (Hasterok et al., 2004). Brachypodium distachyon diploids (2n = 10) may have hybridized with another diploid (2n = 20; formerly thought to be autotetraploids, Robertson 1981) to form the allotetraploid (2n = 30) (see Hasterok et al., 2004; Mur et al., 2011 for more details).
Population sampling and climatic data
In June–July 2008, we located and visited 57 natural populations of B. distachyon across the Iberian Peninsula. The sampled populations cover most of the ranges of distribution, elevation and types of climate and habitat in which this species grows in the region (Table S1, Fig. 1). The two most distant populations were c. 1119 km apart, whereas the two closest populations were 4 km apart. Populations were located using records from the Spanish Plants Information System database (Anthos, 2008). At each population, we collected 20–100 mature seeds from 8 to 20 individual plants chosen randomly within an area of c. 50 × 50 m and separated by at least 1 m from each other. Because diploids and polyploids are indistinguishable in the field, no bias for or against any cytotype is likely in our sample. Seeds were kept in paper envelopes in the laboratory in dark and dry conditions (22°C) until planting.
Fig. 1.
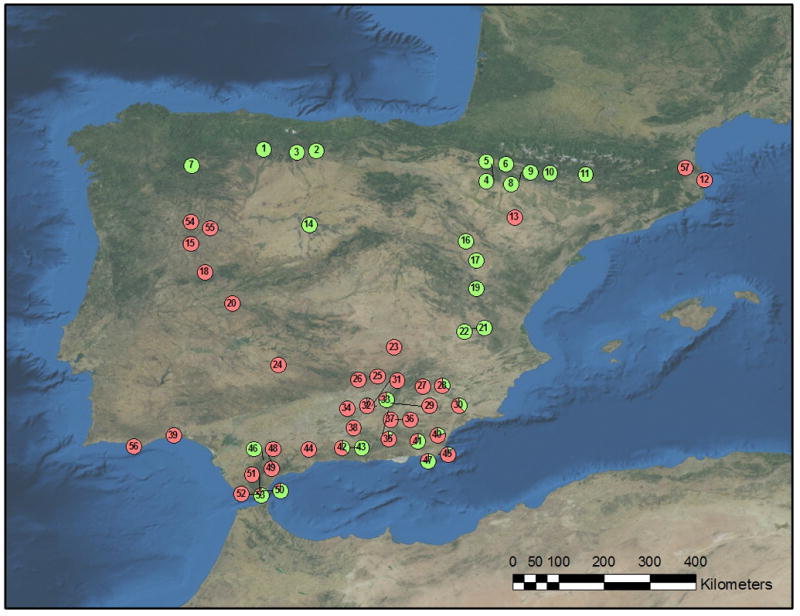
Distribution map of Brachypodium distachyon cytotypes in the Iberian Peninsula and geographical origin of the accessions selected in the study. The numbers refer to localities given in Supporting Information Table S1. The green portion of the pie charts depicts the proportion of diploid (2x) individuals within each population, and the red portion depicts the proportion of tetraploid (4x) individuals. Details on the populations and frequency of polyploids are given in Tables S1 and S2, respectively.
To characterize each population climatically, we retrieved precipitation (average annual precipitation) and temperature (average annual temperature) data from the GIS-based Climatic Digital Atlas from the Iberian Peninsula database (Ninyerola et al., 2005; http://opengis.uab.es/wms/iberia/index.htm). These data have a spatial resolution of 200 m and include the average values for climatic variables for each month from 1950 to 1999. Selected populations differ notably both in average annual precipitation and average annual temperature (Table S1). From these data we estimated an integrated humidity-aridity parameter as the ratio between average annual rainfall and temperature, (R : T ratio hereafter, Table S1). Most of the populations located in the south and south east of the Iberian Peninsula are subjected to an arid or semi-arid Mediterranean climate type, whereas northern populations are located under a humid Eurosiberian climate type (precipitation range: 250–1773 mm; Table S1). A humid or very humid Mediterranean climate type also exists in populations located in the southern mountains and around the Strait of Gibraltar, which constitute a climatic anomaly in south western Europe (Table S1, see Ninyerola et al., 2005 for more details on climate of the Iberian Peninsula).
DNA-ploidy determination
Plants were progressively grown in fall 2008 and during 2009 for flow cytometry screening. We germinated 2–5 seeds per accession (i.e. plant individual lines from our field collection) on moist filter paper in sealed Petri dishes at 4°C for 72 h in dark conditions. Once germinated, seeds were individually planted and grown on standard soil (Fafard 4p mix; Fafard Inc., Agawam, MA, USA) in 48-well flats and maintained in a controlled growth chamber at 21–23 °C under long-day conditions (16 h light : 8 h dark).
We used DAPI flow cytometry on fresh leaves to determine DNA ploidy levels following methods and guidelines as described in Doležel & Bartos (2005) and Suda et al. (2007). Data acquisition and fluorescence peak analyses (i.e. G1 peak means and coefficients of variation, CVs hereafter) were performed using the Flomax® FCM software. We used fresh leaves from the B. distachyon diploid inbred line Bd-21 as an external standard (USDA-ARS NPGS, USA; 2n = 2x =10, C-value = 0.44 pg, Vogel et al., 2006). The instrument was adjusted in channel 65 for localizing the G1 peak of the standard sample. DNA ploidy levels of the samples were then assessed by their mean G1 peak position relative to the G1 standard peak. A minimum of 5000 nuclei were analyzed in each sample, and only peaks with CV ≤ 10% were considered in the analyses. To minimize drift effects, standard peaks were obtained at regular intervals (every 10 sample measurements). Each individual plant was replicated twice for a total of 1274 individual plants from 637 accessions (between 5 and 20 accessions per population; mode = 12, see Table S2 for details on sampling effort).
Relationship between relative DNA content and ploidy
To analyze the relationship between DNA content variation and chromosome number we made chromosome counts on root tips. We germinated seeds from a subsample of 108 accessions from 22 populations (Table S2) on moist filter paper in a sealed Petri dish at a room temperature in dark conditions for 72 h. Once germinated, roots (1–2 cm length) were immersed on ice cold water for 24 h and thereafter fixed using a (3 : 1) ethanol : glacial acetic acid solution for 24 h at a room temperature. Roots were stained using a 1% solution of acetocarmine for 1 h. Before squashing, root tips were softened into a 5% solution of pectinase, 0.2 g of Cellulysin and 0.2 g of Cellulose R-10 in a total volume of 20 ml, and incubated for 2 h at 37°C. Finally, root tips were squashed on a microscope slide in 1% acetocarmine and examined under a microscope.
Measurement of drought tolerance traits
In April 2009 we stratified 288 seeds from 96 different genotypes (A. J. Manzaneda, unpublished data) from 24 populations with distinct ploidy levels (diploids vs tetraploids, involving four genotypes per population, Table S3). Populations were selected in order to maximize natural variation in drought tolerance traits across a significant part of its range in the study region (Fig. 1, Table S3). We minimized potential maternal effects by using seeds from a first generation of self-fertilized, glasshouse-grown plants. Seeds were stratified at 4°C for 1 wk to facilitate uniform seed germination. Plants were grown in 16 h light : 8 h dark at 22°C in 21 cm ‘cone-tainers’ (Stuewe & Sons Inc., OR, USA) in a randomized complete blocks design, with the 96 genotypes replicated in three blocks. To simulate natural dry-down conditions experienced by the plants in the field after precipitation, plants were watered to saturation at the beginning of the experiment, followed by a 9-wk gradual dry-down treatment (see Knight et al., 2006 for a similar procedure). Under this treatment, plants were watered from above (c. 3.8 l per block) just once at the fourth week using a watering can (Fig. S1). Each week we recorded the water content of the soil in the containers at each block (three randomly chosen containers per block) using a volumetric soil moisture TRIME®-PICO-32 probe. From the fourth week, soil moisture in the containers declined to values ranging between 10–25% until the end of the treatment (Fig. S1). At the fifth week, we moved all plants to a cold room (4°C, 16 h light : 8 h dark) for 3 wk to stimulate flowering in those genotypes which had not yet flowered. This laboratory treatment provides an effective simulation of ‘winter’ vernalization because plants perceive vernalization cues only when temperatures are above freezing, rather than the long periods of below-freezing temperatures that occur in the wild. Plants were then moved back to the glasshouse until the end of the experiment.
Plants were checked daily once the first plant flowered (day 29) for the onset of flowering (the number of days from germination until the opening of the first spike). More than 75% of plants had flowered by the ninth week, when we collected one leaf (c. 1.6 mg DW) from each plant for isotope analyses. An indicator of water use efficiency (WUE) integrated over time was determined from the ratio of 13C to 12C (carbon isotope composition, δ13C). δ13C signatures are positively correlated to WUE in C3 plant tissues (Farquhar et al., 1989) and have been used recently to investigate inter-individual WUE variation in heteroploid species (Buggs & Pannell, 2007). Samples were analyzed for δ13C by isotope ratio mass spectrometry at Duke Environmental Stable Isotope Laboratory (http://www.biology.duke.edu/jackson/devil). We express WUE values as carbon isotope discrimination (Δ13C in ‰) since instantaneous measures of Δ13C are straightforward (low Δ13C values indicate high WUE) assuming a mean δ13C signature of atmospheric CO2 of −8.0‰ (see Buggs & Pannell, 2007 for a similar approach).
Data analyses
Independence of geographic distance and cytotype distribution (i.e. between-population Euclidean distance of frequency of polyploids) was tested using a Mantel test (Manly, 1991). The geographic distance matrix was generated by computing the Haversine formula from longitude and latitude data between each population pairwise. Similarly, to investigate the influence of climatic parameters (average annual precipitation and R : T ratio, that is, the ratio between average annual rainfall and temperature) on the frequency of polyploids, accounting for spatial-geographic autocorrelation, we conducted Partial Mantel’s tests (i.e. including a pairwise geographic distance matrix). In this case, separate analyses were performed for precipitation and R : T ratio pairwise distance matrices. Inter-relationships between climatic factors and elevation were detected in our study (Table S4). We attempt to control for such interrelationships by fitting additional Partial Mantel’s tests examining the correlation of polyploidy frequency with precipitation and R : T ratio after controlling for elevation differences. Both Mantel’s and Partial Mantel’s statistics were computed after 10000 permutations performed with the program MantelTester 1.1.
Provided that geographical distance effects were significant (see the Results section), we fitted a binomial multiple regression to further investigate which geographical parameters (latitude, longitude and elevation and their two- and three-way interactions) are correlated with the frequency of polyploids. In this analysis, the frequency of polyploids is estimated from the probability of polyploidy (i.e. the probability of finding a tetraploid cytotype in any population, estimated from the frequency of polyploids/100) given the binomial nature of the frequency of polyploids data distribution. Binomial distribution and logit link function were considered in the model. A Firth bias-corrected maximum likelihood estimator was used to obtain the regression coefficients (Firth, 1993) using JMP 8.0.2 (SAS Institute Inc., Cary, NC, USA).
In addition, we examined the relationship between precipitation, R : T ratio (although both variables are correlated (see Table S4), to some extent, precipitation may be important per se – i.e. without covariation of temperature – for explaining distributional range variations of heteroploid species, e.g. Martin & Husband, 2009) and the frequency of polyploids. Climatic and geographical data entering this analysis were derived from a single principal component analysis (PCA) conducted to obtain orthogonal factors. The rationale for considering climatic and geographic variables in the same PCA is that both types of variables are frequently inter-related. This may mislead conclusions on climatic correlates of polyploid frequency, which is solved with PCA since it generates truly independent linear combination of variables. Independent climatic and geographic factors were achieved through this analysis, since factor loadings correlated significantly with R : T ratio and precipitation on the one hand and with geographical parameters on the other (Table S5). Scores of these two factors and their interaction were subsequently included as independent variables in the binomial regression. Regression coefficients were estimated by Firth bias-corrected maximum likelihood.
To investigate whether carbon isotope discrimination and flowering time vary between ploidy levels, we conducted two separated general linear mixed models with maximum likelihood estimates, using JMP 8.0.2 (SAS Institute Inc.). In these models ploidy was included as a fixed factor, and we considered the influence of population by treating it as a random factor. Flowering time was log-transformed to improve normality and homoscedasticity.
Results
Cytotypes composition and geographical distribution pattern
Flow cytometry analyses revealed the existence of two DNA ploidy levels in our samples (Fig. S2); 40.5% of the analyzed plants were DNA-diploid (median relative DNA content 1C± 1SD: 0.448 ± 0.02, CV = 5.43%), and 59.5% were DNA-tetraploid: 0.827 ± 0.09, CV = 10.79%). Average fluorescence ratio between the diploid line of B. distachyon, used as external standard, and the B. distachyon samples was 1.01 and 1.9 for 2x and 4x cytotypes, respectively (Fig. S3). Chromosome counts performed on 108 plants with different relative DNA content (Table S2) confirmed the presence of just two cytotypes in our samples, which correspond to relative fluorescence values from flow cytometry. Thus, all analyzed DNA-diploids (Table S2) are diploid cytotypes (2n = 2x =10; for simplicity, hereafter ‘diploids’), whereas DNA-tetraploids corresponded to 2n = 4x = 30 allotetraploids (for simplicity, hereafter ‘tetraploids’) (Table S2). Seven plants from the small area with overlapping DNA-ploidy values (Fig. S2) were cytologically checked, and also corresponded to be 2n = 30 allotetraploids (Table S2).
Of the 57 populations sampled, 19 (33.33%) contained only diploid individuals, mainly distributed in the north and east-central areas of the Iberian Peninsula (Fig. 1). Uniformly tetraploid populations occurred in 26 sites (45.61%). Although this cytotype was widely distributed, it was more common in the south and west-central region of the Iberian Peninsula (Fig. 1). Mixed populations of diploid and tetraploid cytotypes, at variable frequency, occurred in 12 sites (21.05%). Distribution of these mixed populations was narrower, and they were located only in the south and south-east of the Iberian Peninsula (Fig. 1).
Dissimilarities in the frequency of polyploids were related significantly to geographical distance between populations (r = 0.21, P < 0.0001), which indicates that nearbypopulations have similar frequencies of polyploids. The frequency of polyploids was significantly associated with the three-way interaction of the geographic variables (Table 1) reflecting complex interactions among longitude, latitude and elevation.
Table 1.
Results of the binomial multiple regression analyzing the relationship between geographical parameters and the frequency of polyploids across 57 Brachypodium distachyon populations in the Iberian Peninsula
| Source | β ± 1SE | df | χ2 | P |
|---|---|---|---|---|
| Latitude | −0.43 ± 0.2 | 1,49 | 9.94 | 0.0016 |
| Longitude | −0.2 ± 0.21 | 1,49 | 4.19 | 0.0406 |
| Elevation | −0.002 ± 0.001 | 1,49 | 16.77 | <0.0001 |
| Latitude × Longitude | −0.12 ± 0.1 | 1,49 | 6.12 | 0.0134 |
| Latitude × Elevation | −0.0013 ± 0.005 | 1,49 | 24.06 | <0.0001 |
| Longitude × Elevation | −0.0001 ± 0.0005 | 1,49 | 15.12 | 0.0001 |
| Latitude × Longitude × Elevation | −0.0003 ± 0.0002 | 1,49 | 18.7 | <0.0001 |
Significant values (P < 0.05) are in bold.
Relationship between polyploidy, precipitation and aridity
Differences in the frequency of polyploids were related significantly to dissimilarities in precipitation after controlling for geographical distance (rM = 0.072, P = 0.0016) or elevation differences (rM = 0.094, P = 0.007). Similarly, differences in the frequency of polyploids were related significantly to dissimilarities in R : T ratio both controlling for geographical distance (rM = 0.16, P < 0.0001) or elevation (rM = 0.2, P < 0.0001). Therefore, the more similar the precipitation and aridity between populations, the more similar is their frequency of polyploids.
The first and second components of the PCA synthesizing the geographic and climatic data accounted for 70.4% of the variation in the data (Table S5). The first component (PC1) is correlated with precipitation and R : T ratio (Table S5). The second component (PC2) indicates geographical variation, because it is associated to latitude and longitude (Table S5). Both PC1 and PC2 showed a significant negative correlation with the frequency of polyploids (Table 2). Thus, increases in PC1 (meaning more humid environment) were associated significantly to decrements in the frequency of polyploids (Fig. 2). Interestingly, such a relationship was independent of geographical variation across our region, as shown by the non-significant interaction between humidity–aridity gradient (PC1) and geographic factor (PC2) (Table 2).
Table 2.
Results of the logistic multiple regression analyzing the variation across 57 Brachypodium distachyon populations of the probability of polyploidy (the probability of finding a tetraploid cytotype in any population, estimated from the frequency of polyploids/100) as a function of PC1 (which is inversely related to aridity), PC2 (a geographic factor) and their interaction
| Source | β ± 1SE | df | χ2 | P |
|---|---|---|---|---|
| PC1 | −0.82 ± 0.31 | 1,56 | 10.13 | 0.0015 |
| PC2 | −0.76 ± 0.34 | 1,56 | 8.74 | 0.0031 |
| PC1 × PC2 | −0.1 ± 0.35 | 1,56 | 2.21 | 0.137 |
Significant values (P < 0.05) are in bold.
Fig. 2.
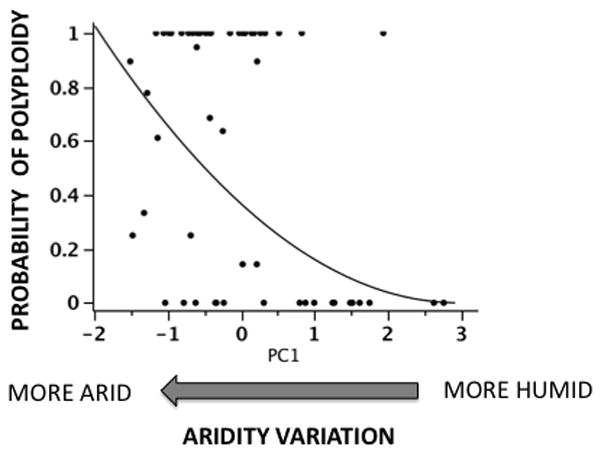
Variation in the probability of polyploidy (the probability of finding a tetraploid cytotype in any population, estimated from the frequency of polyploids/100) as a function of the PC1 factor, (humidity–aridity variation). Higher and positive values in this factor indicate higher precipitation and lower aridity; because it was positively correlated both with precipitation and the rainfall : temperature (R : T) ratio (see the Results section for details). A non-parametric regression (y-square root transformed) was fitted to the data (y = (0.61 − 0.2x) −1/2; F1,56 = 13.66, P = 0.0005; R2 = 0.2).
Ploidy and variation in WUE and flowering time
Carbon isotope discrimination (Δ13C) varied significantly between plants with different ploidy levels (F1,63 = 4.03, P = 0.048). Diploid plants showed significantly higher carbon isotope discrimination than tetraploid plants (Fig. 3). Flowering time ranged between 31–154 d after germination, but it did not differ significantly between diploid and tetraploid plants (57.5 ± 0.09, 52.7 ± 0.09, LSMEANS ± 1SE values for diploid and tetraploids. respectively; F1,170 = 1.11, P = 0.29).
Fig. 3.
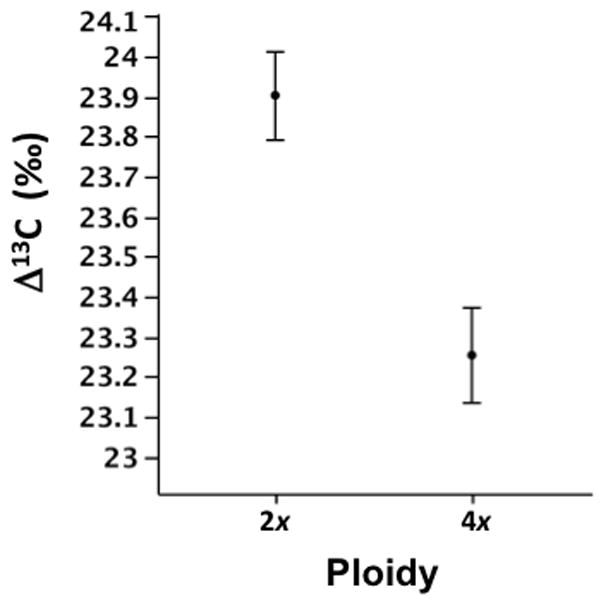
Variation in carbon isotope discrimination (Δ13C) between diploids (2x) and tetraploids (4x) Brachypodium distachyon plants. Values are adjusted LS-MEANS ± 1 SE.
Discussion
Our study shows inter-population variation in the ploidy level of B. distachyon across the Iberian Peninsula. Distribution of diploid and tetraploid cytotypes in this species is geographically structured across this area, and is associated with aridity and annual precipitation gradients. Moreover, after controlling for geographic and altitudinal effects, the link between aridity and polyploid frequency remains significant. Interestingly, an important stress tolerance trait, WUE, varied between ploidy levels in this species, with tetraploids being more efficient in the use of water than diploids under water-restricted growing conditions. As a whole, our results indicate that aridity may have an important influence on the cytotype segregation and polyploid frequency in B. distachyon across the Iberian Peninsula, and suggest that tetraploid cytotypes may better cope with arid conditions through increased tolerance to drought conditions existing in a significant part of the species’ range in the Iberian Peninsula. Our results suggest a possible adaptive origin of the cytotype segregation in the B. distachyon complex, though other non-adaptive explanations cannot be ruled out. Cytotype composition and geographical distribution in the Iberian Peninsula Early karyological studies conducted on material from the Iberian Peninsula and central Europe reported the existence of 2n = 10, 2n = 20, and 2n = 30 cytotypes, with 2n = 30 being most common (Robertson, 1981). Our data indicate that flow-cytometry tetraploids are the most common cytotype in the Iberian Peninsula (c. 60% of the samples analyzed). Such DNA-tetraploids are most likely to be 2n = 30 since all the tetraploids screened had 30 chromosomes (Table S2). Although we did not perform chromosome counts in all of our populations, our results are consistent with findings that most B. distachyon accessions from Eurasia are 2n = 30 allotetraploids (e.g. Wolny et al., 2011). Although we could clearly discriminate diploids from tetraploids (sensu lato) by flow cytometry, the relative fluorescence intensity of allotetraploids was twice as high as diploids, rather than the three-fold expected from chromosome counts. Such disparity between karyological and fluorescence data has been reported in some studies (Vogel et al., 2006; Shang et al., 2011) and may suggest that polyploidization was followed by loss of genetic material, a widespread phenomenon in the grass family (Levy & Felman, 2002). On the other hand, we did not find any triploid intermediate cytotypes, although we detected several mixed populations of diploids and tetraploids. This may reflect pre-zygotic reproductive isolation between the two cytotypes, and/or a low fertility and viability of triploids within these populations (e.g. Husband & Schemske, 1998; Baack, 2005).
Our results show that B. distachyon diploid and tetraploid cytotypes are spatially segregated at a regional scale. Thus, although cytotype co-occurrence and mixed populations of diploids and tetraploids exist within the Iberian Peninsula, most populations contain only a single cytotype (c. 80% of the sampled populations consist of either diploids or tetraploids). Diploids are the most common cytotype in the east and north of the Iberian Peninsula, whereas in the south they are either restricted to montane areas at mid or high elevations, or in populations located near the coast (Fig. 1). By contrast, tetraploids are the most frequent cytotype in the south and west of the Iberian Peninsula at low- to mid-elevations, becoming scarcer in the east and north, where they are found primarily at low elevation (Fig. 1). Geographical segregation between diploids and auto- and allopolyploids has been described repeatedly in many species (e.g. Husband & Schemske, 1998; Baack, 2004; see also Levin, 2002 and references therein), including grasses (e.g. Keeler, 1990; see also Gibson, 2009).
We detected two contact zones of cytotype coexistence in the Iberian Peninsula, one located at the Strait of Gibraltar, and the other in the southeast (Fig. 1). These two contact zones differ from each other in the relative frequency of diploids and tetraploids present in each population. Mixed populations near the Strait of Gibraltar had a majority of diploids. On the contrary, in the south-eastern mixed populations, tetraploids and diploids were intermingled, with tetraploids a majority in seven out of 10 populations (Table S2). The existence of contact zones in auto- and allopolyploid complexes seems common, and also has been documented in grasses (reviewed by Petit et al., 1999), and more recently also described in some B. distachyon populations in NE Spain (Mur et al., 2011). Presently, the factors influencing the origin and maintenance of cytotype frequency in these contact zones remain unclear. Experiments to investigate the population dynamics of both cytotypes, habitat differentiation and genotypic selection patterns of diploids and tetraploids under different ecological conditions are ongoing.
Aridity correlates with cytotype distribution through differences in drought tolerance
Divergence in ecological tolerance between polyploids and their diploid ancestors may promote habitat differentiation and spatial separation of cytotypes (Levin, 2002). Our results are consistent with the hypothesis of an adaptive factor in the origin of the geographical separation of the B. distachyon cytotypes in the Iberian Peninsula. This support is based on two major findings from this study. First, we found a link between aridity and the frequency of polyploids, with more mesic sites having lower frequencies of tetraploids. Importantly, the association between ploidy variation and aridity and/or precipitation was independent of geographic or altitudinal effects, suggesting that ploidy variation of B. distachyon responds in a large extent to climatic cues. Second, cytotypes differed significantly in their tolerance to drought. Thus, under water-restricted growing conditions, tetraploids were significantly more efficient in their water usage (i.e. lower carbon isotope discrimination) than diploids. The relationship between aridity and ploidy variation has been previously presupposed (e.g. Keeler, 1990) or inferred from other ecological correlates of environmental aridity (e.g. Lumaret et al., 1987). Our findings provide functional and quantitative evidence for such positive association at large spatial scales (see also Treier et al., 2009; Duchoslav et al., 2010). Similarly, our results agree with some previous studies which report that polyploids have higher drought tolerance than diploids (reviewed by Levin, 2002, see also Maherali et al., 2009; but see Buggs & Pannell, 2007), and suggest that divergence in drought tolerance traits between cytotypes is a probable mechanism for segregation of cytotypes across the aridity gradients of the Iberian Peninsula.
Physiological mechanisms underlying the superior drought tolerance of tetraploids go beyond the scope of this work, and will receive more attention in future studies. However, noticeably, divergence in tolerance between cytotypes came from differences in WUE (i.e. dehydration avoidance, Knight et al., 2003), rather than from differences in flowering time (i.e. drought escape). Differences in WUE have previously been shown to underlie habitat differentiation between conspecific or congeneric taxa (e.g. Heschel et al., 2002, Savage & Cavender-Bares, 2011), but seldom have been linked to variation in ploidy (but see Buggs & Pannell, 2007). Because WUE measurements were obtained from carbon isotope discrimination values, which essentially reflect tradeoffs between transpiration and carbon fixation (e.g. Knight et al., 2003), these differences probably arise from differences in the stomatal apparatus (i.e. density, size and distribution of the leaf stomata), and/or are related to the hydraulic conductivity. Both are known ecophysiological consequences of ploidy changes (e.g. Lumaret et al., 1987; Li et al., 1996; Buggs & Pannell, 2007; Maherali et al., 2009).
A question raised by this study is whether the differences between cytotypes in drought tolerance result from genome duplication itself, past interspecific hybridization (Otto, 2007), and/or evolved selectively after polyploidization (Maherali et al., 2009; Ramsey, 2011). It seems likely that tetraploids have a hybrid origin, hence ecogeographical differences and divergence in drought tolerance-related traits may reflect not only effects of ploidal change, but also effects of fixed heterozygosity, genetic novelty due to intergenomic recombination, or genetic differences among parental species (Levin, 2002). Future work combining synthetic newly-synthesized allo- and autotetraploids, examination of natural variation across genotypes with different ploidy level, and selection experiments in wild populations will help to answer this question.
Concluding remarks
Though our results agree with the hypothesis of an adaptive origin of cytotype geographic divergence (i.e. divergence in ecological tolerances between diploids and tetraploids), non-adaptive hypothesis for the cytotype distribution exist which have not been ruled out here. First, historical factors and dispersal limitation could contribute to the segregation of diploids and tetraploids (Baack, 2004). Thus, tetraploids may have colonized areas which became available due to post-Pleistocene warming, or after human-induced alterations (e.g. deforestation, fires or agricultural use). The cytotype pattern described here might then reflect the location of earlier cytotype refugia from which colonization by single cytotypes eventually occurred (see Duchoslav et al., 2010 and references therein). Some arguments consistent with these historical hypotheses are that part of the diploid distribution of B. distachyon is disjunct in glaciated areas of the Iberian Peninsula (Pyrenees along northern mountains, and Betic mountains in the south, Fig. 1), whereas tetraploids occur in southern and western glacial refugia. Furthermore, B. distachyon allopolyploids may have a superior colonizing ability, in accordance with their widespread Eurasian distribution. Finally, long-distance seed dispersal events seem to play a significant role in the genetic population structure of B. distachyon at some zones of its geographical distribution (Vogel et al., 2009). Second, minority cytotype exclusion (i.e. rare cytotypes will face reduced fitness in mixed populations if reproductive success is frequency-dependent) can lead to spatial segregation of cytotypes (e.g. Levin, 2002; Baack, 2004), even if successful self-pollination occurs in polyploids (Buggs & Pannell, 2006)
Our current data are not conclusive in discriminating between these and the adaptive hypothesis. Future work should address demographic aspects (with emphasis on dispersal) of natural populations of each cytotype, along with population genetic studies, to assess the role of demographic and historical factors in the geographical segregation of B. distachyon cytotypes in the Iberian Peninsula.
Supplementary Material
Fig. S1 Soil moisture variation during the drought tolerance experiment.
Fig. S2 Frequency distribution of relative DNA content (pg) obtained from the screening of 1274 individual plants from 637 Brachypodium distachyon accessions collected in 57 populations across the Iberian Peninsula.
Fig. S3 Simultaneus flow cytometry analysis of DAPI-stained nuclei isolated from diploid and tetraploid plants.
Table S1 Localities and geographical coordinates of the 57 Brachypodium distachyon populations across the Iberian Peninsula used in this study
Table S2 Ploidy level variation among 637 Brachypodium distachyon accessions collected from 57 populations in the Iberian Peninsula
Table S3 Location and geographical provenance of the 96 genotypes used in the assessment of the variation in water use efficiency and flowering time among 24 natural Brachypodium distachyon populations across the Iberian Peninsula
Table S4 Spearman’s correlation coefficients among the geographical and climate parameters considered in this study
Table S5 Principal components analysis conducted on two climatic and three geographical parameters of 57 Brachypodium distachyon populations across the Iberian Peninsula
Acknowledgments
We thank three anonymous reviewers for valuable comments on the manuscript. We also thank Kathy Springer, Cheng-Ruei Lee, Jen Modliszewski, Slater Hurst, Jessica Lutkenhaus, José Manzaneda, Rafa Jaime and the Duke Greenhouse staff for technical assistance. We are also in debt to Jon Karr and the Duke Environmental Stable Isotope Laboratory staff for the isotope analyses. We thank Robert Hasterok for advice regarding polyploid origins in our samples, and to Pilar Catalán for helpful discussion. This project was funded by the European Commission through a Marie Curie Action awarded to A.J.M. and P.J.R. (PIOF-GA-2008-220983). T.M.O. was funded by the National Science Foundation (award EF-0723447) and the National Institutes of Health (award R01 GM086496).
References
- Anthos. Information system of the plants of Spain. Real Jardín Botánico, CSIC – Fundacion Biodiversidad. 2008 URL: www.anthos.es.
- Baack EJ. Cytotype segregation on regional and microgeographic scales in snow buttercups (Ranunculus adoneus: Ranunculaceae) American Journal of Botany. 2004;91:1783–1788. doi: 10.3732/ajb.91.11.1783. [DOI] [PubMed] [Google Scholar]
- Baack EJ. Ecological factors influencing tetraploid establishment in snow buttercups (Ranunculus adoneus, Ranunculaceae): minority cytotype exclusion and barriers to triploid formation. American Journal of Botany. 2005;92:1827–1835. doi: 10.3732/ajb.92.11.1827. [DOI] [PubMed] [Google Scholar]
- Baack EJ, Stanton ML. Ecological factors influencing tetraploid speciation in snow buttercups (Ranunculus adoneus): niche differentiation and tetraploid establishment. Evolution. 2005;59:1936–1944. [PubMed] [Google Scholar]
- Balao F, Casimiro-Soriguer R, Talavera M, Herrera J, Talavera S. Distribution and diversity of cytotypes in Dianthus broteri as evidenced by genome size variations. Annals of Botany. 2009;104:965–973. doi: 10.1093/aob/mcp182. [DOI] [PMC free article] [PubMed] [Google Scholar]
- Besnard G, García-Verdugo C, Rubio de Casas R. Polyploidy in the olive (Olea europaea): evidence from flow cytometry and nuclear microsatellite analyses. Annals of Botany. 2008;101:25–30. doi: 10.1093/aob/mcm275. [DOI] [PMC free article] [PubMed] [Google Scholar]
- Brochmann C, Brysting AK, Alsos IG, Borgen L, Grundt HH, Scheen AC, Elven R. Polyploidy in arctic plants. Biological Journal of the Linnean Society. 2004;82:521–536. [Google Scholar]
- Buggs RJA, Pannell JR. Rapid displacement of a monoecious plant lineage is due to pollen swamping by a dioecious relative. Current Biology. 2006;16:996–1000. doi: 10.1016/j.cub.2006.03.093. [DOI] [PubMed] [Google Scholar]
- Buggs RJA, Pannell JR. Ecological differentiation and diploid superiority across a moving ploidy contact zone. Evolution. 2007;61:125–140. doi: 10.1111/j.1558-5646.2007.00010.x. [DOI] [PubMed] [Google Scholar]
- Catalán P, Olmstead RG. Phylogenetic reconstruction of the genus Brachypodium P. Beauv. (Poaceae) from combined sequences of chloroplast ndhF gene and nuclear ITS. Plant Systematics and Evolution. 2000;220:1–19. [Google Scholar]
- Doležel J, Bartos J. Plant DNA flow cytometry and estimation of nuclear genome size. Annals of Botany. 2005;95:99–110. doi: 10.1093/aob/mci005. [DOI] [PMC free article] [PubMed] [Google Scholar]
- Duchoslav M, Šafářová L, Krahulec F. Complex distribution patterns, ecology and coexistence of ploidy levels of Allium oleraceum (Alliaceae) in the Czech Republic. Annals of Botany. 2010;105:719–735. doi: 10.1093/aob/mcq035. [DOI] [PMC free article] [PubMed] [Google Scholar]
- Farquhar GD, Ehleringer JR, Hubick KT. Carbon isotope discrimination and photosynthesis. Annual Review of Plant Physiology and Plant Molecular Biology. 1989;40:503–537. [Google Scholar]
- Firth D. Bias reduction of maximum likelihood estimates. Biometrika. 1993;80:27–38. [Google Scholar]
- Gibson DJ. Grasses and grassland ecology. New York, USA: Oxford University Press; 2009. [Google Scholar]
- Hasterok R, Draper J, Jenkins G. Laying the cytotaxonomic foundations of a new model grass, Brachypodium distachyon (L.) Beauv. Chromosome Research. 2004;12:397–403. doi: 10.1023/B:CHRO.0000034130.35983.99. [DOI] [PubMed] [Google Scholar]
- Heschel MS, Donohue K, Hausmann N, Schmitt J. Population differences and natural selection for water-use efficiency in Impatiens capensis (Balsaminaceae) International Journal of Plant Science. 2002;163:907–912. [Google Scholar]
- Husband BC, Schemske DW. Cytotype distribution at a diploid–tetraploid contact zone in Chamerion (Epilobium) angustifolium (Onagracae) American Journal of Botany. 1998;85:1688–1694. [PubMed] [Google Scholar]
- Johnson MTJ, Husband BC, Burton TL. Habitat differentiation between diploid and tetraploid Galax urceolata (Diapensiaceae) International Journal of Plant Science. 2003;164:703–710. [Google Scholar]
- Keeler KH. Distribution of polyploid variation in big bluestem (Andropogon gerardii, Poaceae) across the tallgrass prairie region. Genome. 1990;33:95–100. [Google Scholar]
- Knight CA, Vogel H, Kroymann J, Shumate A, Witsenboer H, Mitchell-Olds T. Expression profiling and local adaptation of Boechera holboelli populations for water use efficiency across a naturally occurring water stress gradient. Molecular Ecology. 2006;15:1229–1237. doi: 10.1111/j.1365-294X.2006.02818.x. [DOI] [PubMed] [Google Scholar]
- Kubátová B, Travnicek P, Bastlova D, Curn V, Jarolımova V, Suda J. DNA ploidy-level variation in native and invasive populations of Lythrum salicaria at a large geographical scale. Journal of Biogeography. 2008;35:167–176. [Google Scholar]
- Levin DA. 50 years of plant speciation. Taxon. 2001;50:69–91. [Google Scholar]
- Levin DA. The role of chromosomal change in plant evolution. New York, USA: Oxford University Press; 2002. [Google Scholar]
- Levy AA, Feldman M. The impact of polyploidy on grass genome evolution. Plant Physiology. 2002;130:1587–1593. doi: 10.1104/pp.015727. [DOI] [PMC free article] [PubMed] [Google Scholar]
- Liancourt P, Tielbörger K. Competition and a short growing season lead to ecotypic differentiation at the two extremes of the ecological range. Functional Ecology. 2009;23:397–404. [Google Scholar]
- Lumaret R, Guillerm J-L, Delay J, Ait Lhaj Loutfi A, Izco J, Jay M. Polyploidy and habitat differentiation in Dactylis glomerata L. from Galicia (Spain) Oecologia. 1987;73:436–446. doi: 10.1007/BF00385262. [DOI] [PubMed] [Google Scholar]
- Luo N, Liu J, Yub X, Jiang Y. Natural variation of drought response in Brachypodium distachyon. Physiologia Plantarum. 2011;141:19–29. doi: 10.1111/j.1399-3054.2010.01413.x. [DOI] [PubMed] [Google Scholar]
- Maherali H, Walden AE, Husband BC. Genome duplication and the evolution of physiological responses to water stress. New Phytologist. 2009;184:721–731. doi: 10.1111/j.1469-8137.2009.02997.x. [DOI] [PubMed] [Google Scholar]
- Manly BFJ. Randomization and Monte Carlo methods in biology. London, UK & New York, USA: Chapman and Hall; 1991. [Google Scholar]
- Martin SL, Husband BC. Influence of phylogeny and ploidy on species ranges of North American angiosperms. Journal of Ecology. 2009;97:913–922. [Google Scholar]
- McKay JK, Richards JH, Mitchell-Olds T. Genetics of drought adaptation in Arabidopsis thaliana: I. Pleitropy contributes to genetic correlations among ecological traits. Molecular Ecology. 2003;12:1137–1151. doi: 10.1046/j.1365-294x.2003.01833.x. [DOI] [PubMed] [Google Scholar]
- Mur LAJ, Allainguillaume J, Catalán P, Hasterok R, Jenkins G, Lesniewska K, Thomas I, Vogel JP. Exploiting the Brachypodium tool box in cereal and grass research. New Phytologist. 2011;191:334–347. doi: 10.1111/j.1469-8137.2011.03748.x. [DOI] [PubMed] [Google Scholar]
- Ninyerola M, Pons X, Roure JM. Metodología y aplicaciones en bioclimatología y geobotánica. Universidad Autónoma de Barcelona; Bellaterra, Spain: 2005. Atlas Climático Digital de la Península Ibérica. URL: http://opengis.uab.es/wms/iberia/index.htm. [Google Scholar]
- Opanowicz M, Vain P, Draper J, Parker D, Doonan JH. Brachypodium distachyon: making hay with a wild grass. Trends in Plant Science. 2008;13:172–177. doi: 10.1016/j.tplants.2008.01.007. [DOI] [PubMed] [Google Scholar]
- Otto SP. The evolutionary consequences of polyploidy. Cell. 2007;131:452–462. doi: 10.1016/j.cell.2007.10.022. [DOI] [PubMed] [Google Scholar]
- Parisod C, Holderegger R, Brochmann C. Evolutionary consequences of autopolyploidy. New Phytologist. 2010;186:5–17. doi: 10.1111/j.1469-8137.2009.03142.x. [DOI] [PubMed] [Google Scholar]
- Petit C, Bretagnolle F, Felber F. Evolutionary consequences of diploid-polyploid hybrid zones in wild species. Trends in Ecology and Evolution. 1999;14:306–311. doi: 10.1016/s0169-5347(99)01608-0. [DOI] [PubMed] [Google Scholar]
- Raabová J, Fischer M, Munzbergová Z. Niche differentiation between diploid and hexaploid Aster amellus. Oecologia. 2008;158:463–472. doi: 10.1007/s00442-008-1156-1. [DOI] [PubMed] [Google Scholar]
- Ramsey J. Polyploidy and ecological adaptation in wild yarrow. Proceedings of the National Academy of Sciences, USA. 2011;108:7096–7101. doi: 10.1073/pnas.1016631108. [DOI] [PMC free article] [PubMed] [Google Scholar]
- Robertson IH. Chromosome numbers in Brachypodium Beauv. (Gramineae) Genetica. 1981;56:55–60. [Google Scholar]
- Savage JA, Cavender-Bares JM. Contrasting drought survival strategies of sympatric willows (genus: Salix): consequences for coexistence and habitat specialization. Tree Physiology. 2011;31:604–614. doi: 10.1093/treephys/tpr056. [DOI] [PubMed] [Google Scholar]
- Shang Y, Ma L, Wang H, Feng W, Chen P, Cao X, Liu D, Wang X-E. The evolutionary history of PDR in Brachypodium distachyon polyploids. Molecular Biology Reports. 2011;38:2211–2217. doi: 10.1007/s11033-010-0350-5. [DOI] [PubMed] [Google Scholar]
- Schwartz CJ, Doyle MR, Manzaneda AJ, Rey PJ, Mitchell-Olds T, Amasino RM. Natural variation of flowering time and vernalization responsiveness in Brachypodium distachyon. Bioenergy Research. 2010;3:38–46. [Google Scholar]
- Soltis DE, Buggs RJA, Doyle JJ, Soltis PS. What we still don’t know about polyploidy. Taxon. 2010;59:1387–1403. [Google Scholar]
- Soltis DE, Soltis PS, Tate JA. Advances in the study of polyploidy since Plant Speciation. New Phytologist. 2004;161:173–191. [Google Scholar]
- Sonnleitner M, Flatscher R, Escobar García P, Rauchová J, Suda J, Schneeweiss GM, Hülber K, Schönswetter P. Distribution and habitat segregation on different spatial scales among diploid, tetraploid and hexaploid cytotypes of Senecio carniolicus (Asteraceae) in the Eastern Alps. Annals of Botany. 2010;106:967–977. doi: 10.1093/aob/mcq192. [DOI] [PMC free article] [PubMed] [Google Scholar]
- Suda J, Kron P, Husband BC, Trávnícek P. Flow cytometry and ploidy: applications in plant systematic, ecology and evolutionary biology. In: Doležel J, Greilhuber J, Suda J, editors. Flow cytometry with plant cells. Weinheim, Germany: Wiley-VCH; 2007. pp. 103–130. [Google Scholar]
- Treier UA, Broennimann O, Normand S, Guisan A, Schaffner U, Steinger T, Müller-Schärer H. Shift in cytotype frequency and niche space in the invasive plant Centaurea maculosa. Ecology. 2009;90:1366–1377. doi: 10.1890/08-0420.1. [DOI] [PubMed] [Google Scholar]
- Vogel JP, Garvin DF, Leong OM, Hayden DM. Agrobacterium-mediated transformation and inbred line development in the model grass Brachypodium distachyon. Plant Cell, Tissue and Organ Culture. 2006;84:199–211. [Google Scholar]
- Vogel JP, Tuna M, Budak H, Huo N, Gu YQ, Steinwand MA. Development of SSR markers and analysis of diversity in Turkish populations of Brachypodium distachyon. BMC Plant Biology. 2009;9:88. doi: 10.1186/1471-2229-9-88. [DOI] [PMC free article] [PubMed] [Google Scholar]
- Wolny E, Lesniewska K, Hasterok R, Langdon T. Compact genomes and complex evolution in the genus Brachypodium. Chromosoma. 2011;120:199–212. doi: 10.1007/s00412-010-0303-8. [DOI] [PubMed] [Google Scholar]
Associated Data
This section collects any data citations, data availability statements, or supplementary materials included in this article.
Supplementary Materials
Fig. S1 Soil moisture variation during the drought tolerance experiment.
Fig. S2 Frequency distribution of relative DNA content (pg) obtained from the screening of 1274 individual plants from 637 Brachypodium distachyon accessions collected in 57 populations across the Iberian Peninsula.
Fig. S3 Simultaneus flow cytometry analysis of DAPI-stained nuclei isolated from diploid and tetraploid plants.
Table S1 Localities and geographical coordinates of the 57 Brachypodium distachyon populations across the Iberian Peninsula used in this study
Table S2 Ploidy level variation among 637 Brachypodium distachyon accessions collected from 57 populations in the Iberian Peninsula
Table S3 Location and geographical provenance of the 96 genotypes used in the assessment of the variation in water use efficiency and flowering time among 24 natural Brachypodium distachyon populations across the Iberian Peninsula
Table S4 Spearman’s correlation coefficients among the geographical and climate parameters considered in this study
Table S5 Principal components analysis conducted on two climatic and three geographical parameters of 57 Brachypodium distachyon populations across the Iberian Peninsula