Abstract
Three different techniques (adiabatic passage Hartman-Hahn cross-polarization, optimal control designed pulses, and EXPORT) are compared for transferring 15N magnetization to 13C in solid-state NMR experiments under magic-angle-spinning conditions. We demonstrate that, in comparison to adiabatic passage Hartman-Hahn cross-polarization, optimal control transfer pulses achieve similar or better transfer efficiencies for uniformly-13C,15N labelled samples and are generally superior for samples with non-uniform labeling schemes (such as 1,3- and 2-13C glycerol labeling). In addition, the optimal control pulses typically use substantially lower average RF field strengths and are more robust with respect to experimental variation and RF inhomogeneity. Consequently, they are better suited for demanding samples.
Keywords: dipolar recoupling, NCO, NCA, optimal control
1. Introduction
The efficient transfer of magnetization from amide nitrogens (N) to alpha (Cα) or carbonyl (Co) carbons is essential for a variety of biological NMR experiments. For solid-state samples under magic-angle-spinning (MAS) conditions, this transfer can be carried out by recoupling the dipolar interaction using techniques such as double cross-polarization (DCP) and its variants[1–5], symmetry-based recoupling[6–8], pulses designed using optimal control (OC)[9,10], or multiple-oscillating field techniques such as EXPORT[11].
Despite the variety of sequences that can be used for N to Cα (NCA) and N to Co (NCO) magnetization transfer, the current standard sequence used in most laboratories is the adiabatic passage Hartmann-Hahn cross-polarization experiment[3] (which we refer to in the following as adiabatic DCP). In adiabatic DCP, the amplitude of one RF channel is held constant while the amplitude of the other channel is adiabatically modulated. This sequence has the advantage that complete magnetization transfer is theoretically possible (i.e., a transfer efficiency of 100%) but has the disadvantages of demanding a relatively long duration of strong RF irradiation and a relatively narrow match condition for the RF amplitude. Consequently, the performance of adiabatic DCP is quite sensitive to calibration, the homogeneity of the RF field, and the stability of the instrument. In practice, signal loss due to relaxation as well as RF heating of the sample limits the length of the cross-polarization period and, therefore, the experimental transfer efficiency.
In this paper, we compare the NCA and NCO transfer efficiencies for adiabatic DCP with two more recently introduced magnetization transfer methods: transfer pulses designed using optimal control transfer pulses (OCDCP)[9,10] and the EXPORT sequence[11]. Optimal control theory[14,15] is an efficient method for simultaneously optimizing hundreds, or even thousands, of variables to maximize a desired outcome. In the context of NMR spectroscopy, the variables are usually the amplitudes and phases of the RF field, and the outcome is the transfer efficiency from one state to another[16]. The main strength of optimal control is that all of the variables are adjusted in each iteration of the calculation, thereby making it possible for a calculation with a huge number of variables to converge in a reasonable amount of computation time.
The EXPORT sequence is a recent development in 15N-13C transfer methods[11], which, under certain conditions, is able to transfer magnetization without the need for simultaneous 1H decoupling. Whereas magnetization is spin-locked in an adiabatic DCP transfer, in an EXPORT transfer the magnetization is predominantly perpendicular to the RF field. The conditions under which it is possible to use EXPORT without decoupling are quite demanding for the 13C and 15N channels, but it is also possible to use lower-power match conditions (along with simultaneous 1H decoupling) for NCA and NCO transfers, which will be the variant explored in this paper.
In the following, we will show that under the conditions investigated, adiabatic DCP and OCDCP tend to have similar efficiencies for 15N-13C transfers for uniformly-labeled samples. For samples with non-uniform labeling (such as 1,3-and 2-13C glycerol labeling), OCDCP has significantly higher transfer efficiencies than adiabatic DCP. In all cases OCDCP has the advantages of being more tolerant of inhomogeneities of the RF field, being less sensitive to calibration, and requiring less RF power than the other two methods.
2. Experimental
2.1. Simulations
All simulations were performed using SIMPSON 3.0.1[12,13]. The source code and compiled binaries for this program are freely available for download at http://www.bionmr.chem.au.dk/bionmr/software/simpson.php. The simulations used 20 REPULSION[17] α, β crystallite angles and 5 γ angles for powder averaging. Calculations with larger sets of crystallites produced results that were essentially the same but at the expense of increased computation time.
2.2. Adiabatic DCP
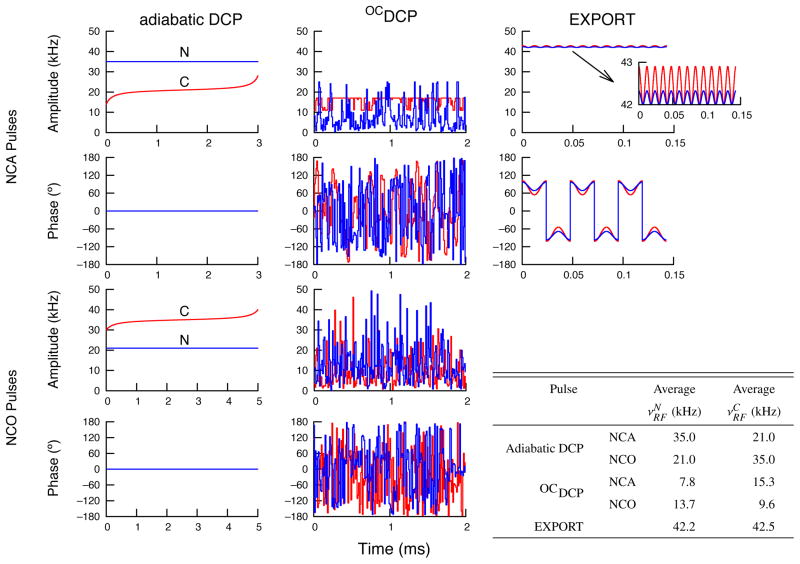
Adiabatic passage Hartman-Hahn cross-polarization (adiabatic DCP) was performed using a constant RF amplitude for the 15N channel ( ) and an adiabatic amplitude ramp for the 13C channel ( ). The match condition for Hartman-Hahn transfer under magic-angle spinning conditions is that the amplitudes of the two RF fields differ by one or two times the spinning frequency. In practice, we usually set the RF amplitudes to be half-integer multiples of the spinning frequency in order to avoid hitting R3 conditions. For NCA transfers, the match condition was used (where νr is the spinning frequency in Hz). In the experiments presented, νr=14 kHz so the corresponding average RF field strengths were 35 kHz for 15N and 21 kHz for 13C. Experimentally, we found that the optimal adiabatic DCP length for NCA transfers was between 4 and 5 ms for our samples.
For NCO experiments, the match condition was used, which we found for our samples to have a higher experimental transfer efficiency than the more typical NCO match condition. The corresponding average RF field strengths were 21 kHz for 15N and 35 kHz for 13C. For the samples investigated, the transfer efficiency tended to plateau for cross-polarization periods longer than 5 ms.
Other match conditions were investigated for both NCA and NCO transfers, but these had lower experimental transfer efficiencies. The pulse shapes used for adiabatic DCP are illustrated in the first column of Figure 1. For simulations, the same NCA match condition was used as in our experiments ( ) but for simulations of NCO transfers the condition was used as this match condition has better theoretical performance.
Figure 1.
Amplitude and phase profiles for the 15N-13C transfer pulses used in this paper for experiments at 700 MHz for 1H with νr=14 kHz. The inset table provides the average RF amplitude (in kHz) for each channel of each pulse. Data are shown in blue for the 15N channel and in red for the 13C channel. Adiabatic DCP is only amplitude modulated (phase is set to 0° for both channels). For EXPORT, the same sequence is used for both NCA and NCO transfers with only a change in the carrier frequency. In addition, for EXPORT only the basic building block (which is two rotor cycles long) is shown; the number of times that this block was repeated was experimentally optimized for each sample to maximize transfer efficiency.
The pulse shapes used for adiabatic DCP along with the parameters used to generate them are provided with the supplementary materials.
2.3. OCDCP
We generated optimal control transfer pulses using the optimal control procedures[12] included in SIMPSON 3.0.1[13]. As with the simulations, the optimizations used 20 REPULSION α, β crystallite angles and 5 γ angles for powder averaging. Although it is possible to generate OCDCP pulses including all of the parameters to be optimized from the start of the calculation, we found that the optimizations were less time consuming if broken into a series of steps. Typically, the optimal control pulses were calculated in three or four steps, where the best pulses from each step were used as input for the subsequent step of the calculation. The parameters included in each step of the calculation were:
A narrow-band optimization for 15N to 13C transfer. The tensor values for the nuclear spin interactions are given in Table 1[10] and the isotropic chemical shifts were set to 0 (i.e., all pulses are designed to work with the transmitter on resonance with the relevant nuclei).
Chemical shift offsets were added to ensure transfer over the desired chemical shift range (four points over 40 ppm for N, five points over 25 ppm for Cα, three points over 15 ppm for Co).
An RF inhomogeneity profile was added. The profile used was a 8% Gaussian (full-width-half-height for the RF profile relative to the nominal RF field strength) with five points for each channel (0.9, 0.95, 1.0, 1.05, and 1.1 times the nominal field strength).
For NCA transfers, two CSA values (δaniso=−20, 20 ppm) and two asymmetry values (η=0.4, 0.9) were used in the optimization.
Table 1.
Chemical shielding, J, and dipolar coupling tensor values used for OC pulse design and simulations. Definitions of parameters can be found in Bak et al.[18].
| Nucleus | CSA (δaniso) | Asymmetry (η) | Euler Angles | ||
|---|---|---|---|---|---|
| αPC | βPC | γPC | |||
| N | 99 ppm | 0.19 | −90° | −90° | 17° |
| Cα | −20 ppm | 0.43 | 90° | 90° | 0° |
| Co | −76 ppm | 0.90 | 0° | 0° | 94° |
| Interaction | Coupling Constant | Euler Angles | ||
|---|---|---|---|---|
| α PC | β PC | γ PC | ||
| NCα Dipolar (b/2π) | 890 Hz | 90° | 115:3° | 0° |
| NCo Dipolar (b/2π) | 1176 Hz | 0° | 90° | 57° |
| NCα Scalar (J) | −11 Hz | |||
| NCo Scalar (J) | −15 Hz | |||
The overall pulse length, the length of the steps within the pulse, the spinning frequency, and the magnetic field all need to be specified at the beginning of the calculation. Overall pulse lengths between 1 and 5 ms were investigated. In all cases, the time steps within the pulses were set to 10 μs (so, for example, a 2 ms pulse consists of 200 elements for each channel). Pulses were calculated for a spinning frequency of 12 kHz with a 14.1 T magnetic field (600 MHz for 1H) or with a spinning frequency of 14 kHz with a 16.4 T magnetic field (700 MHz for 1H). Only data for the 700 MHz pulses are shown, as the performance of the 600 MHz pulses was similar. Shape files for both spinning frequencies/fields are provided in the supplementary information as well as at http://lclark.edu/~loening/pulses.html. Although the pulses were designed to transfer magnetization from 15N (initial operator: Ix) to 13C (destination operator: Sx), the opposite transfer (from 13C to 15N) can be performed simply by time-reversing the pulses. The transfer efficiencies of the reversed pulses are typically within 10% of the original transfer efficiencies.
Typically, five to ten OCDCP pulses were calculated for each set of conditions (magnetic field, pulse length, spinning frequency). Each calculation was initialized with a pulse with random amplitudes and phases, and with an initial maximum RF amplitude of 10 kHz. In the calculation, the maximum allowed RF amplitude was limited to 50 kHz for each channel. In some calculations, the maximum RF amplitude was reduced to 25 kHz for 15N and limited to be between 11 and 17 kHz for 13C (for NCA transfers) or between 4 and 17 kHz for 13C (for NCO transfers). These pulses had similar performance (and similar average RF amplitudes) as the pulses calculated with the higher maximum RF amplitude.
The optimal control pulses were tested to select the ones that had the highest transfer efficiencies under experimental conditions. Interestingly, the experimental results did not always correlate with the simulated transfer efficiencies. In most cases, the differences between the theoretical and experimental transfer efficiencies are largely due to how the pulses behave in multiple-spin systems (see below). Examples of the best 2 ms NCA and NCO OCDCP pulses for use at 700 MHz for 1H and with a spinning frequency of 14 kHz are shown in the second column of Figure 1. For samples with non-uniform 13C-labeling, we found that 3 ms OCDCP pulses performed better than 2 ms pulses.
2.4. EXPORT
The conditions under which it is possible to use EXPORT without decoupling are quite demanding experimentally; typically 70 – 80 kHz RF amplitudes are required simultaneously on both the 13C and the 15N channels in order to be able to use this sequence without 1H decoupling[11]. As our 3.2 and 4 mm probes are not able to generate these RF amplitudes, we used a lower power match conditions for EXPORT. In our case, we used the C/2π = 3νr, BI/2π = 3νr/8, and BS/2π = 5νr/8 condition, where C/2π represents the amplitude of the RF field along the y-axis for both channels, and BI/2π and BS/2π represent the amplitudes of the 15N and 13C RF fields along the x-axis. The EXPORT building block for these conditions and νr = 14 kHz is illustrated in the third column of Figure 1. This building block is repeated every two rotor cycles, and the number of repetitions was experimentally determined for each sample. For NCA transfers, the maximum transfer efficiency was typically achieved with 18 repetitions (2.57 ms) and, for NCO transfers, with between 14 and 19 repetitions (2.0 – 2.7 ms).
2.5. Samples
Samples of the α-spectrin SH3 domain were prepared as described previously[19]. Briefly, the SH3 domain was expressed in Escherichia coli using M9 minimal media supplemented with 15N-labeled NH4Cl and either [U-13C]-labeled glucose or [2-13C]-labeled glycerol. The sample was purified by anion exchange chromatography, gel filtration, and dialysis, and then precipitated by changing the pH. The precipitate was separated by centrifugation, after which approximately 5 – 10 mg of protein precipitate was packed into a 3.2 mm sample rotor. A top spacer was used in each sample to confine the sample to the center of the rotor.
The [1,3-13C, U-15N]-labeled OmpG sample was expressed and prepared as described previously[20]. In brief, the cells were predominately grown on unlabeled rich medium and then transferred into M9 minimal medium containing [1,3-13C]-labeled glycerol and 15N-labeled NH4Cl. After 1 h of incubation, protein expression was induced and the cells were harvested after 3 h. The protein was purified under denaturing conditions, refolded in a detergent containing buffer, reconstituted into E. coli lipids, and crystallized by dialysis before packing ≈ 10 mg of sample material into a 3.2 mm rotor.
2.6. NMR Experiments
The sample temperature was maintained at 275 K for all experiments.
Continuous wave and SPINAL-64[21] 1H decoupling were used during pulses and delays, respectively, with a decoupling field strength of ~85 kHz. At lower decoupling field strengths the 15N-13C transfer efficiencies began to decrease, whereas higher strength decoupling (100–120 kHz) resulted in negligible improvements to the observed 15N-13C transfer efficiencies.
The 15N-13C transfer pulses were tested on a Bruker (Rheinstetten, Germany) Avance 600 MHz (14.1 T) spectrometer using 3.2 mm and 4 mm HXY MAS probes and on a Bruker Avance 700 MHz (16.4 T) spectrometer using a 3.2 mm HXY MAS probe. The MAS frequency (νr) was set to 12 kHz for experiments on the 600 MHz spectrometer and 14 kHz for experiments on the 700 MHz spectrometer. One-dimensional spectra were acquired with 32 scans and a 3 s recycle delay. The linearity of the RF amplifiers for both spectrometers was calibrated and tested using the “CORTAB” procedure included in the Bruker spectrometer software.
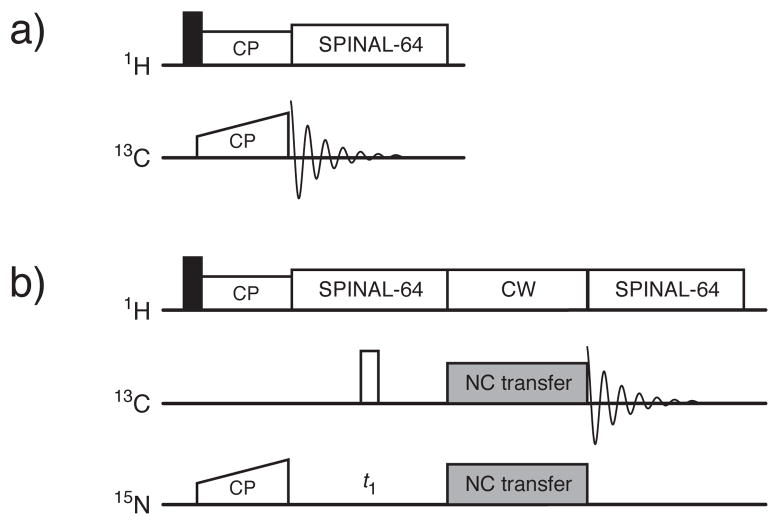
For the NCO and NCA experiments (Figure 2b), the first step was a CP-MAS transfer from 1H to 15N. For this transfer, a constant 1H RF amplitude of ≈65 kHz was used along with a linear ramp from 30 and 60 kHz of the 15N RF field. The optimized contact time was 1.5 ms. Immediately after the CP step, the magnetization was transferred from 15N to 13C using one of the three transfer methods previously mentioned. Selective transfer was achieved by setting the carrier frequency to be on-resonance with either Co or Cα during the transfer period. For all transfer pulses, a two-dimensional grid search was used to optimize the power level of the 13C and 15N channels prior to use. The length of the adiabatic DCP period and the number of EXPORT cycles were also experimentally optimized for each sample and experiment.
Figure 2.
The 13C CP-MAS experiment (a) and the NCA/NCO experiment (b). The “NC transfer” period was switched between adiabatic OCDCP, DCP, and the EXPORT sequence. Filled and open rectangles represent excitation (90°) and refocusing (180°) pulses, respectively.
For comparison, one-dimensional 13C CP-MAS experiments (Figure 2a) were carried out under conditions optimized for transfer of magnetization to Co or Cα. In both cases, the 1H RF amplitude was held at a constant value (≈60 kHz) while linearly ramping the 13C RF field from 30–60 kHz (for Cα) or from 35–75 kHz (for Co). The 13C RF transmitter was moved to be in the middle of the Co or Cα region. The contact time was 0.5 ms for CP transfers to Cα and between 2 and 3.5 ms for transfers to Co.
3. Results
Experimental transfer efficiencies for the SH3 and OmpG samples are shown in Table 2, and the corresponding spectra for some of these experiments are shown in Figure 3. The 15N-13C transfer efficiencies were measured relative to 13C CP-MAS spectra that were optimized for transfer to Cα or Co. Although every step of the experiments that generated these results was carefully optimized, these “absolute” transfer efficiencies may be somewhat misleading due to differences in the efficiency of the 1H-15N CP step compared to the 1H-13C CP step in the reference experiments. Nevertheless, the normalized transfer efficiencies between the different methods do not depend on the absolute transfer efficiencies, so any systematic errors in the efficiency of the 1H-13C or 1H-15N CP steps do not affect our conclusions.
Table 2.
Experimental efficiencies for the 15N-13C transfer methods. Transfer efficiencies were measured relative to 13C CP-MAS spectra that were optimized for either Co or Cα. The percentage values were determined by scaling the spectra to the same height rather than by integration. For normalized transfer efficiencies, the adiabatic DCP transfer efficiency is set to 100%, and the other transfer efficiencies scaled accordingly.
| Experiment | Sample | Transfer Efficiencies (%) | Normalized Transfer Efficiencies (%) | ||||
|---|---|---|---|---|---|---|---|
| Adiabatic DCP | OCDCP | EXPORT | Adiabatic DCP | OCDCP | EXPORT | ||
| NCA | [U-13C, U-15N] SH3 | 26 | 26 | 16 | 100 | 100 | 62 |
| [2-13C, U-15N] SH3 | 37 | 47 | 26 | 100 | 127 | 70 | |
| [1,3-13C, U-15N] OmpG | 26 | 37 | 14 | 100 | 142 | 54 | |
|
| |||||||
| NCO | [U-13C, U-15N] SH3 | 56 | 61 | 32 | 100 | 109 | 57 |
| [2-13C, U-15N] SH3 | 46 | 52 | 32 | 100 | 113 | 70 | |
| [1,3-13C, U-15N] OmpG | 35 | 47 | 25 | 100 | 134 | 71 | |
Figure 3.
Representative 1D 13C solid-state NMR spectra illustrating the transfer efficiencies of adiabatic DCP, OCDCP, and EXPORT in comparison to 13C CP-MAS spectra (pulse sequences are shown in Figure 2). The percentages are the same as in Table 2. Spectra were acquired at 700 MHz for 1H and with νr=14 kHz. The 13C CP-MAS spectra were optimized for either Co or Cα.
In all cases, NCA transfers are less efficient than NCO transfers. This is primarily because alpha carbons relax more quickly than carbonyl carbons during the transfer period, but also because the N-Cα dipolar coupling is weaker than the N-Co coupling. Faster relaxation of the OmpG membrane protein sample relative to the microcrystalline SH3 samples also explains why the transfer efficiencies for [2-13C, U-15N] SH3 are higher than for [1,3-13C, U-15N] OmpG. The normalized transfer efficiencies clearly show that OCDCP is comparable or better than adiabatic DCP for uniformly-labeled samples, and clearly outperform adiabatic DCP for [2-13C, U-15N]-labeled and [1,3-13C, U-15N]-labeled samples. The reason for this trend is discussed in the next section.
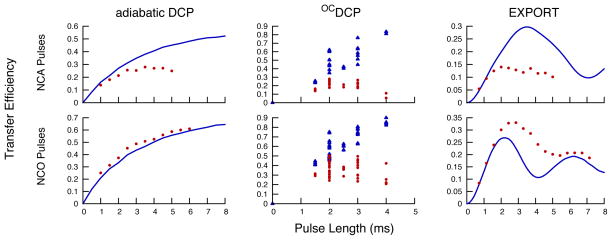
Figure 4 illustrates the simulated and experimental buildup curves for the three transfer sequences. For OCDCP, discrete points are shown as multiple pulses were calculated for each pulse length; the graph shows the results from a large number of pulses for which only the ones that performed best under experimental conditions were used for both the simulated and experimental results in this paper. For OCDCP, the experimental transfer efficiencies are below their theoretical values, an observation that will be discussed further in the next section.
Figure 4.
Simulated and experimental NCA and NCO transfer efficiencies for adiabatic DCP, OCDCP, and EXPORT as a function of pulse length at 700 MHz for 1H and with νr=14 kHz. The blue lines (or blue triangles) represent simulation results and the red circles represent experimental results. As OCDCP pulses cannot be varied in length, a number of different pulses with pulse lengths between 1.5 and 4 ms were calculated and then simulated (blue triangles). The simulations used a 13C-15N two-spin system and a 8% gaussian RF inhomogeneity profile. The experimental results were acquired using a [U-13C, U-15N] SH3 sample and were measured relative to 13C CP-MAS spectra that were optimized for transfer to Cα or Co.
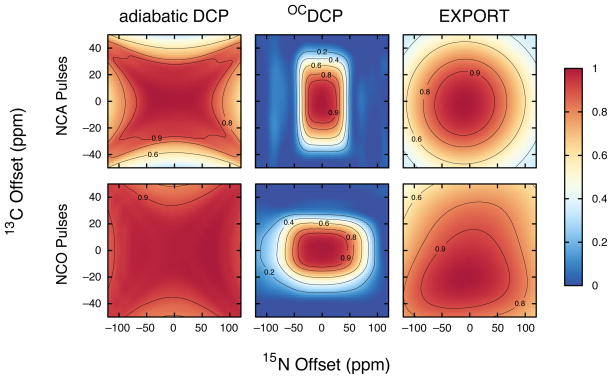
The simulated transfer efficiency as a function of chemical shift offsets is shown in Figure 5. All three transfer methods are able to cover the required range of chemical shifts for NCA and NCO transfers. OCDCP pulses have relatively uniform transfer efficiencies over the required range (40 ppm for amides, 25 ppm for Cα, 15 ppm for Co) but rapidly drop off at larger offsets, whereas adiabatic DCP and EXPORT transfers have broader profiles. In some situations, this is an advantage for OCDCP, as it allows for much cleaner selection of different spectral regions. Note that in this figure (as in Figures 6 and 7) the transfer efficiency is normalized such that the maximum transfer efficiency is set to 1.0 for each graph. This is to make it easier to compare the performance of the methods for a given parameter; transfer efficiencies relative to 13C CP-MAS spectra are provided in Figures 3 and 4, as well as Table 2.
Figure 5.
Simulated NCA and NCO normalized transfer efficiencies for adiabatic DCP, OCDCP, and EXPORT as a function of 15N and 13C chemical shift offset at 700 MHz for 1H and with νr=14 kHz. Although OCDCP pulses cover a much narrower range of offsets than the other two transfer methods, the range is more than adequate for the range of offsets expected for Co, Cα, and N resonances in biological samples. The well-defined chemical shift offset range of the OCDCP pulses should result in cleaner selection of different regions of the spectrum than the other two methods, which can be an advantage is some situations. The simulations use a 13C-15N two-spin system and a 8% gaussian RF inhomogeneity profile. The transfer efficiencies are normalized such that, for each graph, the maximum transfer efficiency is set to 1.0. The normalization scale factors (i.e., the maximum absolute transfer efficiency) for NCA simulations were 0.35, 0.59, and 0.32 for adiabatic DCP, OCDCP, and EXPORT, respectively and for NCO simulations were 0.56, 0.66, and 0.28 for adiabatic DCP, OCDCP, and EXPORT, respectively.
Figure 6.
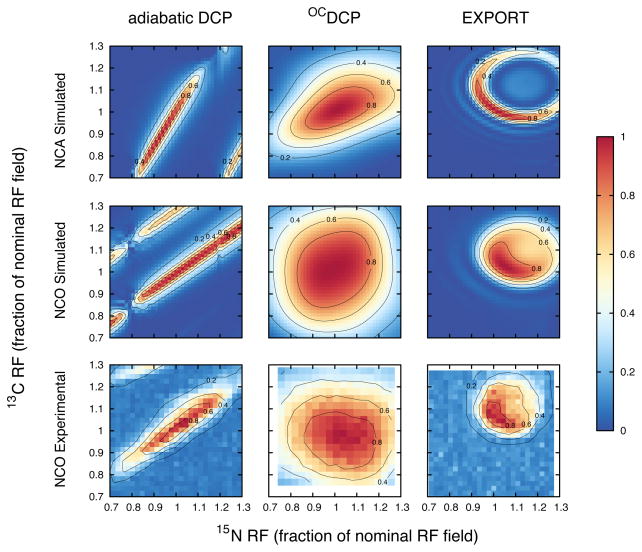
Simulated and experimental NCA and NCO normalized transfer efficiencies for adiabatic DCP, OCDCP, and EXPORT as a function of 15N and 13C RF field strengths at 700 MHz for 1H and with νr=14 kHz. The horizontal and vertical axes are given in terms of the fraction of the nominal RF field strength; the absolute RF fields (corresponding to 1.0) are given in the inset table in Figure 1. The simulations use a 13C-15N two-spin system. The transfer efficiencies are normalized such that, for each graph, the maximum transfer efficiency is set to 1.0. The normalization scale factors (i.e., the maximum absolute transfer efficiency) for NCA simulations were 0.50, 0.59, and 0.73 for adiabatic DCP, OCDCP, and EXPORT, respectively and for NCO simulations were 0.66, 0.68, and 0.50 for adiabatic DCP, OCDCP, and EXPORT, respectively. The experimental results were acquired using a [U-13C, U-15N] SH3 sample.
Figure 7.
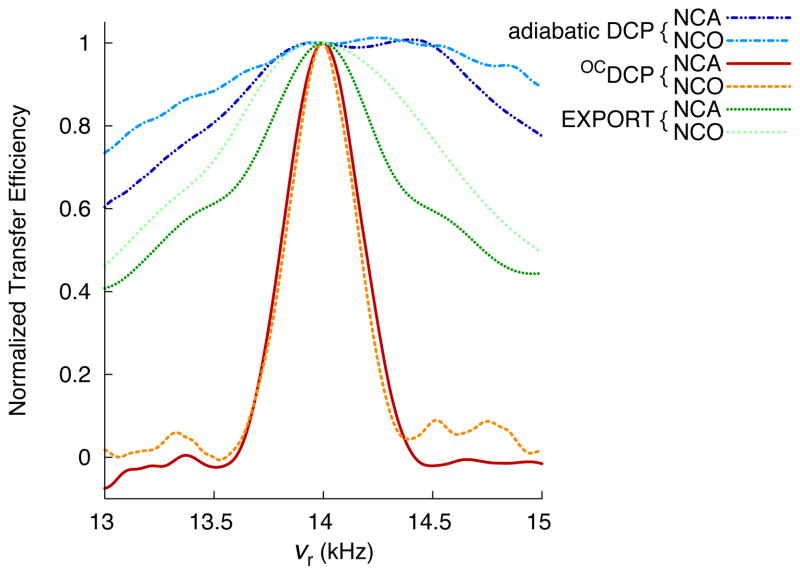
Simulated NCA and NCO normalized transfer efficiencies for adiabatic DCP, OCDCP, and EXPORT as a function of spinning frequency at 700 MHz for 1H. The simulations use a 13C-15N two-spin system and a 8% gaussian RF inhomogeneity profile. The transfer efficiency is normalized such that, for each graph, the transfer efficiency at 14 kHz spinning is set to 1.0. The normalization scale factors (i.e., the maximum absolute transfer efficiency) for NCA simulations were 0.35, 0.59, and 0.32 for adiabatic DCP, OCDCP, and EXPORT, respectively and for NCO simulations were 0.56, 0.66, and 0.28 for adiabatic DCP, OCDCP, and EXPORT, respectively.
Both simulated and experimental transfer efficiencies for the three methods as a function of the RF field strengths are shown in Figure 6. For adiabatic DCP, RF field amplitude variations of 1–2% on either channel results in a large decrease in transfer efficiency. The only situation where adiabatic DCP can tolerate RF inhomogeneities is if the variation between the two channels is positively correlated. EXPORT behaves somewhat better than adiabatic DCP with respect to RF inhomogeneities, particularly for NCO transfers where the large 13C CSA broadens the match condition. For small variations in the RF homogeneity (±10%), EXPORT deals well with a negative correlation between the channels. Of the three transfer methods, OCDCP deals the best with RF inhomogeneities. It can tolerate variations of 5–10% in the RF amplitude before a major decrease in transfer efficiency occurs, even if the homogeneities of the channels are not correlated (hence the relatively “square” RF profile in Figure 6). The greater tolerance of OCDCP to variations in the RF amplitude not only makes these pulses easier to calibrate and more robust to instrumental drift, but also results in higher signal levels under experimental conditions. This is because the broader match condition of OCDCP compensates for inhomogeneities in the RF field. Consequently, more of the sample volume is able to contribute to the NMR signal.
4. Discussion
4.1. Adiabatic DCP
As mentioned in the introduction, adiabatic DCP is the current standard for 15N-13C magnetization transfer in solid-state NMR spectroscopy. In light of the results shown in this paper, adiabatic DCP may still be a good choice in some situations, particularly with uniformly 13C-labeled samples and for systems with very homogeneous RF fields (such as samples with restricted volumes). However, adiabatic DCP does have several drawbacks. First, very high transfer efficiencies (approaching 100%) are theoretically possible but only for very long cross polarization periods. For most biological samples relaxation limits the cross polarization period to be between 3 and 8 ms and for samples that relax especially quickly it may be better to use OCDCP or EXPORT, which tend to reach maximum transfer efficiency in half the time (2–3 ms). In addition, in adiabatic DCP the application of relatively high power RF irradiation for such a long period simultaneously on three channels (including the 1H decoupling) can cause problems with sample heating. The third major drawback is that the match condition for adiabatic DCP is very narrow; optimizing the pulses to get maximum efficiency can be a tedious process and any changes in sample or instrument conditions during the course of an experiment will often change the match condition with a corresponding loss of transfer efficiency.
4.2. OCDCP
For uniformly 13C-labeled samples, pulses designed using optimal control theory performed comparably with or even slightly better than adiabatic DCP for NCA and NCO transfers. For sparsely 13C-labeled samples, such as our [2-13C, U-15N] SH3 and [1,3-13C, U-15N] OmpG samples, OCDCP clearly performs better than adiabatic DCP by 30–40% for NCA transfers and 10–30% for NCO transfers.
Even in situations where OCDCP only performs as well as (or worse than) adiabatic DCP, it may still be desirable for several reasons. For sensitive samples, OCDCP allows transfers with much less RF irradiation on the 13C and 15N channels and, for rapidly-relaxing samples, the shorter length for OCDCP pulses may be advantageous. In addition, for long experiments with unstable spectrometers or sensitive unstable samples, the broader match condition for OCDCP can be beneficial, as the transfer efficiency will vary less over the course of an experiment than for an adiabatic DCP transfer. Experimentally, OCDCP is also much quicker to setup as the optimal RF power level is much easier to find. This can be a considerable advantage when working with samples with low sensitivity where optimizing power levels is difficult.
With optimal control, one has to “be careful what you wish for” when designing pulses. Optimal control calculations usually produce pulses that work well for the specific conditions that were used for the optimization, but may or may not be optimal for variables that were unconstrained in the calculation. For example, the optimal control NCA and NCO pulses presented in this paper were optimized to be tolerant of RF inhomogeneity, but were optimized for a single MAS spinning frequency and consequently are intolerant of variations in this parameter. Figure 7 illustrates the spinning frequency dependence of the transfer efficiency for OCDCP in comparison to adiabatic DCP and EXPORT. However, this is not a concern as the spinning frequency is well controlled in MAS experiments, so there is no great need to be tolerant of variations in this parameter.
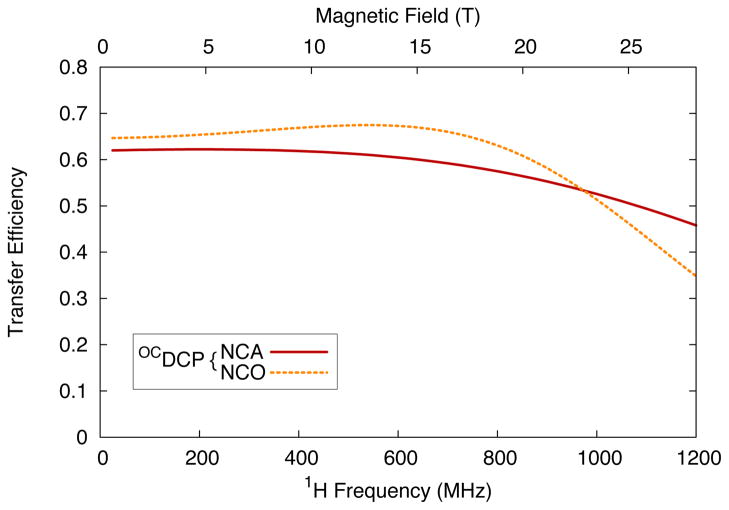
The magnetic field is not nearly as important a parameter as the spinning frequency in the optimization calculation. As shown in Figure 8, pulses will typically work at lower fields as long as the spinning frequency is the same. In addition, pulses will also sometimes work at higher fields, although typically with reduced efficiency. At higher fields the pulse may not cover an adequate range of chemical shift offsets. For example, the OCDCP pulses were designed to cover a 2800 Hz (40 ppm) range of chemical shifts for 15N on a 700 MHz (16.4 T) spectrometer. For a 1 GHz (23.5 T) spectrometer, this same 2800 Hz range corresponds to only 28 ppm. We do not foresee any problems in optimizing OCDCP pulses for any relevant desired field strength and spinning frequency.
Figure 8.
Simulated on-resonance transfer efficiencies for the NCA and NCO OCDCP pulses shown in Figure 1 as a function of 1H frequency/magnetic field. The simulations use a 13C-15N two-spin system, a 8% gaussian RF inhomogeneity profile, and νr=14 kHz.
Likewise, the OCDCP NCA/NCO transfer pulses were optimized while iterating over several isotropic chemical shift offsets to ensure efficient transfer over a range of chemical shifts, but only a single set of values for the 13C and 15N anisotropic shielding tensors was used for NCO pulses, and four values for NCA pulses. Consequently, there was no assurance that the OCDCP pulses that we calculated are tolerant of variations of the anisotropic shielding tensors or their orientations. However, it may be argued that the important issue is the frequency range invoked by the shielding parameters, independent of their origin (i.e., large anisotropies will cover smaller ones, one tensor orientation may cover others, etc.). Subsequent simulations support this view and demonstrate that all three transfer methods behave well with respect to anisotropy and asymmetry. For reasonable tensor values, the transfer efficiency rarely varies by more than 10% (see Supplementary Material).
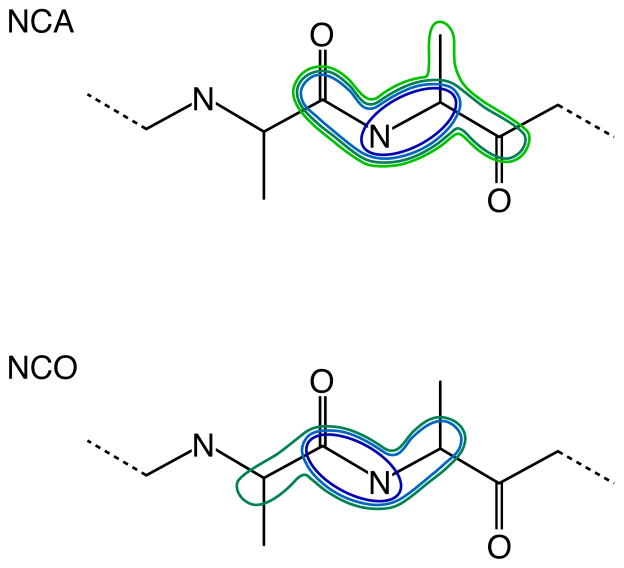
Probably the best example of “you get what you wish for” with OCDCP pulses is how they perform in larger spin systems. As noted previously, the OCDCP pulses were calculated using a two-spin system. Although it is very computationally expensive to optimize pulses for larger spin systems using the current version of SIMPSON, it is possible to simulate the performance of these pulses in a reasonable amount of time. We created different model spin systems with between two and five spins to simulate the performance of the pulses in larger spin systems. For NCA experiments, the two-spin system consists of the amide nitrogen and the alpha carbon. Larger spin systems were constructed by adding spins for the carbonyl carbon of the preceding residue, the intraresidue carbonyl carbon, and finally the beta carbon. In the case of NCO experiments, the two-spin system consists of an amide nitrogen and the carbonyl carbon of the preceding residue. Larger spin systems were constructed by adding the intraresidue alpha carbon and then the alpha carbon of the preceding residue. These topologies are illustrated in Figure 9. The CSA and coupling (dipolar and scalar) tensor values for these spins were calculated using SIMMOL[18] based on a poly-alanine peptide model.
Figure 9.
Topologies used for multiple spin simulations. For NCA experiments systems with up to five spins were used to test the dependence of the transfer methods on neighboring nuclei, whereas for NCO experiments systems with a maximum of four spins were used in the simulations.
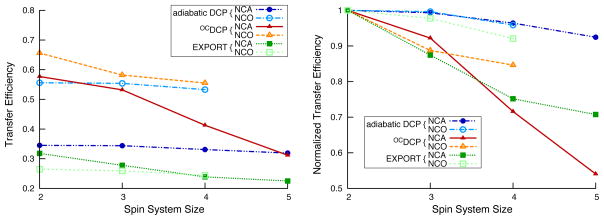
Simulations of the transfer efficiencies for two, three, four, and five-spin systems are shown in Figure 10. The results demonstrate that the OCDCP pulses are not ideally optimized for larger spin systems; theoretical transfer efficiencies drop by almost half for OCDCP NCA pulses and by about 15% for OCDCP NCO pulses for the largest spin systems simulated. This effect on the transfer efficiency increases with the length of the OCDCP pulses in a roughly linear fashion (data not shown). EXPORT also suffers from decreased performance in larger spin systems relative to adiabatic DCP transfers, but the degradation is less severe than for OCDCP.
Figure 10.
Simulated NCA and NCO transfer efficiencies for adiabatic DCP, OCDCP, and EXPORT as a function of spin system size at 700 MHz for 1H and with νr=14 kHz. The graph to the left shows the transfer efficiencies, whereas the graph to the right shows the same data but normalized such that the two-spin result for each transfer method is set to 1.0. Filled symbols are for NCA transfers and hollow symbols are for NCO transfers. The spin systems used are illustrated in Figure 9. The simulations used a 8% gaussian RF inhomogeneity profile.
The behavior of OCDCP in the presence of additional spins explains the discrepancy between theoretical and experimental performance seen in this and previous work[10]. Additionally, this also helps explain why this discrepancy is larger for longer pulses, as seen in the middle column of Figure 4. Simply put, for longer pulses there is more time for other dipolar couplings to interfere with the magnetization transfer. That OCDCP performs comparably or better under experimental conditions in comparison to adiabatic DCP is due to the built-in compensation for RF inhomogeneities and the limits that relaxation impose on how long the adiabatic DCP transfer period can be. Consequently, OCDCP still provides experimental transfer efficiencies higher than or equal to adiabatic DCP (Table 2 and Figure 3) regardless of the spin systems size for NCO experiments and, for NCA experiments, OCDCP still performs comparably to adiabatic DCP even for uniformly 13C,15N-labeled samples.
4.3. EXPORT
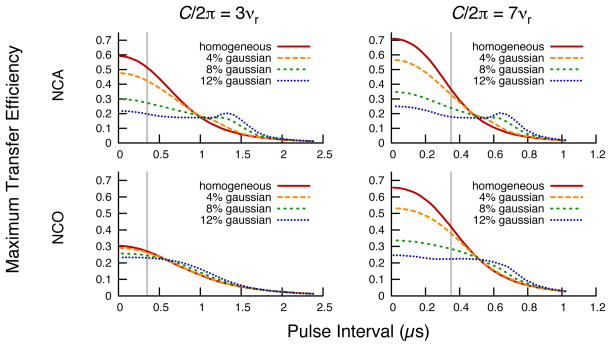
EXPORT, as used in the present setup with 1H decoupling, did not perform well, either theoretically or experimentally, compared to adiabatic DCP and OCDCP with respect to transfer efficiency. In addition, EXPORT is very demanding of the spectrometer hardware as it requires high RF powers and very short pulse intervals (i.e., the intervals that make up the overall pulse shape). EXPORT has the highest transfer efficiencies when using the shortest pulse intervals but is very sensitive to RF inhomogeneity under these conditions. With short pulse intervals, the transfer efficiency using an RF coil with a 8% gaussian inhomogeneity profile can be less than 50% of the efficiency using an ideal (homogeneous) RF coil. Figure 11 illustrates how the transfer efficiency for EXPORT varies with pulse interval.
Figure 11.
Simulated NCA and NCO transfer efficiencies for EXPORT as a function of pulse interval. The results were calculated for two-spin systems at 700 MHz for 1H and with νr= 14 kHz. The number of times the EXPORT block was repeated was optimized for each pulse interval. The left-hand graphs show results for the C/2π=3νr condition, which is the condition used for the experimental results in this paper. The right-hand graphs correspond to the C/2π=7νr condition, in which the average RF field strength is approximately seven times the spinning frequency. The gray vertical line indicates the smallest available pulse intervals (350 ns) for “fast” shaped pulses on our Bruker spectrometers; newer models are able to use significantly smaller pulse intervals.
Longer pulse intervals tend to result in lower transfer efficiencies for EXPORT. Interestingly, as the pulse intervals become longer, there is a regime where the transfer is robust with respect to RF inhomogeneity and, for even longer pulse intervals there can even be a regime where the transfer efficiency improves with increasing RF inhomogeneity. Unfortunately, this behavior with respect to RF inhomogeneity does not fully counter the drop in transfer efficiency when using longer pulse intervals. Regardless of the amount of RF inhomogeneity, the best transfer efficiencies are achieved with the shortest possible pulse intervals.
In this paper, we used the C/2π=3νr condition for EXPORT, which results in average RF fields of around 42 kHz for the 15N and 13C channels when using a sample spinning frequency of 14 kHz. However, a higher power condition (C/2π=7νr) has also been described[11]. This condition is experimentally inaccessible on our 3.2 and 4 mm probes as it requires RF amplitudes of around 98 kHz for each channel when spinning the sample at 14 kHz. Nevertheless, we simulated the performance of EXPORT using the C/2π=7νr condition to see if this would result in a better outcome relative to the C/2π=3νr condition. As shown on the right in Figure 11, the higher amplitude condition improves the transfer efficiency if the RF field is relatively homogeneous. Under conditions similar to our experimental conditions (350 ns pulse intervals, 8% gaussian RF inhomogeneity), the transfer efficiency using the C/2π=7νr condition is slightly better for NCO but slightly worse for NCA compared to EXPORT transfers using the C/2π=3νr condition. For the conditions of 50 – 100 ns digitization (as can be achieved with newer spectrometer consoles), the transfer efficiency is always better for the higher power condition but is also more susceptible to RF inhomogeneities.
5. Conclusions
For moderate spinning frequencies (10–20 kHz), adiabatic DCP and OCDCP tend to have similar efficiencies for 15N-13C transfers. Which method works best depends on the nature of the sample and the probe; systems with more homogeneous RF fields favor adiabatic DCP transfers, while samples with non-uniform labeling schemes favor OCDCP transfers. Further advantages of OCDCP pulses are that they require less power for shorter periods of time (so they are more suitable for sensitive samples) and that they are much more robust with respect to RF inhomogeneity and RF power levels (which makes them easier to calibrate and better suited for long experiments where the instrument conditions may drift with time). EXPORT transfers did not perform well under the conditions investigated, but may be better suited at the high 15N/13C RF power conditions for which they were originally proposed and where efficient transfers may be achieved without 1H decoupling.
Supplementary Material
Acknowledgments
Thanks to Anne Diehl and Matthias Hiller (FMP-Berlin) for their help preparing samples and to Jochem Struppe and Hans Förster at Bruker Biospin for useful conversations. We acknowledge support from the Danish National Research Foundation and the Danish Center for Scientific Computing. N.M.L. was supported by Award Number R15GM085733 from the National Institute of General Medical Sciences.
Footnotes
7. Resources and Supplementary Materials
SIMPSON scripts for generating and testing OCDCP pulses as well as shape files (in Bruker format) for all pulses (OCDCP, EXPORT, and adiabatic DCP) at both spinning frequencies (12 and 14 kHz) are provided in the supplementary information as well as at: http://lclark.edu/~loening/pulses.html
Publisher's Disclaimer: This is a PDF file of an unedited manuscript that has been accepted for publication. As a service to our customers we are providing this early version of the manuscript. The manuscript will undergo copyediting, typesetting, and review of the resulting proof before it is published in its final citable form. Please note that during the production process errors may be discovered which could affect the content, and all legal disclaimers that apply to the journal pertain.
References
- 1.Schaefer J, Stejskal E, Garbow J, McKay R. Quantitative determination of the concentrations of 13C-15N chemical bonds by double cross-polarization NMR. J Magn Reson. 2003;59:150–156. [Google Scholar]
- 2.Metz G, Wu XL, Smith SO. Ramped-amplitude cross polarization in magic-angle-spinning NMR. J Magn Reson, Ser A. 1994;110:219–227. [Google Scholar]
- 3.Baldus M, Geurts DG, Hediger S, Meier BH. Efficient 15N-13C polarization transfer by adiabatic-passage Hartmann-Hahn cross polarization. J Magn Reson, Ser A. 1996;118:140–144. [Google Scholar]
- 4.Baldus M, Petkova AT, Herzfeld J, Griffin RG. Cross polarization in the tilted frame: assignment and spectral simplification in heteronuclear spin systems. Mol Phys. 1998;95:1197–1207. [Google Scholar]
- 5.Bjerring M, Nielsen NC. Solid-state NMR heteronuclear coherence transfer using phase and amplitude modulated rf irradiation at the hartmann-hahn sideband conditions. Chem Phys Lett. 2003;382:671–678. [Google Scholar]
- 6.Lee YK, Kurur ND, Helmle M, Johannessen OG, Nielsen NC, Levitt MH. Efficient dipolar recoupling in the NMR of rotating solids. a sevenfold symmetric radiofrequency pulse sequence. Chem Phys Lett. 1995;242:304–309. [Google Scholar]
- 7.Brinkmann A, Levitt MH. Symmetry principles in the nuclear magnetic resonance of spinning solids: Heteronuclear recoupling by generalized HartmannHahn sequences. J Chem Phys. 2001;115:357 – 384. [Google Scholar]
- 8.Bjerring M, Nielsen NC. Solid-state NMR heteronuclear dipolar recoupling using off-resonance symmetry-based pulse sequences. Chem Phys Lett. 2003;370:496–503. [Google Scholar]
- 9.Kehlet CT, Sivertsen AC, Bjerring M, Reiss TO, Khaneja N, Glaser SJ, Nielsen NC. Improving solid-state NMR dipolar recoupling by optimal control. J Am Chem Soc. 2004;126:10202–10203. doi: 10.1021/ja048786e. [DOI] [PubMed] [Google Scholar]
- 10.Kehlet C, Bjerring M, Sivertsen AC, Kristensen T, Enghild JJ, Glaser SJ, Khaneja N, Nielsen NC. Optimal control based NCO and NCA experiments for spectral assignment in biological solid-state NMR spectroscopy. J Magn Reson. 2007;188:216–230. doi: 10.1016/j.jmr.2007.06.011. [DOI] [PubMed] [Google Scholar]
- 11.Nielsen AB, Straasø LA, Nieuwkoop AJ, Rienstra CM, Bjerring M, Nielsen NC. Broadband heteronuclear solid-state NMR experiments by exponentially modulated dipolar recoupling without decoupling. J Phys Chem Lett. 2010;1:1952–1956. doi: 10.1021/jz100564j. [DOI] [PMC free article] [PubMed] [Google Scholar]
- 12.Tosner Z, Vosegaard T, Kehlet C, Khaneja N, Glaser SJ, Nielsen NC. Optimal control in NMR spectroscopy: Numerical implementation in SIMPSON. J Magn Reson. 2009;197:120–134. doi: 10.1016/j.jmr.2008.11.020. [DOI] [PubMed] [Google Scholar]
- 13.Bak M, Rasmussen JT, Nielsen NC. SIMPSON: A general simulation program for solid-state NMR spectroscopy. J Magn Reson. 2000;147:296–330. doi: 10.1006/jmre.2000.2179. [DOI] [PubMed] [Google Scholar]
- 14.Pontryagin LS, Boltyanskii VG, Gamkrelidze RV, Mishchenko EF. The Mathematical Theory of Optimal Processes. Wiley-Interscience; New York: 1962. [Google Scholar]
- 15.Bryson AE, Jr, Ho Y-C. Applied Optimal Control: Optimization, Estimation, and Control. Hemisphere; Washington, DC: 1975. [Google Scholar]
- 16.Nielsen NC, Kehlet C, Glaser SJ, Khaneja N. Optimal control methods in NMR spectroscopy. In: Harris RK, Wasylishen RE, editors. Encyclopedia of Magnetic Resonance. John Wiley & Sons, Ltd; 2010. [Google Scholar]
- 17.Bak M, Nielsen NC. REPULSION, a novel approach to efficient powder averaging in solid-state NMR. J Magn Reson. 1997;125:132 – 139. doi: 10.1006/jmre.1996.1087. [DOI] [PubMed] [Google Scholar]
- 18.Bak M, Schultz R, Vosegaard T, Nielsen NC. Specification and visualization of anisotropic interaction tensors in polypeptides and numerical simulations in biological solid-state NMR. J Magn Reson. 2002;154:28–45. doi: 10.1006/jmre.2001.2454. [DOI] [PubMed] [Google Scholar]
- 19.Pauli J, van Rossum B, Förster H, de Groot HJM, Oschkinat H. Sample optimization and identification of signal patterns of amino acid side chains in 2D RFDR spectra of the [alpha]-spectrin SH3 domain. J Magn Reson. 2000;143:411–416. doi: 10.1006/jmre.2000.2029. [DOI] [PubMed] [Google Scholar]
- 20.Hiller M, Higman VA, Jehle S, van Rossum BJ, Kühlbrandt W, Oschkinat H. [2,3-13C]-labeling of aromatic residues–getting a head start in the magic-angle-spinning NMR assignment of membrane proteins. J Am Chem Soc. 2008;130:408–409. doi: 10.1021/ja077589n. [DOI] [PubMed] [Google Scholar]
- 21.Fung BM, Khitrin AK, Ermolaev K. An improved broadband decoupling sequence for liquid crystals and solids. J Magn Reson. 2000;142:97–101. doi: 10.1006/jmre.1999.1896. [DOI] [PubMed] [Google Scholar]
Associated Data
This section collects any data citations, data availability statements, or supplementary materials included in this article.


