

Abstract
AssignFit is a computer program developed within the XPLOR-NIH package for the assignment of dipolar coupling (DC) and chemical shift anisotropy (CSA) restraints derived from the solid-state NMR spectra of protein samples with uniaxial order. The method is based on minimizing the difference between experimentally observed solid-state NMR spectra and the frequencies back calculated from a structural model. Starting with a structural model and a set of DC and CSA restraints grouped only by amino acid type, as would be obtained by selective isotopic labeling, AssignFit generates all of the possible assignment permutations and calculates the corresponding atomic coordinates oriented in the alignment frame, together with the associated set of NMR frequencies, which are then compared with the experimental data for best fit. Incorporation of AssignFit in a simulated annealing refinement cycle provides an approach for simultaneous assignment and structure refinement (SASR) of proteins from solid-state NMR orientation restraints. The methods are demonstrated with data from two integral membrane proteins, one α-helical and one β-barrel, embedded in phospholipid bilayer membranes.
1. Introduction
Methods for NMR structure determination typically rely on obtaining resonance assignments by establishing correlations between neighboring atoms, followed by measuring a series of restraints (e.g. distances, orientations) for each assigned site, that are used in structure determination by simulated annealing. In recent years, methods for simultaneous assignment and structure refinement (SASR) have been developed for both solution NMR and solid-state NMR.
For solution NMR, several such methods rely on backbone residual dipolar couplings (RDC) measured from weakly aligned samples, in combination with backbone chemical shifts, to define and connect structured fragments of a protein in a sequence-specific manner [1], to obtain backbone resonance assignments from a known protein structure [2], or to determine the three-dimensional arrangement of protein-protein complexes from the pre-determined structures of the individual components [3, 4]. Alternatively, it is possible to generate low-resolution structures of globular proteins by fitting unassigned NMR data (e.g. chemical shifts, NOEs, RDCs) to computationally predicted structural models using a Monte Carlo procedure [5]. Finally, methods have been developed to compute realistic spatial proton distributions for proteins in solution, solely from experimental NOE data with minimal assignments [6-8].
For solid-state NMR, the direct correlation between protein structure and the orientation-dependent dipolar coupling (DC) and chemical shift anisotropy (CSA) frequencies, measured in samples with uniaxial order [9-11], provides a method for SASR based on minimizing the difference between the experimentally observed spectral frequencies and the frequencies back-calculated from a structural model. Because such solid-state NMR spectra display full, or near full, magnitudes of the DC and CSA, the order tensor is known a priori, and their interpretation is significantly facilitated. The SASR approach relieves the burden of having to obtain near complete resonance assignments prior to structure determination: resonance assignments are obtained as a side product of fitting a structural model to the NMR data, but is not a prerequisite for structure determination.
Uniaxial order can be achieved by either inducing sample alignment relative to the magnetic field (Bo), as in oriented sample (OS) solid-state NMR [12, 13], or by exploiting the inherent uniaxial rotation of a protein relative to an internal principal axis in a non-aligned sample (e.g. [14-16]). Since the direction of order is fixed by the sample geometry, the resulting NMR frequencies provide not only precise internal restraints for structure determination, but also relative restraints that enable the structure to be positioned in the context of the alignment medium. This is particularly useful for membrane proteins in lipid bilayers where structure determination also yields the three-dimensional position of the protein within the membrane [17-21]. For membrane proteins embedded in phospholipid bilayer membranes, the direction of order is determined by the membrane preparation, which can consist of planar lipid bilayers supported on glass or aligned magnetically, or of spherical vesicles where the protein undergoes rotational diffusion around the lipid bilayer normal (n).
In the first applications of SASR to α-helical membrane proteins, the 1H/15N separated local field (SLF) spectra obtained from combinations of selectively 15N-labeled (by residue type) and uniformly 15N-labeled (all residues) proteins were assigned by comparison with the spectra calculated from a structural model, and the assigned experimental frequencies were then used to either directly calculate backbone dihedral angles [18], or as orientation restraints in a simulated annealing protocol [22], to obtain a final membrane-oriented structure consistent with the data. Alternatively, an algorithm has been described to build structural models from random assignments of SLF data and comparison of the data back-calculated from each structural model with the experimental data [23]. Furthermore, a method based on graph theory has been developed to simultaneously obtain structure and assignment of 1H/15N SLF spectra [24]. These two approaches were developed specifically for a-helical proteins, although they should also be applicable to other regular secondary structures.
In a recent application of SASR to a β-barrel outer membrane protein, the 1H/15N SLF spectrum of 15N-Phe-labeled OmpX in magnetically oriented lipid bilayers was assigned through an iterative approach where each of the possible peak assignment combinations was tested for its ability to provide 1H/15N DC and 15N CSA orientation restraints, consistent with the proper spatial orientation of the crystal structure within the membrane and with its associated back-calculated spectrum [25]. Although powerful, this type of analysis can quickly evolve into a complicated problem when the number of assignment permutations to be tested is very large, since for n number of peaks there are n! assignment permutations. For example, there are 5040 (7!) ways to assign the 7 Phe peaks in the SLF spectrum of selectively 15N-Phe-labeled OmpX and, while the task can be alleviated by further subdividing the spectrum into separate sets of peaks according to their H/D exchange [25], or other properties, such simplifications are not always possible.
Here we present a computer program, AssignFit, developed within the XPLOR-NIH package [26], that greatly facilitates the SASR process. Unlike the first applications of SASR to α-helical [18] or β-sheet [25] membrane proteins, where the potential assignment permutations were generated by hand and analyzed with the aid of home-developed FORTRAN code, AssignFit generates all permutations computationally and tests them for best fit to the data.
2. Results and Discussion
AssignFit and the SASR protocol
The SASR calculation cycle starts with an initial structural model and a set of unassigned DCs and CSAs for a particular residue type (e.g. from a selectively labeled sample). Each SASR cycle consists of generating optimal residue-specific assignments for the input data, and then using the assigned DC and CSA restraints to refine the structural model, which provides the input for the next SASR cycle where a new set of DCs and CSAs are assigned. The cycles are continued until all DC and CSA restraints are assigned and the resulting structure is consistent with the entire data set (Fig. 1A).
Figure 1. SASR protocol.

(A) Flowchart representation of SASR using AssignFit. (B) Energy and RMSD functions calculated by AssignFit to evaluate the results.
AssignFit is an integral part of the SASR process. Starting with a structural model and a set of DC and CSA data, AssignFit generates all possible assignment permutations and calculates the corresponding molecular alignment, the atomic coordinates reoriented in the alignment frame, and associated set of NMR frequencies, which are then compared with the experimental data for best fit. For each possible assignment the optimal orientation of the input structural model is determined using conjugate gradient minimization of a weighted sum of energies (Etot) corresponding to DC and CSA terms (Fig. 1B). The assignments are sorted by the weighted sum of RMSDs for both DC and CSA (RMSDtot), and the lowest RMSD assignments are saved for further analysis.
While the orientation determination is quite fast, the number of possible assignments grows combinatorially such that exhaustive calculation of these orientations becomes impractical when there are more than about 11 residues of a particular type to be assigned. In this case, it may be possible to split the data points into smaller subsets, grouped by other known properties, such as 2H exchange or dynamics. Moreover, SLF spectra provide a natural separation of frequencies according to the orientation of their corresponding structural domain (e.g. transmembrane versus membrane surface helices), thus separating the data into smaller subgroups that can be handled more readily by the program. For example, the cross-polarization matching condition in SLF experiments can be adjusted to selectively couple only those residues in transmembrane helices. Finally, graph-theoretic approaches, such as those used in [8], completely avoid the combinatorial growth problem, and are straightforward to implement in our current protocol when required by large system size.
AssignFit uses the modules for variable tensor (varTensorTools), RDC potential (rdcPotTools), and CSA potential (csaPotTools) available in XPLOR-NIH [26, 27]. The relevant parameters and associated energy (Etot) and RMSD (RMSDtot) functions are described below and in Figure 1B.
For solid-state NMR studies, the magnitude and orientation of the alignment tensor are known, or can be closely estimated, from the sample geometry. In this case, AssignFit can be performed by specifying and fixing the values of the axial alignment parameter (Da) and rhombicity (Rh), so that only the orientation of the input structure relative to the principal alignment axis (e.g. the lipid bilayer normal) is varied. Alternatively, AssignFit could be applied to cases where the tensor is not known (e.g. data from weakly aligned samples) by allowing the values of Da and Rh to vary. Selecting this option results in AssignFit performing singular value decomposition for each set of assignment permutation to calculate the optimum values of Da and Rh, together with molecular orientation. The application of this approach for solution NMR alignment tensor determination, based on RDCs assigned solely by residue type and a known protein structure, has been demonstrated previously for the structural analysis of protein-protein complexes [28]. In that case a pre-refined structure was used to determine the values of Da and Rh, which were then used to position the protein in the context of the complex.
Both DC and CSA need to be signed (+/-) values in the input files of AssignFit. The CSA signs are obtained experimentally and, while the SLF experiment does not provide direct information about the DC signs, the latter can often be determined from the peak positions in the spectrum [29]. In cases where this is not possible, AssignFit enables peaks with ambiguous signs to be specified and taken into account during the calculation by testing different sign permutations.
The value of Etot reflects the combined difference between the observed and back-calculated DC and CSA, each scaled by the corresponding user-defined force constants (RDCscale, CSAscale). The value of RMSDtot reflects the combined RMSD for DC and CSA, scaled by the relative effective spectral resolution (Rspec) available in the DC and CSA dimensions (Fig. 1B). Rspec is a user-defined parameter that reflects the ratio of the total spectral range available to the resonance line width. Its value can be determined from the observed spectral ranges and associated experimental line widths or errors for the DC and CSA data. The value of RMSDtot, scaled in this way, provides an effective parameter for selecting the AssignFit result with best fit to the experimental spectrum. For the spectra of OmpX and fd coat protein examined in this study values of Rspec=7.5 and Rspec=4.0 were used, respectively; they each reflect experimental CSA spectral ranges of 150 ppm (OmpX) or 80 ppm (fd) with a CSA error of 1 ppm, and DC spectral ranges of 5,000 Hz (OmpX, fd) with a DC error of 250 Hz.
AssignFit assignment of the 1H/15N SLF spectrum of the OmpX β-barrel in oriented lipid bilayers
We first used AssignFit to assign the 1H/15N SLF spectrum of 15N-Phe labeled E. coli OmpX in magnetically aligned phospholipid bilayers (n‖Bo). OmpX forms an eight-stranded transmembrane β-barrel in the outer membrane of E. coli. Its structure has been determined by both X-ray crystallography [30] and solution NMR [31] in detergents, and we have determined its orientation in phospholipid membranes using solid-state NMR [25].
Using AssignFit, starting from the crystal structure of OmpX, all 5040 test assignments of the 7 Phe peaks were obtained in 634 seconds of CPU time (Hp-390t Linux computer, Intel Core i7-970 3.20GHz six-core processor) without the need to separate the data into two sets according to their H/D exchange properties, as was done previously [25]. The five lowest energy assignments (Fig. 2A-E) all yield calculated spectra that are visually very similar to the experimental spectrum, good correlations between observed and calculated N CSA and 1H/15N DC frequencies, and very similar molecular orientations of OmpX within the membrane (Fig. 2H). One test assignment with the best correlations (test #1; Fig. 2A) has the lowest values of both RMSDtot (Fig. 2F) and Etot (Fig. 2G). It is identical to our previously determined assignment [25] and yields an identical transmembrane orientation of the β-barrel.
Figure 2. Results for the five lowest energy assignments obtained with XPLOR-NIH AssignFit for the 1H/15N SLF spectrum of 15N-Phe-labeled OmpX in magnetically aligned bilayers (n‖Bo).
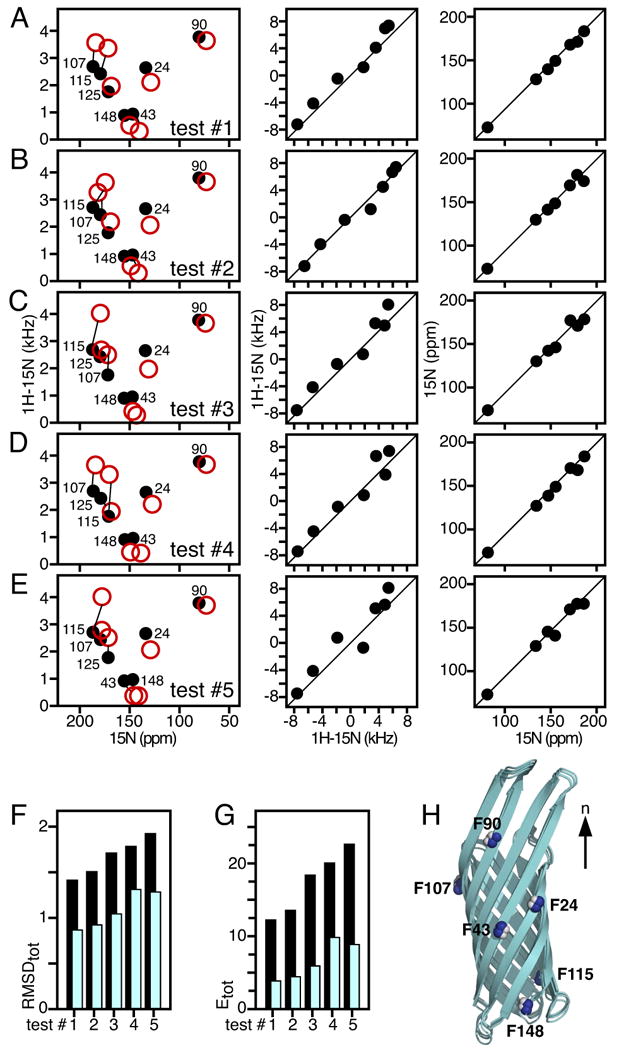
(A-E) Five lowest energy assignments showing observed (black) and back-calculated (red) peaks. For each test assignment (#1-5), the corresponding correlations between observed and back-calculated 1H-15N DC (middle) and 15N CSA (right) reflect the resulting RMSD (F) and energy values (G). (F, G) Total RMSD (F) and energy values (G) obtained for each of the five lowest energy assignments before (black) or after (cyan) structural refinement. (H) Overlay of the OmpX membrane orientations consistent with each of the five lowest energy test assignments obtained from AssignFit.
The next four lowest energy results swap the assignments among F107, F115 and F125 (test #2-4; Fig. 2B-D) or between F43 and F148 (test #4-5; Fig. 2D-E), and thus produce poorer correlations between experimental and calculated data, reflected in higher values of RMSDtot and Etot. The peaks for F107, F1 15 and F125 are clustered within a 15 ppm by 2 kHz spectral region, and their corresponding NH bonds have relatively similar orientations. Therefore, it is not surprising that swapping their assignments yields similar molecular orientations. Similarly, the peaks from F43 and F148 are very close in a narrow spectral window (8 ppm by 80 Hz) and their assignments can be swapped with little consequence. In contrast, the peaks from F90 and F24 occupy singular positions in the spectrum, and their assignments are constant in all of the lowest RMSDtot/Etot AssignFit determinations.
Since lipid bilayers magnetically aligned with n‖Bo have net axial order parameters in the range of Szz=0.9-0.8, a value of Da=8.5 was used to generate the AssignFit results in Fig. 2. Varying Da from 10 to 7 kHz does not affect the AssignFit result but produces calculated SLF spectra where the DC and CSA frequencies scale as Szz and the SLF peaks move progressively towards the isotropic frequencies with decreasing Da (Fig. 3). The best fit to the experimental spectrum is observed for Da=8.5 kHz, the value which also yields the lowest AssignFit values of RMSDtot and Etot, and which was found to give the best agreement between experimental and calculated frequencies in the previous study [25].
Figure 3. Effect of varying the order parameter Szz on the fit between experimental (black) and AssignFit-calculated (circles) SLF spectra of selectively 15N-Phe labeled OmpX in magnetically aligned bilayers (n‖Bo).

For each peak, the arrows show the frequency shift observed from Da=10-7 kHz (including Da=10, 9, 8.5, 8, 7 kHz). The best fit to the experimental spectrum is obtained for Da=8.5 kHz (red circles).
AssignFit and SASR of the α-helical fd bacteriophage coat protein in oriented lipid bilayers
We next used AssignFit to assign the 1H/15N SLF spectrum of 15N-selectively labeled fd coat protein in glass-aligned phospholipid bilayers (n‖Bo). The membrane-bound form of the major pVIII coat protein of filamentous fd bacteriophage resides in the inner membrane of infected E. coli before incorporation into virus particles that are extruded through the bacterial cell membrane. The structure of the membrane-bound form has been extensively studied in micelles and lipid bilayers using NMR (reviewed in [18]). The protein has two distinct α-helices: a short amphipathic helix that rests on the membrane surface and a longer hydrophobic helix that traverses the membrane.
Previously [18], we showed that the 1H/15N SLF spectrum of fd could be assigned by comparison with the spectra back-calculated from ideal helices oriented in the magnetic field and relying on the characteristic wheellike patterns (Pisa wheels) observed in the spectra of helical proteins [9-11]. In this first example, each potential assignment permutation was generated by hand and analyzed with the aid of home-developed FORTRAN code. The best assignments were selected based on the ability of the corresponding DC and CSA frequencies to yield the most favorable helical backbone dihedral angles for connected residues. In contrast, AssignFit generates all permutations computationally and automatically tests them for best fit to the experimental data and a reasonable structural model.
Using AssignFit in combination with an ideal helix starting model, the SLF peaks corresponding to the four Val, three Ala, and three Gly residues in the transmembrane helix of the fd coat protein could be assigned quickly, and the accuracy of the assignments could be evaluated quantitatively (Fig. 4). Furthermore, using AssignFit as part of an SASR cycle where the structural model is refined after assigning each set of peaks, increases the assignment confidence by ensuring that each assigned data set is consistent with the next, to produce a final refined structure consistent with the data.
Figure 4. SASR with the 1H/15N SLF spectra of 15N-Val, Ala, Leu, and Gly labeled fd coat protein (transmembrane domain) in glass-aligned lipid bilayers (n‖Bo).

In all spectra, filled circles represent experimentally observed peaks. Unfilled circles represent frequencies back-calculated after structural model refinement with the assigned restraints. The peaks are color-coded by amino acid type: Val (blue), Ala (red), Leu (green), and Gly (gold). The spectral region corresponds to the protein's transmembrane domain. AssignFit was implemented with Da=10 kHz, kDC=1 kcal mol-1 kHz-2, kCSA=0.01 kcal mol-1 ppm-2. (A-C) Residue specific assignments of the Val, Ala, and Gly peaks were obtained using AssignFit, after fixing the L41 assignment, with: (A) an ideal helix structural model; (B) the structural model refined with Val DC and CSA restraints; (C) the structural model refined with Val, and Ala DC and CSA restrains. For each assignment/refinement cycle, the total RMSD and energy of the 5 lowest RMSD AssignFit results, obtained before (black) and after (cyan) model refinement, are shown on the right. (D) Experimental SLF spectrum from uniformly 15N-labeled fd (black) showing peaks from Ala (red), Val (blue), Gly (gold) and Leu (green), assigned with AssignFit. (E, F) Correlations between values of the 1H-15N DC and 15N CSA observed experimentally (obs) and back-calculated after refinement of the starting structural model (calc). The R2 correlation coefficients are listed for each correlation graph.
To start the SASR cycle we performed AssignFit for the four Val peaks, using an ideal helix with uniform backbone dihedral angles (φ)=-60, ψ=-45) for the 50-residue fd coat protein (Fig. 5A). Since there is a single Leu (L41) in the transmembrane helix of the coat protein, assignment of its peak was held fixed in all AssignFit calculations. The lowest RMSDtot and Etot assignment is shown in Fig. 4A (test #1). This result generates a rigid body orientation of the starting model (Fig. 5B) similar to the membrane orientation of fd in the previously determined structure (Fig. 5D; [18]). The next best assignment of the Val peaks (test #2) swaps the labels of V29 and V33. These residues occupy similar positions along the α-helix (Fig. 5) and their peaks have overlapped 15N chemical shifts. However, swapping their assignments results in significantly higher values of RMSDtot and Etot, enabling the AssignFit results to be differentiated. Refinement of the starting model using the Leu41 and Val DC and CSA restrains assigned in test #1, followed by another AssignFit search for the Val assignments, yields a calculated spectrum with excellent fit to the experimental data (Fig. 4A), and corresponding values of RMSDtot and Etot that are much lower and much more differentiated from the other test assignments than those obtained before refinement.
Figure 5. Structural model refinement of the transmembrane domain for the membrane-bound fd-coat protein.
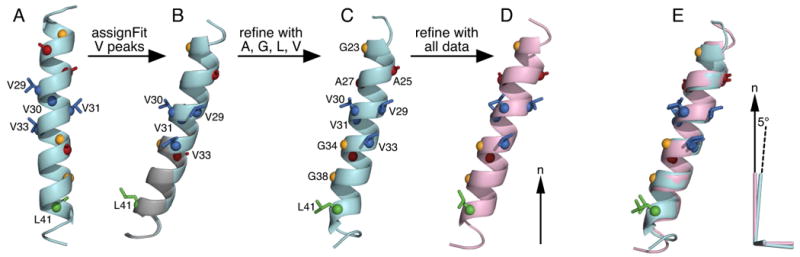
Coordinates are oriented in the frame of the lipid bilayer, relative to the lipid bilayer normal (n; arrow). (A) Ideal helix structural model (arbitrary orientation) used to initiate the SASR cycle. (B) Rigid body orientations of the starting structural model obtained for the lowest (cyan) and second lowest (gray) RMSDtot AssignFit assignment of the Val peaks. Swapping the assignments of V29 and V33 has little effect on model orientation. (C) Structure obtained after refinement with the DC and CSA restraints from Leu, Val, Ala and Gly. (D) Structure obtained after refinement with the DC and CSA restraints from all of the previously measured DC and CSA restraints [18]. (E) The AGLV-refined structure (cyan) is aligned to the all-data-refined structure (pink). The cyan and pink axes represent the order tensors for the respective structures. The pink principal axis coincides with the lipid bilayer normal, while the cyan principal axis is off by 5°. Alignment was obtained for the backbone Cα atoms.
The Leu/Val-refined model was subsequently used in a second SASR cycle where AssignFit was used to assign the Ala peaks while the assignments for L41 and Val were held fixed, and the assigned Ala restrains were used together with those for Leu and Val in a second refinement step. Finally, the resulting Leu/Val/Ala-refined model was used in a third SASR cycle, where AssignFit was used to assign the Gly peaks, and the assigned Gly restrains were used together with those for Leu, Val, and Ala in a third and final refinement step. Note that the peaks for G23 and G34 are overlapped, and their assignment can be swapped with little consequence for model refinement or spectrum back-calculation, as evidenced by the similar values of RMSDtot and Etot observed for test assignments #1 and #2 where this occurs (Fig. 4C).
The resulting structure of the fd transmembrane domain (residues 19 to 46) determined by SASR using only Leu, Val, Ala and Gly restraints compares very favorably (average backbone RMSD = 1.0 Å) with the structure determined using DC and CSA restraints for all residues [18]. Notably, the three-dimensional membrane orientation, which is an integral part of this structure determination method, is also reproduced very well (axially within 5°; Fig. 5E). Finally, the spectrum that is back-calculated during the last refinement step correlates very well with the experimentally measured spectrum of 15N-uniformly labeled fd coat protein (Fig. 4D), with excellent correlation coefficients (R2) for both 1H-15N DC and 15N CSA frequencies (Fig. 4E, 4F); these values provide a quantitative estimate of the agreement between the refined structure and the experimental data.
The results illustrate two important aspects of the SASR method: (1) structure refinement is obtained simultaneously with resonance assignment, and (2) complete resonance assignment is not required. The inclusion of additional assigned restraints will improve both structural accuracy and precision, but a very reasonable backbone structure can be obtained even with a few gaps in the restraints coverage of the amino acid sequence. The examples described in this paper are for double resonance 1H/15N spectra, however AssignFit and SASR can include both 1H/13C DC and 13C CSA data. This would additionally enhance the confidence in assignment selection and improve structural refinement by providing an additional set of restraints.
AssignFit parameter optimization
The values of RMSDtot and Etot calculated for each test assignment of AssignFit depend on the user-defined parameter Da and on the relative values of the DC and CSA force constants (DCscale, CSAscale). The effects of these parameters are illustrated in Fig. 6, for both OmpX and fd coat protein. Viewing RMSDtot as a function of both Da and the ratio of the force constants (CSAscale/DCscale) indicates that, for both proteins, the best fit to the experimental data is obtained when Da=8.5 kHz and when CSAscale/DCscale=0.01. For OmpX, the value of Da=8.5 kHz is in line with the order parameter expected for magnetically aligned bilayers. However, the fd coat protein incorporated in glass-aligned lipid bilayers would be expected to exhibit higher order, with Da=10 kHz, which was the value of Da used in all AssignFit calculations. Indeed, we observed that upon refinement with additional assignments of Ala and Gly, the optimum value of Da (yielding the lowest RMSDtot) shifted to 10 kHz for fd, while that of OmpX remained constant at 8.5 kHz.
Figure 6. Dependence of AssignFit RMSDtot and Etot on the value of Da and the relative DC and CSA force constants.

Data are shown for the best AssignFit test assignments of the seven Phe peaks of OmpX (left) and of the four Val peaks of fd (right). (A) Contour plots, and (B-E) related 2D slices, showing RMSDtot as a function of Da and the relative force constants for DC and CSA (CSAscale/DCscale; note the log scale). The lowest RMSDtot (blue) is obtained when Da∼8-9 kHz and CSAscale/DCscale=0.01. The highest RMSDtot (magenta) is obtained for Da values outside the expected range. (B) Effect of Da on RMSDtot. (C) Effect of Da on Etot (note the log scale). (D) Effect of CSAscale/DCscale on RMSDtot. (E) Effect of CSAscale/DCscale on Etot (note the log scales for both axes).
The optimal ratio of the DC and CSA force constants between 0.1 and 0.01 reflects the optimum balance between the effects of DC and CSA restraints in the calculation. It is the region where both DC and CSA contribute equally to the assignment determination. When CSAscale/DCscale>0.1, the CSA makes a disproportionate contribution; in contrast, when CSAscale/DCscale<0.1, the DC frequency takes over and controls the result. Both cases have the potential of skewing the AssignFit result towards a poor fit with the experimental data.
For both OmpX and fd coat protein, the assignment with best fit between structure and experiment displays a minimum in both RMSDtot and Etot at the optimal value of Da (Fig. 6B, C). However, while RMSDtot is also minimal at the optimal value of CSAscale/DCscale (Fig. 6D), the same is not true for Etot, which always reflects the actual values of the force constants used and, thus, always increases with increasing CSAscale and DCscale (Fig. 6E). Therefore, while both RMSDtot and Etot are useful parameters for quantitatively assessing confidence in each AssignFit result, RMSDtot is better suited for this purpose, since it always yields a minimum for the best-fit assignment. Indeed, we find that the best results are obtained when we select assignments based on the lowest RMSDtot.
3. Conclusions
The recent development of bioinformatics methods for predicting protein structure, either by comparative homology modeling based on amino acid sequence similarity to a protein of known structure [32, 33], or by de novo methods based on database searches for low energy conformations compatible with the target amino acid sequence [34-39], enable structural models of proteins, including membrane proteins, to be generated. Our interest is not in obtaining the most precise structure from these statistical methods but rather to obtain effective starting structural models that will enable AssignFit and SASR to assign experimental solid-state NMR orientation restraints, which can then be used for structural refinement directed toward the calculation of atomic resolution structures with high accuracy and precision. Furthermore, orientation restraints measured for membrane proteins in lipid bilayer membranes can also be used to refine NMR or crystal structures determined in detergents, to obtain membrane-specific structural information that more closely resembles the native environment [22, 25]. Regardless of the provenance of the starting model, even a few DC and CSA measurements can provide effective orientation restraints enabling some structural information to be obtained prior to complete resonance assignment. AssignFit facilitates the SASR process by minimizing the difference between experimentally observed spectral frequencies and the frequencies calculated from a structural model. Its incorporation in the XPLOR-NIH package further facilitates its use in combination with simulated annealing for structure refinement.
4. Method
Computer Programs
All calculations were performed with the XPLOR-NIH molecular structure determination package [26]. Molecular structures were analyzed and visualized with Pymol [40]. A set of example scripts and input data files are provided with XPLOR-NIH release 2.29.
Initial Structural Models
The 50-residue ideal α-helix used as initial model for the fd coat protein was generated from extended random coil coordinates using a high temperature simulated annealing protocol [41] in XPLOR-NIH, restrained by uniform (ϕ = -65°, ψ = -40°), tight (±0.1°) backbone dihedral angles, imposed with a force constant of 1000 kcal mol-1 rad-2. The coordinates of the 1.90 Å crystal structure of OmpX [30] were obtained from the Protein Data Bank (PDB) (1QJ8). After adding missing hydrogens, the structure was subjected to Cartesian coordinate Powell minimization as described [25].
AssignFit Parameters
The parameters used in the AssignFit calculations are listed in Table 1. User-defined parameters include the values of Da and Rh, specifying molecular order in terms of the 1H/15N DC, the values of the force constants for the DC and CSA potentials, and the value of Rspec specifying the relative spectral resolution used to calculate RMSDtot. It is also possible to provide specific values for the magnitudes and molecular orientation of the chemical shift tensor. Previously we noted that residue-specific variations in the 15N chemical shift tensor are minor compared to the spectral manifestation of molecular orientation, indicating that 15N chemical shifts as well as dipolar couplings can be useful restraints for structure determination and refinement [18, 25]. This is also evidenced by the observation of the characteristic wheel like patterns in the spectra of aligned membrane proteins [9-11].
Table 1.
Potential Term Parameters used for AssignFit Calculation of the fd coat protein.
| RDCpot (DC restraints) |
| force constant = 1 kcal•sec2•mol-1 |
| Da = 10 kHz |
| Rh = 0 |
|
|
| CSApot (15N CSA restraints) a |
| force constant = 0.01 kcal•sec2 •mol-1 |
| DaScale = 20,000 |
| 15N tensor for non-Gly [51]: δiso=119 ppm, δ11=-42.3 ppm, δ22=-55.3 ppm, δ33=97.7 ppm, β=17°, γ=0° |
| 15N tensor for Gly [52]: δiso=105 ppm, δ11=-41.0 ppm, δ22=-64.0 ppm, δ33=105.0 ppm, β=20°, γ=0° |
Values are reported following the convention |δ33|>|δ22|>|δ11|; the angle β is between δ33 and the NH bond and the angle γ is between δ22 and the axis normal to the peptide plane.
For solid-state NMR experiments with membrane proteins in either glass aligned (e.g. for fd coat protein) or magnetically aligned (e.g. for OmpX) lipid bilayer samples, the order tensor (S) is set by the sample's liquid crystalline geometry. Order is axially symmetric around the bilayer normal (n), which can be either parallel or perpendicular to the magnetic field (Bo), resulting in net axial alignment of Szz = 1.0 for n‖Bo and Szz = -0.5 for n⊥Bo, and null rhombicity (Rh = 2/3(Sxx-Syy)/Szz = 0) [42-45].
The axial alignment parameter, Da, incorporates both the values of Szz and of Dmax, the maximum DC expected for a static NH bond of a given bond length (Da = ½•Szz•Dmax). For an NH bond length of 1.07 Å and corresponding Dmax=20 kHz, values of Da =10 kHz and Da =-5 kHz are expected for fully ordered bilayers with n‖Bo and n⊥Bo, respectively. Glass-aligned lipid bilayers are highly ordered and typically exhibit an overall order parameter for internal motion close to 1.0, whereas for magnetically aligned bilayers, axially symmetric motional averaging scales Szz by a factor in range from 0.9 to 0.8.
The CSA alignment tensor was normalized to the maximum value of DC by setting the user-defined XPLOR-NIH AssignFit parameter, DaScale, equal to 20 kHz. The CSA for each residue was calculated by subtracting the isotropic 15N chemical shift frequency (δiso) from the orientation-dependent chemical shift frequency measured in the solid-state NMR SLF spectra of the aligned protein; similarly, the CSA values calculated in AssignFit or after structural refinement were converted to orientation-dependent frequencies by adding δiso.
Parameters used for Structure Refinement
Refinement of OmpX with the DC and CSA restraints for the 7 Phe residues was as described previously [25]. For refinement of the fd coat protein, the DC and CSA energy terms were minimized as described [46, 47], after obtaining the appropriate assignments with AssignFit. Additional restraints included loosely imposed (±15°) backbone dihedral angles, derived from the predicted secondary structure, and the torsion angle potential of mean force [48, 49]. Finally, energy terms were included to enforce covalent geometry (bonds, bond-angles and improper dihedral angles) and prevent atomic overlap (via the standard repulsive quartic Van der Waal term).
Structure refinement was performed with a simulated annealing protocol consisting of a 10 ps, variable timestep, torsion angle molecular dynamics [50] phase at a temperature of 300K, followed by simulated annealing from 300K to 20K, in 10K increments at each step of 2 ps torsion-angle molecular dynamics. Finally, gradient minimization was performed in Cartesian coordinates. The schedule for the force constants is specified in Table 2. A total of 100 structures were calculated and those with covalent or dihedral restraint violations were discarded. The remainder was sorted using experimental, dihedral and covalent energies. The structure with the lowest energy was used as the initial structure in the next SASR cycle.
Table 2.
Potential Term Parameters used for Structure Refinement.
| Potential | Force constant | 300K Dynamics | 300-20K Simulated Annealing |
|---|---|---|---|
|
| |||
| SANI (DC restraints) | (kcal•sec2•mol-1) | 0.1 | 0.1-1.0 |
| DCSA (CSA restraints) | (kcal•sec2•mol-1) | 0.001 | 0.001-0.01 |
| CDIH (predicted dihedral restraints) | (kcal•mol-1•rad-2) | 300 | 300 |
| RAMA (knowledge-based dihedral restraints) | (kcal•mol-1) | 0.02 | 0.02-2.0 |
| ANG (bond angle) | (kcal•mol-1•rad-2) | 0.4 | 0.4-1.0 |
| IMPR (improper dihedral angle) | (kcal•mol-1•rad-2) | 0.1 | 0.1-1.0 |
| VDWa (non-bonded atom-atom repulsion) | (kcal•mol-1•Å-4) | 0.004 | 0.004-4.0 |
Atomic radii are scaled by 0.4 during initial dynamics and minimization and scaled by a value ramped from 0.4 to 0.8 during simulated annealing.
Figure 7.

Highlights.
AssignFit is a program for assignment of solid-state NMR anisotropic restraints.
AssignFit is a program within the XPLOR-NIH package.
It minimizes the difference between experiment and data calculated from a structural model.
The methods are demonstrated for α-helical and β-barrel integral membrane proteins.
Acknowledgments
This research was supported by a grant from the National Institutes of Health (R21GM094727). It utilized the Biotechnology Research Center for NMR Molecular Imaging of Proteins at UCSD (P41EB002031) and the NIH-supported NMR Facility at the Sanford Burnham Medical Research Institute (P30CA030199). C.D.S. was supported by the NIH Intramural Research Program of the Center for Information Technology.
Footnotes
Publisher's Disclaimer: This is a PDF file of an unedited manuscript that has been accepted for publication. As a service to our customers we are providing this early version of the manuscript. The manuscript will undergo copyediting, typesetting, and review of the resulting proof before it is published in its final citable form. Please note that during the production process errors may be discovered which could affect the content, and all legal disclaimers that apply to the journal pertain.
References
- 1.Tian F, Valafar H, Prestegard JH. A dipolar coupling based strategy for simultaneous resonance assignment and structure determination of protein backbones. J Am Chem Soc. 2001;123:11791–11796. doi: 10.1021/ja011806h. [DOI] [PubMed] [Google Scholar]
- 2.Hus JC, Prompers JJ, Bruschweiler R. Assignment strategy for proteins with known structure. J Magn Reson. 2002;157:119–123. doi: 10.1006/jmre.2002.2569. [DOI] [PubMed] [Google Scholar]
- 3.Jung YS, Zweckstetter M. Backbone assignment of proteins with known structure using residual dipolar couplings. J Biomol NMR. 2004;30:25–35. doi: 10.1023/B:JNMR.0000042955.14647.77. [DOI] [PubMed] [Google Scholar]
- 4.Jung YS, Sharma M, Zweckstetter M. Simultaneous assignment and structure determination of protein backbones by using NMR dipolar couplings. Angew Chem Int Ed Engl. 2004;43:3479–3481. doi: 10.1002/anie.200353588. [DOI] [PubMed] [Google Scholar]
- 5.Meiler J, Baker D. Rapid protein fold determination using unassigned NMR data. Proc Natl Acad Sci U S A. 2003;100:15404–15409. doi: 10.1073/pnas.2434121100. [DOI] [PMC free article] [PubMed] [Google Scholar]
- 6.Grishaev A, Llinas M. CLOUDS, a protocol for deriving a molecular proton density via NMR. Proc Natl Acad Sci U S A. 2002;99:6707–6712. doi: 10.1073/pnas.082114199. [DOI] [PMC free article] [PubMed] [Google Scholar]
- 7.Grishaev A, Llinas M. Protein structure elucidation from NMR proton densities. Proc Natl Acad Sci U S A. 2002;99:6713–6718. doi: 10.1073/pnas.042114399. [DOI] [PMC free article] [PubMed] [Google Scholar]
- 8.Bermejo GA, Llinas M. Deuterated protein folds obtained directly from unassigned nuclear overhauser effect data. J Am Chem Soc. 2008;130:3797–3805. doi: 10.1021/ja074836e. [DOI] [PMC free article] [PubMed] [Google Scholar]
- 9.Marassi FM, Opella SJ. A solid-state NMR index of helical membrane protein structure and topology. J Magn Reson. 2000;144:150–155. doi: 10.1006/jmre.2000.2035. [DOI] [PMC free article] [PubMed] [Google Scholar]
- 10.Wang J, Denny J, Tian C, Kim S, Mo Y, Kovacs F, Song Z, Nishimura K, Gan Z, Fu R, Quine JR, Cross TA. Imaging membrane protein helical wheels. J Magn Reson. 2000;144:162–167. doi: 10.1006/jmre.2000.2037. [DOI] [PubMed] [Google Scholar]
- 11.Marassi FM. A simple approach to membrane protein secondary structure and topology based on NMR spectroscopy. Biophys J. 2001;80:994–1003. doi: 10.1016/S0006-3495(01)76078-X. [DOI] [PMC free article] [PubMed] [Google Scholar]
- 12.Opella SJ, Marassi FM. Structure determination of membrane proteins by NMR spectroscopy. Chem Rev. 2004;104:3587–3606. doi: 10.1021/cr0304121. [DOI] [PMC free article] [PubMed] [Google Scholar]
- 13.Page RC, Li C, Hu J, Gao FP, Cross TA. Lipid bilayers: an essential environment for the understanding of membrane proteins. Magn Reson Chem. 2007;45:S2–S11. doi: 10.1002/mrc.2077. [DOI] [PubMed] [Google Scholar]
- 14.Kovacs FA, Cross TA. Transmembrane four-helix bundle of influenza A M2 protein channel: structural implications from helix tilt and orientation. Biophys J. 1997;73:2511–2517. doi: 10.1016/S0006-3495(97)78279-1. [DOI] [PMC free article] [PubMed] [Google Scholar]
- 15.Cady SD, Goodman C, Tatko CD, DeGrado WF, Hong M. Determining the orientation of uniaxially rotating membrane proteins using unoriented samples: a 2H, 13C, AND 15N solid-state NMR investigation of the dynamics and orientation of a transmembrane helical bundle. J Am Chem Soc. 2007;129:5719–5729. doi: 10.1021/ja070305e. [DOI] [PubMed] [Google Scholar]
- 16.Marassi FM, Das BB, Lu GJ, Nothnagel HJ, Park SH, Son WS, Tian Y, Opella SJ. Structure Determination of Membrane Proteins in Five Easy Pieces. Methods. 2011 doi: 10.1016/j.ymeth.2011.09.009. in press. [DOI] [PMC free article] [PubMed] [Google Scholar]
- 17.Ketchem RR, Hu W, Cross TA. High-resolution conformation of gramicidin A in a lipid bilayer by solid-state NMR. Science. 1993;261:1457–1460. doi: 10.1126/science.7690158. [DOI] [PubMed] [Google Scholar]
- 18.Marassi FM, Opella SJ. Simultaneous assignment and structure determination of a membrane protein from NMR orientational restraints. Protein Sci. 2003;12:403–411. doi: 10.1110/ps.0211503. [DOI] [PMC free article] [PubMed] [Google Scholar]
- 19.Park SH, Mrse AA, Nevzorov AA, Mesleh MF, Oblatt-Montal M, Montal M, Opella SJ. Three-dimensional structure of the channel-forming trans-membrane domain of virus protein “u” (Vpu) from HIV-1. J Mol Biol. 2003;333:409–424. doi: 10.1016/j.jmb.2003.08.048. [DOI] [PubMed] [Google Scholar]
- 20.De Angelis AA, Howell SC, Nevzorov AA, Opella SJ. Structure determination of a membrane protein with two trans-membrane helices in aligned phospholipid bicelles by solid-state NMR spectroscopy. J Am Chem Soc. 2006;128:12256–12267. doi: 10.1021/ja063640w. [DOI] [PMC free article] [PubMed] [Google Scholar]
- 21.Sharma M, Yi M, Dong H, Qin H, Peterson E, Busath DD, Zhou HX, Cross TA. Insight into the mechanism of the influenza A proton channel from a structure in a lipid bilayer. Science. 2010;330:509–512. doi: 10.1126/science.1191750. [DOI] [PMC free article] [PubMed] [Google Scholar]
- 22.Franzin CM, Teriete P, Marassi FM. Structural similarity of a membrane pro t ein in micelles and membranes. J Am Chem Soc. 2007;129:8078–8079. doi: 10.1021/ja0728371. [DOI] [PMC free article] [PubMed] [Google Scholar]
- 23.Nevzorov AA, Opella SJ. Structural fitting of PISEMA spectra of aligned proteins. J Magn Reson. 2003;160:33–39. doi: 10.1016/s1090-7807(02)00138-6. [DOI] [PubMed] [Google Scholar]
- 24.Asbury T, Quine JR, Achuthan S, Hu J, Chapman MS, Cross TA, Bertram R. PIPATH: an optimized algorithm for generating alpha-helical structures from PISEMA data. J Magn Reson. 2006;183:87–95. doi: 10.1016/j.jmr.2006.07.020. [DOI] [PubMed] [Google Scholar]
- 25.Mahalakshmi R, Marassi FM. Orientation of the Escherichia coli outer membrane protein OmpX in phospholipid bilayer membranes determined by solid-State NMR. Biochemistry. 2008;47:6531–6538. doi: 10.1021/bi800362b. [DOI] [PMC free article] [PubMed] [Google Scholar]
- 26.Schwieters CD, Kuszewski JJ, Tjandra N, Clore GM. The Xplor-NIH NMR molecular structure determination package. J Magn Reson. 2003;160:65–73. doi: 10.1016/s1090-7807(02)00014-9. [DOI] [PubMed] [Google Scholar]
- 27.Clore GM, Schwieters CD. How much backbone motion in ubiquitin is required to account for dipolar coupling data measured in multiple alignment media as assessed by independent cross-validation? J Am Chem Soc. 2004;126:2923–2938. doi: 10.1021/ja0386804. [DOI] [PubMed] [Google Scholar]
- 28.Zweckstetter M. Determination of molecular alignment tensors without backbone resonance assignment: Aid to rapid analysis of protein-protein interactions. J Biomol NMR. 2003;27:41–56. doi: 10.1023/a:1024768328860. [DOI] [PubMed] [Google Scholar]
- 29.Denny JK, Wang J, Cross TA, Quine JR. PISEMA powder patterns and PISA wheels. J Magn Reson. 2001;152:217–226. doi: 10.1006/jmre.2001.2405. [DOI] [PubMed] [Google Scholar]
- 30.Vogt J, Schulz GE. The structure of the outer membrane protein OmpX from Escherichia coli reveals possible mechanisms of virulence. Structure. 1999;7:1301–1309. doi: 10.1016/s0969-2126(00)80063-5. [DOI] [PubMed] [Google Scholar]
- 31.Fernandez C, Adeishvili K, Wuthrich K. Transverse relaxation-optimized NMR spectroscopy with the outer membrane protein OmpX in dihexanoyl phosphatidylcholine micelles. Proc Natl Acad Sci U S A. 2001;98:2358–2363. doi: 10.1073/pnas.051629298. [DOI] [PMC free article] [PubMed] [Google Scholar]
- 32.Marti-Renom MA, Stuart AC, Fiser A, Sanchez R, Melo F, Sali A. Comparative protein structure modeling of genes and genomes. Annu Rev Biophys Biomol Struct. 2000;29:291–325. doi: 10.1146/annurev.biophys.29.1.291. [DOI] [PubMed] [Google Scholar]
- 33.Domingues FS, Lackner P, Andreeva A, Sippl MJ. Structure-based evaluation of sequence comparison and fold recognition alignment accuracy. J Mol Biol. 2000;297:1003–1013. doi: 10.1006/jmbi.2000.3615. [DOI] [PubMed] [Google Scholar]
- 34.Baker D, Sali A. Protein structure prediction and structural genomics. Science. 2001;294:93–96. doi: 10.1126/science.1065659. [DOI] [PubMed] [Google Scholar]
- 35.Srinivasan R, Rose GD. Ab initio prediction of protein structure using LINUS. Proteins. 2002;47:489–495. doi: 10.1002/prot.10103. [DOI] [PubMed] [Google Scholar]
- 36.Ozkan SB, Wu GA, Chodera JD, Dill KA. Protein folding by zipping and assembly. Proc Natl Acad Sci U S A. 2007;104:11987–11992. doi: 10.1073/pnas.0703700104. [DOI] [PMC free article] [PubMed] [Google Scholar]
- 37.Yarov-Yarovoy V, Schonbrun J, Baker D. Multipass membrane protein structure prediction using Rosetta. Proteins. 2006;62:1010–1025. doi: 10.1002/prot.20817. [DOI] [PMC free article] [PubMed] [Google Scholar]
- 38.Barth P, Schonbrun J, Baker D. Toward high-resolution prediction and design of transmembrane helical protein structures. Proc Natl Acad Sci U S A. 2007;104:15682–15687. doi: 10.1073/pnas.0702515104. [DOI] [PMC free article] [PubMed] [Google Scholar]
- 39.Das R, Baker D. Macromolecular modeling with rosetta. Annu Rev Biochem. 2008;77:363–382. doi: 10.1146/annurev.biochem.77.062906.171838. [DOI] [PubMed] [Google Scholar]
- 40.DeLano WL. PyMol. 2005 www.pymol.org.
- 41.Nilges M, Clore GM, Gronenborn AM. Determination of three-dimensional structures of proteins from interproton distance data by dynamical simulated annealing from a random array of atoms. Circumventing problems associated with folding. FEBS Lett. 1988;239:129–136. doi: 10.1016/0014-5793(88)80559-3. [DOI] [PubMed] [Google Scholar]
- 42.Sanders CR, Hare B, Howard KP, Prestegard JH. Magnetically-oriented phospholipid micelles as a tool for the study of membrane-associated molecules. Progr NMR Spectrosc. 1994;26:421–444. [Google Scholar]
- 43.Bax A, Kontaxis G, Tjandra N. Dipolar couplings in macromolecular structure determination. Methods Enzymol. 2001;339:127–174. doi: 10.1016/s0076-6879(01)39313-8. [DOI] [PubMed] [Google Scholar]
- 44.Prestegard JH, Bougault CM, Kishore AI. Residual dipolar couplings in structure determination of biomolecules. Chem Rev. 2004;104:3519–3540. doi: 10.1021/cr030419i. [DOI] [PubMed] [Google Scholar]
- 45.De Angelis AA, Jones DH, Grant CV, Park SH, Mesleh MF, Opella SJ. NMR experiments on aligned samples of membrane proteins. Methods Enzymol. 2005;394:350–382. doi: 10.1016/S0076-6879(05)94014-7. [DOI] [PubMed] [Google Scholar]
- 46.Clore GM, Gronenborn AM, Tjandra N. Direct structure refinement against residual dipolar couplings in the presence of rhombicity of unknown magnitude. J Magn Reson. 1998;131:159–162. doi: 10.1006/jmre.1997.1345. [DOI] [PubMed] [Google Scholar]
- 47.Lipsitz RS, Tjandra N. 15N chemical shift anisotropy in protein structure refinement and comparison with NH residual dipolar couplings. J Magn Reson. 2003;164:171–176. doi: 10.1016/s1090-7807(03)00176-9. [DOI] [PubMed] [Google Scholar]
- 48.Kuszewski J, Gronenborn AM, Clore GM. Improving the quality of NMR and crystallographic protein structures by means of a conformational database potential derived from structure databases. Protein Sci. 1996;5:1067–1080. doi: 10.1002/pro.5560050609. [DOI] [PMC free article] [PubMed] [Google Scholar]
- 49.Kuszewski J, Gronenborn AM, Clore GM. Improvements and extensions in the conformational database potential for the refinement of NMR and X-ray structures of proteins and nucleic acids. J Magn Reson. 1997;125:171–177. doi: 10.1006/jmre.1997.1116. [DOI] [PubMed] [Google Scholar]
- 50.Schwieters CD, Clore GM. Internal coordinates for molecular dynamics and minimization in structure determination and refinement. J Magn Reson. 2001;152:288–302. doi: 10.1006/jmre.2001.2413. [DOI] [PubMed] [Google Scholar]
- 51.Wu C, Ramamoorthy A, Gierasch LM, Opella SJ. Simultaneous characterization of the amide 1H chemical shift, 1H-15N dipolar, and 15N chemical shift interaction tensors in a peptide bond by 3-dimensional solid-state NMR spectroscopy. J Am Chem Soc. 1995;117:6148–6149. [Google Scholar]
- 52.Oas TG, Hartzell CJ, Dahlquist W, Drobny GP. The amide 15N chemical shift tensors of four peptides determined from 13C dipole-coupled chemical shift powder patterns. J Am Chem Soc. 1987;109:5962–5966. [Google Scholar]