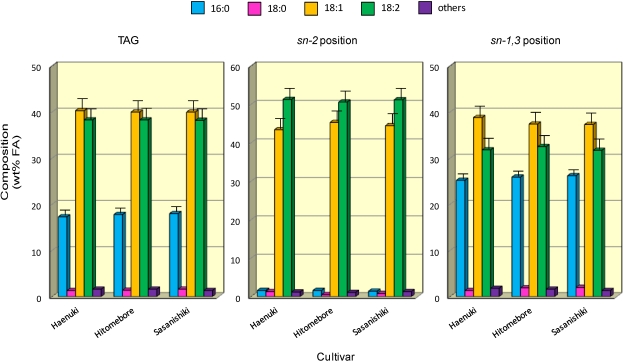
Figure 4.
Composition and positional distribution of FA in TAG prepared from rice brans. Each value represents the average of three determinations, and vertical bars depict the mean and standard deviation. “Others” include minor FA such as 14:0, 16:1, 18:3 and 20:0. For abbreviations, see Figure 1.

