Figure 6.
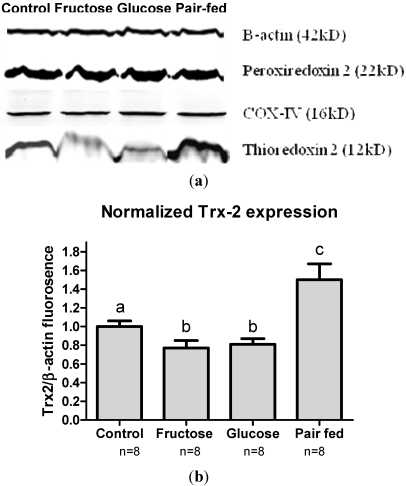
(a) Western blots of mitochondrial (Trx2) and cytoplasmic (Prx2) redox proteins in the liver in different study groups. Equal amounts of protein were loaded (20 µg) in each well as indicated by similar β-actin abundance. Similar abundance of COX-IV (mitochondrial control) indicated equal loading of mitochondrial protein. Similar Prx2 abundance signifies no oxidative stress in cytoplasm. Trx2 abundance was decreased in fructose and glucose but increased in pair fed group; (b) When normalized to β-actin, Trx2 abundance decreased in fructose (77%) and glucose (80%) groups while it increased in pair fed (150%) group compared to control (100%). This indicates mitochondrial predisposition to oxidative stress in fructose and glucose groups. Different letters (a,b,c) indicate statistically significant difference among respective groups.

