Abstract
Background
In July 2001, positron emission tomography (PET) became a covered service for Medicare beneficiaries when used for diagnosis, staging and restaging of non-small cell lung, esophageal, colorectal and head and neck cancers, lymphoma, and melanoma. Whether physicians use PET as a replacement or in addition to computed tomography [CT], magnetic resonance imaging [MRI], or bone scintigraphy [BS] is uncertain.
Methods
We used a 20% sample of Medicare fee-for-service beneficiaries age >64 from 2004 thorough 2008. Annually for each cancer type, we created a cohort of patients defined by having at least one admission with a primary cancer diagnosis or two non-hospital claims with a cancer diagnosis at least 7 days apart per calendar year. Each year, we counted imaging claims and claim-days by modality and cancer type. We examined the sequence of PET use as before, after, or instead of other imaging.
Results
About 125,000 beneficiaries or 2.5% of the cohort met our cancer definition each year. In 2008, the combined annual imaging days per person-year were 2.3 CT, 0.49 MRI, 0.70 PET, and 0.13 BS. The annual rates of imaging from 2004 to 2008 increased 0.5% for CT, 3.2% for MRI and 18.0% for PET (range 14.6% to 19.9% by cancer type), and decreased 12.7% for BS. The growth in PET use was not associated with meaningful changes in body CT. In 2007–2008, a body CT preceded PET within 30 days in about one-half of patients whereas a PET preceded CT in only 22%.
Conclusion
Several years after its introduction, PET continued to grow rapidly with evidence that it is replacing BS. Growth of PET occurred without evidence of a decline in body CT. About half of PET use occurred shortly after body CT, suggesting an additive or final arbiter role.
Keywords: Positron Emission tomography, computed tomography, magnetic resonance imaging, bone scintigraphy, time trends, lung neoplasms, colorectal neoplasms, melanoma, lymphomas, head and neck neoplasms, esophageal neoplasms, elderly, United States, practice patterns, Medicare
Introduction
Medical imaging serves an integral role at most decision points in cancer care from diagnosis and initial staging to termination of therapy for metastatic disease. Advanced imaging use evolved in a disorderly manner after the introduction of computed tomography (CT) and, subsequently, magnetic resonance imaging (MRI). In the absence of randomized trials, appropriateness criteria based on expert opinion using clinical vignettes have been the predominant source of practice guidelines.1–3
Over the last decade, four trends arose related to cancer imaging. First, the costs of chemotherapies and targeted agents increased rapidly.4 If cancer imaging could guide the effective use of these therapies, then increased imaging would be more easily defended. Second, the overall costs of medical imaging (not just for cancer) doubled between 2000 and 2006.5,6 Third, CT and MRI scan volume rose dramatically—9.5% per year for CT and 13.1% for MRI between 1998 and 2005—and shifted from predominantly hospital-based sites to freestanding outpatient sites.5,7,8 Fourth, positron emission tomography (PET) using 18F-fluorodeoxyglucose (FDG) and integrated PET/CT (together referred to hereinafter as PET) —a new technology based on a paradigm of characterizing metabolic processes rather than anatomy—was introduced for use in selected cancers. In July 2001,9 the Centers for Medicare & Medicaid Services (CMS) approved reimbursement for PET imaging for evaluating beneficiaries across the natural history—diagnosis, initial staging and restaging—for six cancer types (non-small cell lung, esophageal, colorectal, and head and neck cancers, as well as lymphoma and melanoma).
It remains uncertain whether the growth in PET following the 2001 CMS coverage decision was associated with declines in other imaging. In this report, we assess for 2004 through 2008 the temporal trends in PET use compared to concurrent use of CT, MRI and bone scintigraphy (BS) for these common cancer types. In addition, we assessed the temporal clustering and sequencing of PET use as “new” relative to “established” technologies (i.e., CT, MR, BS) to characterize its role as an additive vs. replacement tool.
Methods
Design Overview
To characterize changes in cancer imaging following the 2001 CMS coverage decision for PET, we evaluated Medicare fee-for-service (FFS) claims for cancer beneficiaries identified annually over the period 2004 to 2008. We used these data to examine the rates and sequencing of advanced cancer imaging. The institutional review board at Dartmouth Medical School approved this study.
Settings and Participants
For each of these five years, we assessed a 20% sample of FFS beneficiaries who were at least age 65 as of January 1, enrolled in both Medicare Part A and B, and not enrolled for any part of the year in a Medicare managed care program. The advantages of the 20% sample, compared to the more commonly used 5% sample, are the larger counts of relatively uncommon events (e.g., cancers of the head and neck, esophagus and melanoma). For each year, we determined whether a beneficiary had a cancer type to be included in the analysis cohort for that year. We used the International Classification of Diseases 9th edition (ICD-9) to categorize cancer types as follows: head and neck (140–149, 160, 161), esophagus (150), colorectal (153, 154), non-small cell lung cancer (162), malignant melanoma (172) and lymphoma (200–202). Inclusion of a patient in the annual cancer case cohort (denominator) required either: a) a hospital admission for which the principal discharge diagnosis was one of the ICD-9 codes above; or b) two non-hospital claims (primarily physician part B for office-based visits, procedures or imaging) occurring at least 7 days apart but in the 12 months of that year with one of the primary cancer diagnosis ICD-9 codes above on both claims. The requirement for at least 2 claims involving physician contact at least 7 days apart is commonly used in other analyses of administrative data to the reduce the likelihood of erroneously including a claim submitted, albeit incorrectly, with a “rule out” diagnosis.10 The date of admission or the first of two outpatient claims defined each subject’s date of entry to the cohort in any given year. We explicitly did not include claims for hospice or home health care since our intent was to evaluate beneficiaries undergoing active cancer management.
These criteria were applied for defining the cohort in each of the years, i.e., inclusion of any individual patient in the cohort for any year was independent of that individual’s inclusion in a prior or subsequent year’s cohort. Our inclusion criteria were intended to identify a mixture of beneficiaries with newly diagnosed cancer, those having ongoing care or surveillance after treatment and those with recurrent cancer.
Definitions of Imaging Type
Table 1 gives the HCPCS and CPT codes used to define PET, CT, MRI and BS. More than 99% of PET and BS claims were for torso or whole-body imaging (skull-base to thigh for PET). For any year, PET and PET/CT claims were combined. For CT and, to a lesser extent for MRI, multiple claims on the same date for separate body areas were common (e.g., a chest, abdomen and pelvis CT) and counted as one imaging day. We counted both the CT and MRI claims per year as well as imaging days with CT, MRI or the combination. Once a beneficiary met our inclusion criteria for a given year, all CT and MRI claims during the remainder of that year were included.
Table 1.
Classification of Imaging Types and Body Area
| Imaging Type and Body Area | CPT coding (2008)41 |
|---|---|
| PET and PET/CT* | G0210–G0234, G0252–G0254, G0330–G0336, 78608, 78810, 78811–78813 (specifically PET) and 78814–78816 (specifically PET/CT) |
| CT | |
| Head | 70450, 70460, 70470 |
| Orbit, Sella, Posterior Fossa and Neck | 70480–70492 |
| Chest | 71250, 71260, 71270 |
| Abdomen | 74150, 74160, 74170 |
| Pelvis | 72192, 72193, 72194 |
| Other | 72125–72133, 73200–73205, 73700–73705, 76497 |
| MRI | |
| Brain | 70551–70553 |
| Spine | 72141–72158 |
| Other | 70540–70543, 76498,74181–74183, 73218–73220, 73221–73223, 73718–73719, 73721–73723, 76400, 76093–76094, 71550–71552, 75552–75556, 72195–72197,76498 |
| BS | 78300, 78305, 78306, 78315, 78320 |
Abbreviations: PET: positron emission tomography, CT: computed tomography, MRI: magnetic resonance imaging, BS: bone scintigraphy
In July 2005, coding for PET changed with the introduction of specific CPT codes based on type of PET imaging that replaced the HCPCS G-codes.
We excluded the procedure codes for imaging done concurrently with angiography, for therapy guidance or post-image processing/rendering. We counted only global and professional component claims to avoid double counting examinations with separate technical and professional component claims.
Statistical Analysis
The prevalence of cancer beneficiaries for each year was calculated as the number of patients in the cancer cohort for that year divided by the number of total beneficiaries in the Medicare FFS sample (tabulated from the Medicare Denominator File); this result was reported as the number per 1,000 beneficiaries. Cancer person-years, by individual cancer type or overall, were calculated as the time from first cancer claim to the sooner of the last claim day of the year or the date of death. The ratio of cancer person-years per cancer beneficiary varied by cancer type and paralleled expected survival rates—lowest for lung and esophageal cancers and highest for lymphoma.
The annual change from 2004 to 2008 in the rates of imaging by modality and cancer type were calculated based on the ratio of 2008 rates to 2004 rates, assuming a constant annual compounding.
Clustering and sequencing of other advanced imaging studies before and after PET and brain MRI were done for 2007 and 2008. For these years only PET/CT were evaluated and were >90% of all PET imaging. If oncologists were predominantly using PET as an “additive” imaging test to body CT (e.g., to confirm inconclusive CT findings or when the potentially greater sensitivity of PET/CT for detecting distant disease is necessary for treatment planning), then use of PET/CT would be expected to occur after body CT and within a short time interval. Targeted diagnostic CT (e.g., with contrast enhancement or multiphasic) after PET/CT should occur occasionally to better characterize lesions seen on PET/CT. The same reasoning applies to brain MRI as additional imaging after head CT.
While the full year was used for overall counts, for the clustering analysis only the first PET/CT or brain MRI occurring between February 1 and November 30 per year was flagged. For PET/CT, the number of body CT (chest, abdomen and/or pelvis) in the preceding 14 or 30 days and/or the succeeding 14 or 30 days was counted as an indicator of the frequency and timing of CT in relation to PET. To test whether PET occurred primarily before or after other imaging, for those individuals with a first PET instance paired with another imaging test either before or after, we used a one-sample test for proportions with a null hypotheses of equal (0.5) for the before proportion.
In a similar manner, the use of brain MRI within 14 or 30 days after a head CT was counted. We anticipated little clustering of PET/CT and brain MRI with the exception of one efficient sequence wherein an initial MRI suggests cerebral metastases and a subsequent body PET/CT is used to identify a primary cancer site.
Results
The number of beneficiaries, cancer cases and cancer person-years are shown in Table 2. From 2004 to 2008, the number of beneficiaries in the 20% FFS sample declined as more beneficiaries enrolled in Medicare Advantage plans. However, the demographics of the samples with respect to age (mean 75.5 years), gender (female 58.5%), and ethnicity (white 88.0%, black 7.5% and other 4.5%) all changed by ≤0.1% from one year to another.
Table 2.
Study Population, Cancer Cases and Person-years per 1,000 Medicare Beneficiaries
| 2004 | 2005 | 2006 | 2007 | 2008 | 2004 to 2008 | 2004 | 2005 | 2006 | 2007 | 2008 | 2004 to 2008 | |
|---|---|---|---|---|---|---|---|---|---|---|---|---|
| N | N | N | N | N | Change | Person-yrs | Person yrs | Person yrs | Person yrs | Person-yrs | Change | |
| 20% FFS sample (million)* | 5.41 | 5.37 | 5.21 | 5.10 | 5.02 | |||||||
| 6 cancer total† beneficiaries in year (1000s) | 126.7 | 127.1 | 125.8 | 124.9 | 123.7 | 80.3 | 80.8 | 81.0 | 81.0 | 80.9 | ||
| Cancer beneficiaries per 1,000 overall Medicare beneficiaries(% of 6 cancer total) | ||||||||||||
| Combined total | 23.4(100) | 23.6 (100) | 24.1 (100) | 24.5 (100) | 24.6 (100) | 5.1% | 14.8 (100) | 15.0 (100) | 15.5 (100) | 15.8 (100) | 16.1 (100) | 8.6% |
| Lung (% ) | 7.32 (31.3) | 7.42 (31.4) | 7.58 (31.4) | 7.76 (31.6) | 7.86 (31.9) | 7.3% | 3.98 (26.8) | 4.08 (27.2) | 4.25 (27.4) | 4.43 (28.0) | 4.54 (28.2) | 14.1% |
| Colon (%) | 7.40 (31.6) | 7.22 (30.6) | 7.20 (29.9) | 7.13 (29.1) | 6.98 (28.3) | −5.6% | 4.88 (32.9) | 4.78 (31.9) | 4.81 (29.1) | 4.77 (30.2) | 4.75 (29.4) | −2.8% |
| Lymphoma(%) | 4.60 (19.6) | 4.78 (20.2) | 5.04 (20.9) | 5.17 (21.1) | 5.24 (21.3) | 13.9% | 3.34 (22.5) | 3.46 (23.1) | 3.69 (23.8) | 3.81 (24.1) | 3.87 (24.0) | 16.0% |
| Head and Neck(%) | 1.86 (7.9) | 1.89 (8.0) | 1.89 (7.8) | 1.91 (7.8) | 1.95 (7.9) | 4.7% | 1.26 (8.5) | 1.28 (8.5) | 1.29 (8.3) | 1.30 (8.2) | 1.34 (8.3) | 6.5% |
| Malignant Melanoma (%) | 1.62 (6.9) | 1.69 (7.2) | 1.74 (7.2) | 1.83 (7.5) | 1.92 (7.8) | 18.2% | 1.03 (6.9) | 1.06 (7.1) | 1.11 (7.2) | 1.17 (7.4) | 1.22 (7.6) | 18.8% |
| Esophagus (%) | 0.62 (2.7) | 0.64 (2.7) | 0.67 (2.8) | 0.66 (0.27) | 0.68 (2.8) | 8.9% | 0.32 (2.3) | 0.36 (2.4) | 0.38 (2.4) | 0.38 (2.4) | 0.39 (2.4) | 11.3% |
20% FFS (fee-for service) Medicare sample. Number of beneficiaries (N), cancer cases, and person-years per 1,000 by cancer type from 2004 and 2008.
A beneficiary with cancer of a specific type per year was defined by having either: a) any admission with a primary diagnosis of one of the cancers types listed; or b) at least two non-hospital claims at least 7 days apart each with a primary diagnosis of one of the cancers listed within the 12 months of that year. For each cancer type, person-years per cancer type were determined by the time from the first to the last claim in any year that a beneficiary meets the above criteria for a cancer case.
Age, gender and ethnicity all changed by < 0.1 (or 0.1%) per year (see text)
Overall, the number of cases meeting our case definition per 1,000 beneficiaries increased for five of the six cancer types. The number of cancer cases/1,000 beneficiaries increased by 5.1% from 2004 to 2008. Increases in lymphoma (13.9%) and melanoma (18.2%) more than offset the decline in colorectal cancers (−5.6%).
The increases from 2004 to 2008 in person-years exceeded those for cancer cases for all six cancers. This is consistent with either improved survivorship and/or more claims (visits or testing). The combined total person-years for the six cancer types increased 8.6%. In 2008, beneficiaries with lymphoma were slightly fewer than those with lung or colorectal cancer—3.87 vs. 4.54 and 4.75 per 1,000, respectively.
Imaging Method and Cancer Type
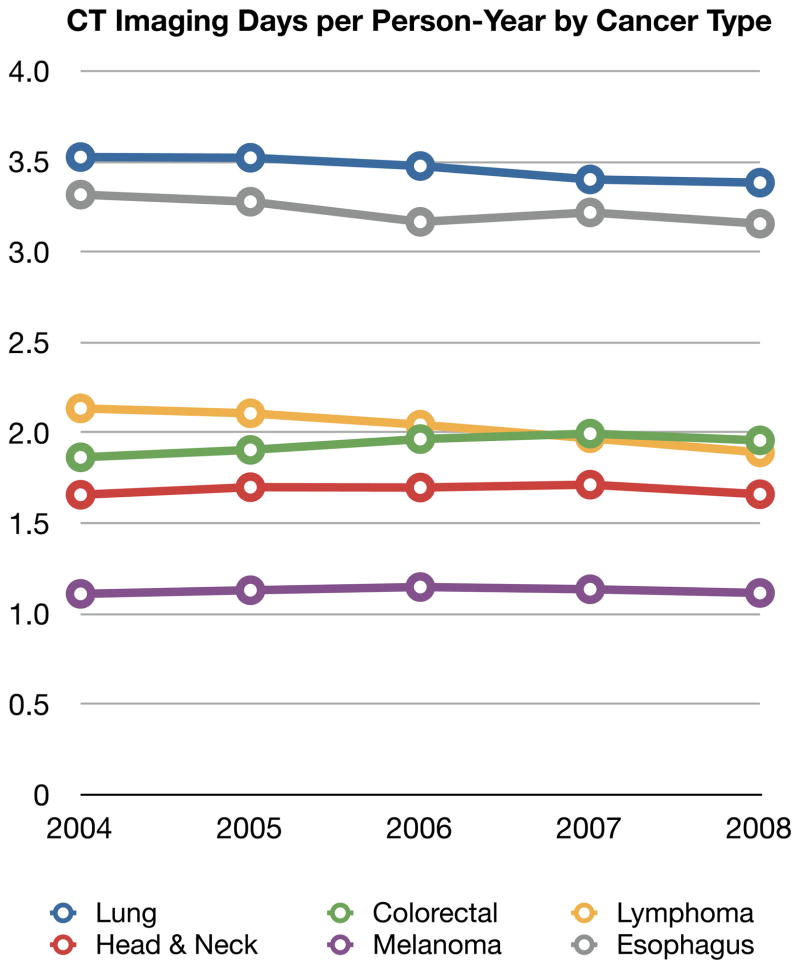
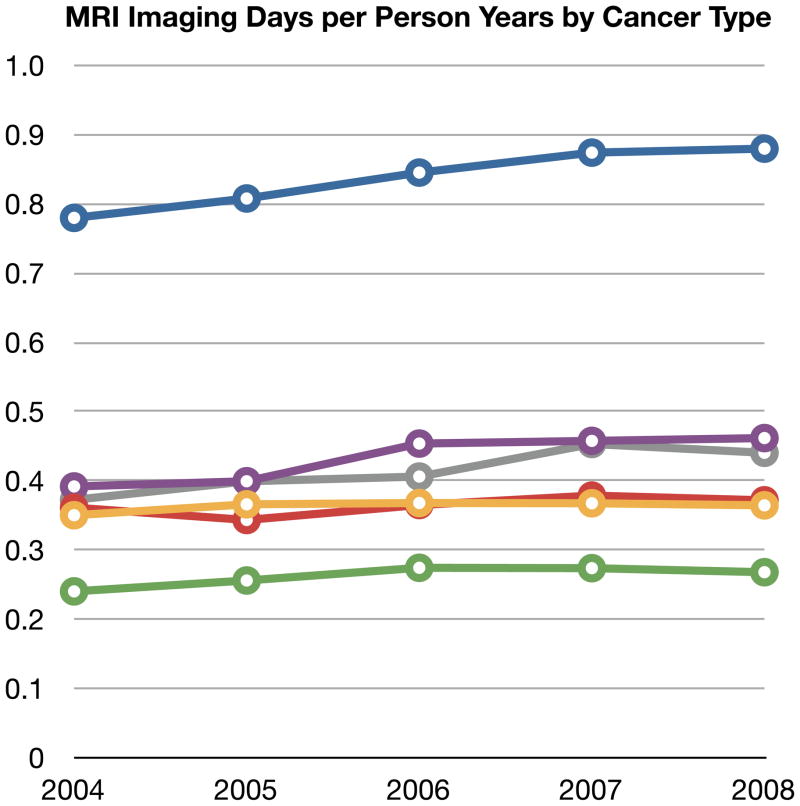
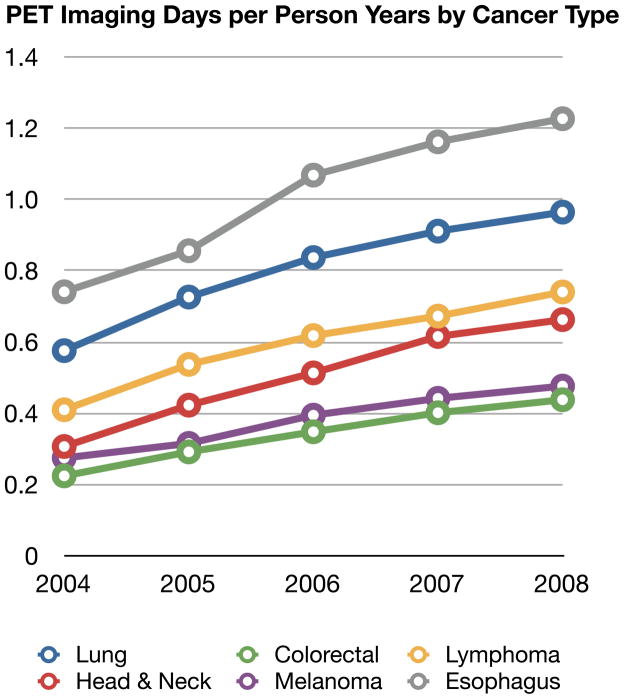
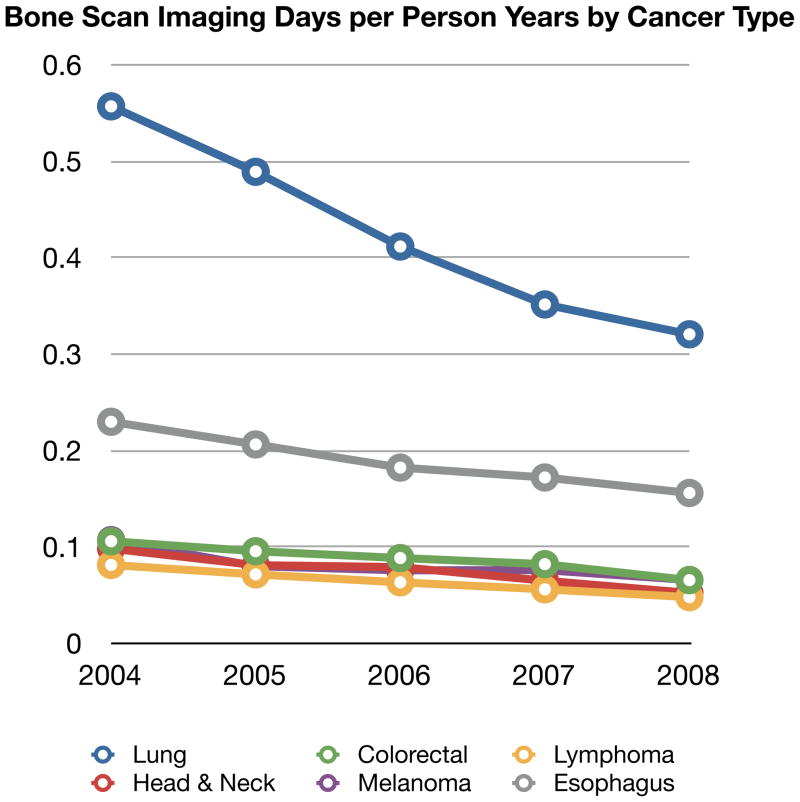
Comparisons of imaging frequency over five years by cancer type provide some insight into differences in site and frequency of metastases as well as how much oncologist’s are adjusting their imaging between solid tumor types. Figure 1 shows the time trends of CT, MRI, PET and BS per person-year by cancer type. In this figure, imaging days are used. Given the large sample sizes, 95% confidence intervals were narrow and are not shown in the graphical presentation for clarity.
Figure 1.
Four Panels of Imaging Type (CT, MRI, PET or BS) Per Person-Year stratified by Cancer Type and Year
Abbreviations: PET: positron emission tomography, CT: computer tomography, MRI: magnetic resonance imaging, BS: bone scintigraphy
The use of CT was consistent year to year within a cancer type but substantially differed between cancer types. Beneficiaries with esophageal and lung cancer had about three-fold more CT days per person-year than those with melanoma. Year-to-year changes in CT imaging by cancer were minimal with the exception of lymphoma where imaging days per person-year declined by 0.25 (3% per year).
MRI was used in lung cancer beneficiaries two to three-fold more often than in any of the other cancer types. This likely is due to greater frequency of brain metastases in lung cancer as part of its natural history. Each lung cancer beneficiary had about one MRI imaging day per person year. The absolute increase in MRI imaging for any of the cancer types was quite small (less than 0.1 days per year).
PET use for all cancer types approximately doubled from 0.38 to 0.70 imaging days per cancer person-year, an annualized increase of 18.0% per year (ranging from 14.6% per year in esophageal cancer to 19.9% per year in head and neck cancer). As shown in Figure 1c, the absolute use per person-year continued to vary by cancer type. For example, by 2008, PET imaging days were 1.23 per person-year in patients with esophageal cancer compared to 0.44 imaging days in patients with colorectal cancer.
BS declined markedly in all cancer types and at similar rates. Overall, for the six cancers combined, bone scintigraphy use declined 12.7% per year or 38.0% over the five years. BS use declined by almost half in lung cancer.
Trends by Imaging Type and Body Site
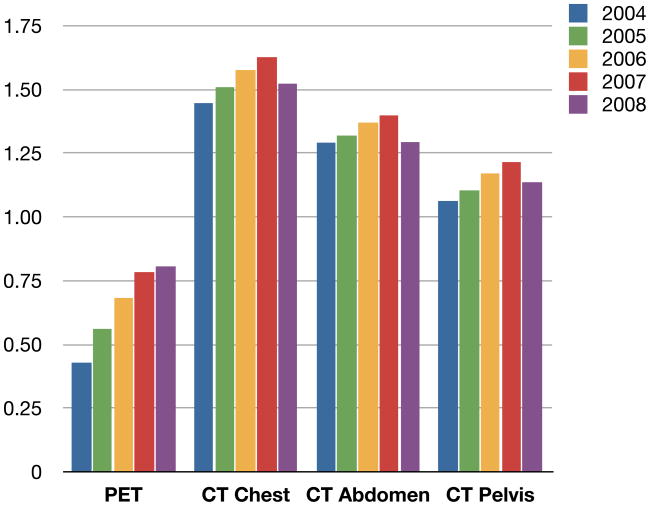
At the cohort level, Figure 1 shows the aggregated CT imaging days for all body sites. Figure 2 breaks out the rates per person year for chest, abdomen, and pelvis. The figure shows that for each of these body sites, CT imaging increased 3–4% per year from 2004 to 2007 and then showed a consistent decline in 2008 of about six percent.
Figure 2.
2004–2008 Trends in PET or CT by Body Location per Cancer Person Year
Abbreviations: PET: positron emission tomography, CT: computer tomography.
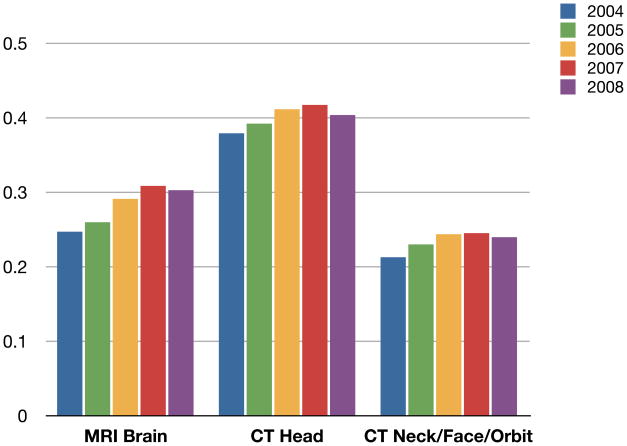
Figure 3 shows the annual rates of brain MRI, head CT and facial, orbit and/or neck CT for 2004 to 2008; both CT and MRI of the head increased, with brain MRI increasing at a slightly faster rate. As observed for body CT, brain imaging declined slightly in 2008.
Figure 3.
2004–2008 Trends in MRI vs. CT for Brain Imaging per Cancer Person Year
Abbreviations: MRI: magnetic resonance imaging, CT: computer tomography
Time Clustering and Sequencing
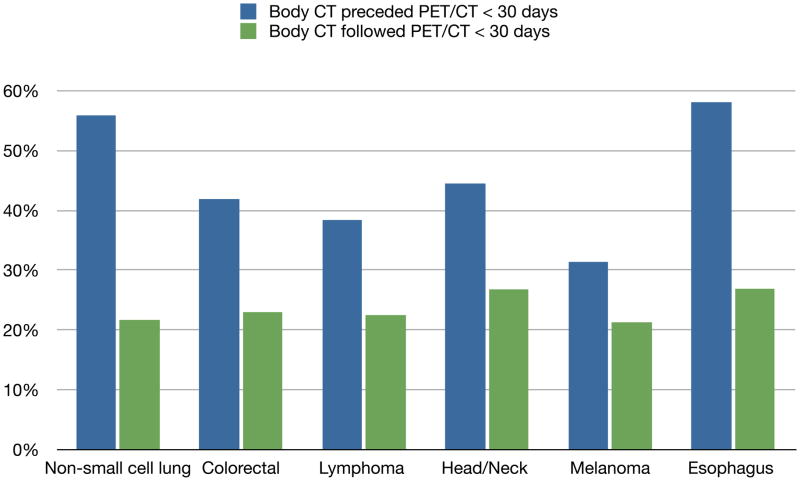
To address the additive vs. replacement questions, we switched our analyses to the individual patient level. Figure 4 shows the clustering and sequence pairing of imaging for 2007–2008. For these comparisons only PET/CT (and not PET only) were evaluated. For all cancer types, a body CT scan preceded a PET/CT within 30 days in 47.4% of patients--ranging from 31.4% in melanoma to 58.1% in esophageal cancer. The converse sequencing having body—CT within 30 days after PET/CT—occurred in 22.8% of patients and minimally varied across the six cancers types. The differences in the sequencing for each individual cancer type and combined were all highly statistically significant (p<0.001).
Figure 4.
Image Clustering and Sequencing in 2007–2008: PET/CT and Body CT by Cancer Type
First PET/CT in 2007–2008 by cancer type: lung n=21,371, colorectal n=10,499, lymphoma n=12,943, head/neck n=4,835, melanoma n=3,067, and esophagus n=2,366. See text for details.
Clustering of brain imaging was much less frequent, primarily occurred within 14 days, and predominantly was brain MRI following head CT. A head CT preceded a brain MRI within 14 days in 15.2% of all patients (range 11.0% to 16.4% by cancer type, data not shown). A second use of brain imaging was most common in beneficiaries with lung cancer and least common in head and neck cancer.
Discussion
Over the last two decades, rapid growth in imaging volume and a shift to more expensive tests has been observed in Medicare beneficiaries and younger, privately insured patients.5–8,11–13 This concern received national attention in a 2005 Medicare Payment Advisory Commission report.14 Factors influencing the growth and likely over utilization of imaging15 include wider availability; patient demand; self-referral among non-radiologists; competition between specialists; defensive medicine; and non-definitive interpretations by radiologists. While greater use of imaging may have value in patient management, there are also possible disadvantages including financial cost and population radiation exposure. Technological advances in imaging can lead to over estimation of disease burden and of the effectiveness of interventions.16 This phenomenon is well described for new cancer staging tests, which can cause a spurious stage migration that seemingly improves outcomes for all stages of disease (Will Rogers phenomenon).17,18 Approaches to slow the growth of imaging include radiology benefit management programs requiring prior authorization, computerized physician order entry with decision support, restrictions on self-referrals and reductions in Medicare technical component payments.5,15,19–21
Our study was specifically interested in the trends of cancer imaging and the diffusion of PET into practice, since this technology represents a new paradigm—functional vs. structural imaging.22 Few other reports have specifically focused on medical imaging in cancer patients. Dinan et al. recently reported an evaluation of a 5% sample of Medicare beneficiaries from 1999 to 2008 for breast, colorectal, lung, and prostate cancers, as well as leukemia and lymphoma, and tracked two years of different types of imaging.23 Direct comparisons between our findings and those of Dinan et al. are limited—Dinan’s cohorts began before the July 2001 Medicare coverage expansion for use of PET in diagnosis, staging, and restaging of non-small cell lung cancer, colorectal cancer and lymphoma, and before the 2002 coverage for breast cancer; these cohorts also included cancers for which use of PET was not covered (leukemia and prostate).24 Nevertheless, we each found that CT and MRI use differed widely by cancer type, minimally differed year-to-year within a cancer type and that imaging use was greatest in lung cancer.
Our study intentionally focused on specific cancers with PET coverage by Medicare, and our cohorts began several years after CMS approval to avoid the distortions of comparisons starting from zero usage. We evaluated imaging utilization across the continuum of disease (diagnosis or initial staging through suspected recurrences), by body areas (e.g. chest/abdomen/pelvis or brain/head/neck) of CT and MRI.5,19 In contrast to most studies of imaging trends, our unit of analysis was the cancer beneficiary (expressed in cancer-person years), not the overall universe of Medicare beneficiaries. Our use of person-years (instead of persons) as our denominator is an acknowledgement that we were not observing our cohort over a full year and redefined it anew each year; this reduces the estimated rates, but did not otherwise impact the analyses.
Our primary finding is that PET use, even seven years after its Medicare approval, continued to increase at substantial, stable rates for all cancer types. This growth in PET per beneficiary occurred without evidence of a decline in body CT imaging, with the exception of a slight decline among lymphoma patients. Our analysis of individual level clustering and sequencing suggests about half of PET/CT is as an additional test to CT and about half are temporally unrelated to CT. This additive use of PET likely reflects a mix of clinical intents: resolving inconclusive CT findings (i.e., serving as the final arbiter) before therapy is initiated, changed or stopped and addressing clinical questions not answered by preceding CT including being a more sensitive detector of metastatic disease. The frequency of PET/CT preceding CT was higher than anticipated, but likely reflected the finding on PET/CT of abnormal FDG uptake in body sites not clinically suspected thus prompting targeted use of CT in a similar arbiter role (e.g., contrast-enhanced CT to confirm hepatic metastases suggested by the results of PET/CT in which the CT component was performed without contrast enhancement).
In the initial staging of non-small cell lung cancer, evidence from randomized trials performed in multiple countries showed that PET is superior to conventional staging and plays a final arbiter role in guiding management; these trials addressed both use of PET as an addition to conventional staging methods (in older studies)25–28 or PET/CT in lieu of conventional staging. 29
However, it is more difficult to infer how much of PET is used as a replacement tool since the rates of body CT did not change meaningfully during these years. MRI use in lieu of CT for evaluating potential brain and spinal metastases shows the same trend modest—growth in MRI without declines in CT. However, the sequencing assessment suggests MRI and CT maybe used for different situations, since only about 15% of brain MRI examinations were preceded by a head CT—a pattern shift seen in the early management of stroke.30,31
The marked decline across all cancer types in conventional whole-body BS use is consistent with other international series.32–36 While prostate and breast cancers are the most common cancer-type indication for BS, the observed decline in BS for the six different cancers in our cohorts suggests that clinicians are increasingly using a mix of CT, MRI and/or PET as alternatives for detection of osseous metastatic disease.
From a disease management and comparative effectiveness perspective, PET imaging of cancer reprises a pattern seen in cardiac and neurologic imaging—the new “better” technique is initially used in addition to older tests or for confirmation with relatively little substitution.13 The value of the new imaging methods depends on the subsequent management consequences, primarily reflecting a complex combination of treatment decisions—yes/no, continue/switch/stop, or transition to palliative care.13 While there appears to be a distinct slowing of discretionary non-invasive imaging since 2005 in the Medicare fee-for-service population37, there is little evidence for switching. The slight declines in body CT and MRI imaging in 2008, may reflect the overall impact of the 2005 Deficit Reduction Act that sharply reduced private office technical component payments. It is difficult to assess retrospectively if a failure to switch (from body CT to PET/CT) reflects a quality of care issue or a potential role of financial incentives because of oncologist ownership of on-site CT scanners.37,38
Current guidelines, the rarity of randomized trials and a general lack of rigor in assessing imaging technologies39,40 are parts of the problem. For the six cancer types evaluated, current NCCN guidelines infrequently make definitive statements that PET is preferred or how it should be sequenced relative to CT imaging. In the initial staging of non-small cell lung and esophageal cancer, guidelines clearly state that PET should follow CT if the CT shows no evidence of metastases.1 However, they do not state that PET should replace chest CT. In other common situations where PET appears to be superior—such as serial elevated CEA levels after surgery in patients with colorectal cancer,22,41 monitoring high-risk patients with melanoma42, or after initial treatment with chemotherapy and/or radiation therapy in patients with head and neck22,43,44—PET-CT is considered optional rather than preferred based on expert consensus.1
Our study’s primary limitation is its unconventional approach to defining the cancer cohort. Inherently, our stringent definition does not allow a continuity profile over years and could not assess where each patient was in the course of his or her disease (initial staging vs. surveillance vs. suspected recurrence). For example, beneficiaries in remission having only one day of evaluation, including imaging, per year would be missed. Studies using linked registry data, usually SEER, have a clear cancer identification point and can easily define an initial therapy period but, after the first year, have the same limitations in inferring clinical intent of imaging. Also, our analysis did not attempt to distinguish the indication for CT and MRI, thereby likely overestimating the cancer-specific rates.
This work or other claims-based analyses of care patterns cannot determine clinical intent, particularly with regard to the evolving role of PET in lieu of CT for treatment monitoring (especially in patients with lymphoma)45, and in changing or stopping systemic therapies when cancer progression is suspected. In future work, we will measure the association of PET with the prevalence of active treatment in the last few months of life.
In conclusion, following Medicare coverage of PET, cancer providers rapidly incorporated the use of PET into their management of six common cancers. This change in practice was to use the new technique, PET, after first using the current imaging standard, body CT, in about one-half of cases. Whether PET is associated with superior patient outcomes and impacts overall costs will require either studies that measure changes in major decision points along a cancer’s natural history or studies that directly measure outcomes.
Footnotes
Publisher's Disclaimer: This is a PDF file of an unedited manuscript that has been accepted for publication. As a service to our customers we are providing this early version of the manuscript. The manuscript will undergo copyediting, typesetting, and review of the resulting proof before it is published in its final citable form. Please note that during the production process errors may be discovered which could affect the content, and all legal disclaimers that apply to the journal pertain.
References
- 1.National Comprehensive Cancer Network. [Accessed (December 27, 2010];NCCN Guidelines ™. http://www.nccn.org/professionals/physician_gls/f_guidelines.asp-site.
- 2.American College of Radiology. [(Accessed January 2, 2011)];ACR Appropriateness Criteria®. http://www.acr.org/secondarymainmenucategories/quality_safety/app_criteria.aspx.
- 3.Podoloff DA, Ball DW, Ben-Josef E, et al. NCCN task force: clinical utility of PET in a variety of tumor types. J Natl Compr Canc Netw. 2009;7 (Suppl 2):S1–26. doi: 10.6004/jnccn.2009.0075. [DOI] [PubMed] [Google Scholar]
- 4.Meropol NJ, Schrag D, Smith TJ, et al. American Society of Clinical Oncology Guidance Statement: The Cost of Cancer Care. J Clin Oncol. 2009;27:3868–74. doi: 10.1200/JCO.2009.23.1183. [DOI] [PubMed] [Google Scholar]
- 5.Levin DC, Rao VM, Parker L, Frangos AJ. The Disproportionate Effects of the Deficit Reduction Act of 2005 on Radiologists’ Private Office MRI and CT Practices Compared With Those of Other Physicians. J Am Coll Radiol. 2009;6:620–5. doi: 10.1016/j.jacr.2009.05.010. [DOI] [PubMed] [Google Scholar]
- 6.Iglehart JK. The New Era of Medical Imaging -- Progress and Pitfalls. N Engl J Med. 2006;354:2822–8. doi: 10.1056/NEJMhpr061219. [DOI] [PubMed] [Google Scholar]
- 7.Parker L, Levin DC, Frangos A, Rao VM. Geographic Variation in the Utilization of Noninvasive Diagnostic Imaging: National Medicare Data, 1998–2007. AJR Am J Roentgenol. 2010;194:1034–9. doi: 10.2214/AJR.09.3528. [DOI] [PubMed] [Google Scholar]
- 8.Levin DC, Rao VM, Parker L, Frangos AJ, Sunshine JH. Recent Shifts in Place of Service for Noninvasive Diagnostic Imaging: Have Hospitals Missed an Opportunity? J Am Coll Radiol. 2009;6:96–9. doi: 10.1016/j.jacr.2008.09.003. [DOI] [PubMed] [Google Scholar]
- 9.Rev PM. [Accessed January 3, 2011];AB-01-54, Expanded Coverage of Positron Emission Tomography (PET) Scans and Related Claims Processing Changes. 2000 December 15; http://www.cms.gov/transmittals/downloads/R136CIM.pdf. In: http://www.cms.gov/transmittals/downloads/R136CIM.pdf, ed.
- 10.Welch HG, Sharp SM, Gottlieb DJ, Skinner JS, Wennberg JE. Geographic Variation in Diagnosis Frequency and Risk of Death Among Medicare Beneficiaries. JAMA: The Journal of the American Medical Association. 2011;305:1113–8. doi: 10.1001/jama.2011.307. [DOI] [PMC free article] [PubMed] [Google Scholar]
- 11.Mitchell JM. Utilization trends for advanced imaging procedures: evidence from individuals with private insurance coverage in California. Med Care. 2008;46:460–6. doi: 10.1097/MLR.0b013e31815dc5ae. [DOI] [PubMed] [Google Scholar]
- 12.Mitchell JM. The Prevalence Of Physician Self-Referral Arrangements After Stark II: Evidence From Advanced Diagnostic Imaging. Health Affairs. 2007;26:w415–w24. doi: 10.1377/hlthaff.26.3.w415. [DOI] [PubMed] [Google Scholar]
- 13.Smith-Bindman R, Miglioretti DL, Larson EB. Rising Use Of Diagnostic Medical Imaging In A Large Integrated Health System. Health Affairs. 2008;27:1491–502. doi: 10.1377/hlthaff.27.6.1491. [DOI] [PMC free article] [PubMed] [Google Scholar]
- 14.Medicare Payment Advisory Commission Report. [(Accessed December 30, 2010];Report to the Congress. Medicare Payment Policy. 2005 March; http://www.medpac.gov/publications/congressional_reports/Mar05_EntireReport.pdf.
- 15.Hendee WR, Becker GJ, Borgstede JP, et al. Addressing Over utilization in Medical Imaging. Radiology. 2010;257:240–5. doi: 10.1148/radiol.10100063. [DOI] [PubMed] [Google Scholar]
- 16.Black WC, Welch HG. Advances in Diagnostic Imaging and Overestimations of Disease Prevalence and the Benefits of Therapy. N Engl J Med. 1993;328:1237–43. doi: 10.1056/NEJM199304293281706. [DOI] [PubMed] [Google Scholar]
- 17.Feinstein AR, Sosin DM, Wells CK. The Will Rogers Phenomenon. N Engl J Med. 1985;312:1604–8. doi: 10.1056/NEJM198506203122504. [DOI] [PubMed] [Google Scholar]
- 18.Rosselli Del Turco M, Palli D, Cariddi A, Ciatto S, Pacini P, Distante V. Intensive diagnostic follow-up after treatment of primary breast cancer. A randomized trial. National Research Council Project on Breast Cancer follow-up. JAMA. 1994;271:1593–7. doi: 10.1001/jama.271.20.1593. [DOI] [PubMed] [Google Scholar]
- 19. [(Accessed January 2, 2011)];Medicare: Trends in Fees, Utilization, and Expenditures for Imaging Services before and after Implementation of the Deficit Reduction Act of 2005. GAO-08-1102R. 2008 September 26; http://www.gao.gov/new.items/d081102r.pdf.
- 20.Rosenthal DI, Weilburg JB, Schultz T, et al. Radiology Order Entry With Decision Support: Initial Clinical Experience. Journal of the American College of Radiology. 2006;3:799–806. doi: 10.1016/j.jacr.2006.05.006. [DOI] [PubMed] [Google Scholar]
- 21.Blackmore CC, Mecklenburg RS, Kaplan GS. Effectiveness of Clinical Decision Support in Controlling Inappropriate Imaging. Journal of the American College of Radiology. 2011;8:19–25. doi: 10.1016/j.jacr.2010.07.009. [DOI] [PubMed] [Google Scholar]
- 22.Juweid ME, Cheson BD. Positron-emission tomography and assessment of cancer therapy. N Engl J Med. 2006;354:496–507. doi: 10.1056/NEJMra050276. [DOI] [PubMed] [Google Scholar]
- 23.Dinan MA, Curtis LH, Hammill BG, et al. Changes in the Use and Costs of Diagnostic Imaging Among Medicare Beneficiaries With Cancer, 1999–2006. JAMA. 2010;303:1625–31. doi: 10.1001/jama.2010.460. [DOI] [PubMed] [Google Scholar]
- 24.Centers for Medicare & Medicaid Services. Pub 100-03 Medicare National Coverage Determinations. Transmittal. 2005;31 http://www.cms.hhs.gov/Transmittals/downloads/R31NCD.pdf. In. [PubMed]
- 25.Fischer B, Lassen U, Mortensen J, et al. Preoperative Staging of Lung Cancer with Combined PET CT. New England Journal of Medicine. 2009;361:32–9. doi: 10.1056/NEJMoa0900043. [DOI] [PubMed] [Google Scholar]
- 26.Herder GJM, Kramer H, Hoekstra OS, et al. Traditional Versus Up-Front [18F] Fluorodeoxyglucose-Positron Emission Tomography Staging of Non-Small-Cell Lung Cancer: A Dutch Cooperative Randomized Study. J Clin Oncol. 2006;24:1800–6. doi: 10.1200/JCO.2005.02.4695. [DOI] [PubMed] [Google Scholar]
- 27.van Tinteren H, Hoekstra OS, Smit EF, et al. Effectiveness of positron emission tomography in the preoperative assessment of patients with suspected non-small-cell lung cancer: the PLUS multicentre randomised trial. Lancet. 2002;359:1388–93. doi: 10.1016/s0140-6736(02)08352-6. [DOI] [PubMed] [Google Scholar]
- 28.Viney RC, Boyer MJ, King MT, et al. Randomized controlled trial of the role of positron emission tomography in the management of stage I and II non-small-cell lung cancer. J Clin Oncol. 2004;22:p2357–62. doi: 10.1200/JCO.2004.04.126. [DOI] [PubMed] [Google Scholar]
- 29.Maziak DE, Darling GE, Inculet RI, et al. Positron emission tomography in staging early lung cancer: a randomized trial. Ann Intern Med. 2009;151:221–8. W-48. doi: 10.7326/0003-4819-151-4-200908180-00132. [DOI] [PubMed] [Google Scholar]
- 30.Chalela JA, Kidwell CS, Nentwich LM, et al. Magnetic resonance imaging and computed tomography in emergency assessment of patients with suspected acute stroke: a prospective comparison. The Lancet. 2007;369:293–8. doi: 10.1016/S0140-6736(07)60151-2. [DOI] [PMC free article] [PubMed] [Google Scholar]
- 31.van der Worp HB, van Gijn J. Clinical practice. Acute ischemic stroke. N Engl J Med. 2007;357:572–9. doi: 10.1056/NEJMcp072057. [DOI] [PubMed] [Google Scholar]
- 32.Morris PG, Lynch C, Feeney JN, et al. Integrated Positron Emission Tomography/Computed Tomography May Render Bone Scintigraphy Unnecessary to Investigate Suspected Metastatic Breast Cancer. J Clin Oncol. 2010;28:3154–9. doi: 10.1200/JCO.2009.27.5743. [DOI] [PMC free article] [PubMed] [Google Scholar]
- 33.Song JW, Oh Y-M, Shim T-S, Kim WS, Ryu J-S, Choi C-M. Efficacy comparison between 18F-FDG PET/CT and bone scintigraphy in detecting bony metastases of non-small-cell lung cancer. Lung Cancer. 2009;65:333–8. doi: 10.1016/j.lungcan.2008.12.004. [DOI] [PubMed] [Google Scholar]
- 34.Takenaka D, Ohno Y, Matsumoto K, et al. Detection of bone metastases in non-small cell lung cancer patients: Comparison of whole-body diffusion-weighted imaging (DWI), whole-body MR imaging without and with DWI, whole-body FDG-PET/CT, and bone scintigraphy. J Magn Reson Imaging. 2009;30:298–308. doi: 10.1002/jmri.21858. [DOI] [PubMed] [Google Scholar]
- 35.Ozulker T, Kucukoz Uzun A, Ozulker F, Ozpacac T. Comparison of (18)F-FDG-PET/CT with (99m)Tc-MDP bone scintigraphy for the detection of bone metastases in cancer patients. Nucl Med Commun. 2010;31:597–603. doi: 10.1097/MNM.0b013e328338e909. [DOI] [PubMed] [Google Scholar]
- 36.Liu T, Xu J-Y, Xu W, Bai Y-R, Yan W-L, Yang H-L. Fluorine-18 deoxyglucose Positron Emission Tomography, Magnetic Resonance Imaging and Bone Scintigraphy for the Diagnosis of Bone Metastases in Patients with Lung Cancer: Which One is the Best? - a Meta-analysis. Clin Oncol. 2011;23:350–8. doi: 10.1016/j.clon.2010.10.002. [DOI] [PubMed] [Google Scholar]
- 37.Levin DC, Rao VM, Parker L, Frangos AJ, Sunshine JH. Bending the curve: the recent marked slowdown in growth of noninvasive diagnostic imaging. AJR Am J Roentgenol. 2011;196:W25–9. doi: 10.2214/AJR.10.4835. [DOI] [PubMed] [Google Scholar]
- 38.Levin DC, Rao VM. The Effect of Self-Referral on Utilization of Advanced Diagnostic Imaging. Am J Roentgenol. 2011;196:848–52. doi: 10.2214/AJR.10.5823. [DOI] [PubMed] [Google Scholar]
- 39.Blackmore CC, Medina LS. Evidence-Based Radiology and the ACR Appropriateness Criteria®. J Am Coll Radiol. 2006;3:505–9. doi: 10.1016/j.jacr.2006.03.003. [DOI] [PubMed] [Google Scholar]
- 40.Fryback DG, Thornbury JR. The Efficacy of Diagnostic Imaging. Med Decis Making. 1991;11:88–94. doi: 10.1177/0272989X9101100203. [DOI] [PubMed] [Google Scholar]
- 41.Metser U, You J, McSweeney S, Freeman M, Hendler A. Assessment of tumor recurrence in patients with colorectal cancer and elevated carcinoembryonic antigen level: FDG PET/CT versus contrast-enhanced 64-MDCT of the chest and abdomen. AJR Am J Roentgenol. 2010;194:766–71. doi: 10.2214/AJR.09.3205. [DOI] [PubMed] [Google Scholar]
- 42.Fuster D, Chiang S, Johnson G, Schuchter LM, Zhuang H, Alavi A. Is 18F-FDG PET More Accurate Than Standard Diagnostic Procedures in the Detection of Suspected Recurrent Melanoma? J Nucl Med. 2004;45:1323–7. [PubMed] [Google Scholar]
- 43.Lonneux M, Hamoir M, Reychler H, et al. Positron Emission Tomography With [18F]Fluorodeoxyglucose Improves Staging and Patient Management in Patients With Head and Neck Squamous Cell Carcinoma: A Multicenter Prospective Study. J Clin Oncol. 2010;28:1190–5. doi: 10.1200/JCO.2009.24.6298. [DOI] [PubMed] [Google Scholar]
- 44.Scott AM, Gunawardana DH, Bartholomeusz D, Ramshaw JE, Lin P. PET changes management and improves prognostic stratification in patients with head and neck cancer: results of a multicenter prospective study. J Nucl Med. 2008;49:1593–600. doi: 10.2967/jnumed.108.053660. [DOI] [PubMed] [Google Scholar]
- 45.Juweid ME, Stroobants S, Hoekstra OS, et al. Use of Positron Emission Tomography for Response Assessment of Lymphoma: Consensus of the Imaging Subcommittee of International Harmonization Project in Lymphoma. J Clin Oncol. 2007;25:571–8. doi: 10.1200/JCO.2006.08.2305. [DOI] [PubMed] [Google Scholar]
- 46.Beebe M, Dalton J, Espronceda M, Evans D. CPT 2008 Professional Edition. AMA Press; Chicago: 2007. [Google Scholar]


