

Abstract
We hypothesized that flavonoid-induced glutathione (GSH) efflux through multi-drug resistance proteins (MRPs) and subsequent intracellular GSH depletion is a viable mechanism to sensitize cancer cells to chemotherapies. This concept was demonstrated using chrysin (5–25 μM) induced GSH efflux in human non-small cell lung cancer lines exposed to the chemotherapeutic agent, doxorubicin (DOX). Treatment with chrysin resulted in significant and sustained intracellular GSH depletion and the GSH enzyme network in the four cancer cell types was predictive of the severity of chrysin induced intracellular GSH depletion. Gene expression data indicated a positive correlation between basal MRP1, MRP3 and MRP5 expression and total GSH efflux before and after chrysin exposure. Co-treating the cells for 72 hours with chrysin (5–30 μM) and DOX (0.025–3.0 μM) significantly enhanced the sensitivity of the cells to DOX as compared to 72-hour DOX alone treatment in all four cell lines. The maximum decrease in the IC50 values of cells treated with DOX alone compared to co-treatment with chrysin and DOX was 43% in A549 cells, 47% in H157 and H1975 cells and 78% in H460 cells. Chrysin worked synergistically with DOX to induce cancer cell death. This approach could allow for use of lower concentrations and/or sensitize cancer cells to drugs that are typically resistant to therapy.
Keywords: Chrysin, flavonoids, glutathione, multidrug resistance proteins, adriamycin, non small cell carcinoma
INTRODUCTION
Glutathione (GSH) regulation is an important factor in cancer cell survival and progression (Leitner et al., 2007). The efficacies of radiation and many chemotherapeutics are partly due to and enhanced by increased oxidative stress in cancer cells (Mallery et al., 1999; Kovacic and Osuna, 2000; Kovacic, 2007; Marelli et al., 2008). Altering GSH metabolism and turnover is one way to increase oxidative stress (Jordan et al., 1987; Calvert et al., 1998; Schnelldorfer et al., 2000; Estrela et al., 2006; Mena et al., 2007). For example, carmustine (BCNU) is an alkylating agent currently used in treatment for many cancers including lung, colon, multiple myeloma, and brain tumors. One mechanism through which BCNU inhibits tumor growth is by altering GSH recycling through inhibition of glutathione reductase (Frischer and Ahmad, 1977; Yang et al., 2005). Another example of altering GSH metabolism is through inhibition of GSH synthesis with buthionine sulfoximine (BSO). As of the time this article was written ClinicalTrials.gov listed 3 phase I clinical trials (one active, one recruiting, and one completed) using BSO in combination with melphalan. The rational of these studies was to increase the efficacy of melphalan therapy by using combination therapy with BSO. Several other phase I clinical trials using BSO and melphalan combination therapy have been completed (Bailey et al., 1994; O’Dwyer et al., 1996; Bailey et al., 1997; Calvert et al., 1998). In addition to increasing chemotherapy efficacy, depleting GSH in cancer cells may also limit the development of multi-drug resistance (MDR), another major complication in chemotherapy (Leitner et al., 2007).
MDR is characterized by the onset of cancer cell survival and tumor progression in the presence of high concentrations of previously successful chemotherapy regimes. Multi-drug resistance associated proteins (MRPs) have long been recognized as a major factor in the development of chemotherapy resistance and the progression of cancer (Ozben, 2006). MRPs are members of the ATP-cassette binding proteins (ABCs) and are located in the B (MDR/TAP), C (CFTR/MRP) and G (White) subfamilies (Dean, 2002b). These proteins use adenosine triphosphate (ATP) to drive the export of a wide range of endogenous and exogenous compounds across cell membranes. How they recognize, bind and transport their substrates is still unclear (Gaudet, 2008; Gerber et al., 2008; Grant et al., 2008). MRPs are found throughout normal tissue where they have an important role in removing metabolic waste and xenobiotics. Tumors often highly express MRPs at levels many fold higher than normal tissue as a means for eliminating chemotherapeutics from the cell (Dean, 2002a). Many of the MRPs expressed in cancer cells export or utilize GSH in the transport process.
Doxorubicin (DOX, trade name Adriamycin), is a widely used anti-cancer agent that has been associated with the production of reactive oxygen species (ROS) (Sinha et al., 1987; Sinha et al., 1989; Muller et al., 1998; Mallery et al., 1999). DOX detoxification in cells is highly dependent on reactions with GSH to form DOX specific GS-X conjugates. Glutathione-S-transferases (GSTs) play an important role in rapidly driving the conjugation reaction between GSH and DOX. Several MRPs have been implicated in the elimination of DOX metabolites from the cell, including MRP1, MRP2, MRP7, MDR1, ABCG2 and Ral-binding ATPase protein RLIP76 (Ueda et al., 1987; Priebe et al., 1998; Awasthi et al., 2003; Takayanagi et al., 2004; Folmer et al., 2007; Calcagno et al., 2008). Flavonoids have been extensively studied for their multifaceted ability to perform as chemoprevention agents and as chemotherapeutics against a wide array of cancers (Ramos, 2008). These compounds are readily available in our daily diets when we ingest teas, fruits, vegetables, honey, seeds and even most alcohols (Ramos, 2008). Chrysin is a flavone found in the blue passion flower (Passiflora caerulea) and honeycomb. The major metabolites of chrysin are chrysin glucuronide and chrysin sulfate, and these metabolites are substrates for ABCC2 (MRP2) (Walle et al., 1999).
We previously reported that some flavonoids can induce significant GSH depletion in cancer cells and potentiate the cytotoxicity of cisplatin, another anti-cancer agent with known pro-oxidant effects, in A549 cells (Kachadourian and Day, 2006; Kachadourian et al., 2007). Herein, we report that chrysin sustains a significant depletion of intracellular GSH concentrations in four human non-small cell epithelial lung cancer cells (A549, H157, H460, H1975) over a 72-hour time course. DOX is generally considered an ineffective chemotherapeutic in the treatment of non-small cell lung cancer, however, we demonstrate how chrysin induces GSH depletion and sensitizes these cells to DOX. Co-treatment of cells with chrysin synergistically potentiates DOX-induced cytotoxicity in all four cell lines. The effect can in part be attributed to chrysin-induced intracellular GSH depletion, as the cells with the most abundant GSH enzyme profile were most resistant to DOX. Finally, this study shows the importance of the MDR related protein profile especially in relation to MRP1, MRP2 and RLIP76, in the ability of the cells to respond to the chrysin/DOX combination therapy.
MATERIALS AND METHODS
Cell Culture and Treatment
The lung non-small cell epithelial cancer cell lines A549, H157, H460 and H1975 were cultured at 37°C with 5% CO2 and grown in media and supplements purchased from Mediatech (Manassas, VA) unless otherwise indicated. All cells were grown in RPMI media containing L-glutamine and supplemented with 10% FBS (Gemini Bio-Products, West Sacramento, CA). Cells were maintained in T-150 flasks and split into 96-well plates at least 18 hours prior to treatment. H157 and A549 cells were seeded for treatment at 12,000 cells per well. H460 and H1975 cells were seeded for treatment at 10,000 cells per well. At the time of treatment all wells were approximately 70–75% confluent and were treated with fresh media containing the indicated compounds. The GSH experiments contained indicated amounts of chrysin and included 100 μM acivicin (gamma-glutamyltransferase inhibitor to prevent the breakdown of extracellular GSH) per well (Smith et al., 1995). After indicated treatment periods, media was removed and cells were rinsed once with PBS and lysed with a sonicating probe (Cole-Parmer Instruments, Vernon Hill, IL). All samples were immediately processed and stored at −20°C until the time of assay.
Lactate dehydrogenase (LDH) activity assay
LDH activity was determined in both media and lysate samples as previously described (Velsor et al., 2006). LDH release was used as a measure of treatment toxicity and was calculated as the percent of LDH released in the media compared to the total LDH (LDH media + LDH lysate). Treatment values were normalized to controls and the normalized values were used in curve fitting. The combination indices were determined using the index-isobologram method described by Soriano (Soriano et al., 1999). Each CI was calculated from the mean affected fraction at each drug concentration. CI > 1, CI = 1, and CI < 1 indicate antagonism, additive effect, or synergy, respectively.
GSH spectrophotometric method
GSH measurements were analyzed using the spectrophotometric microplate reader assay described by Rahman et al. (Rahman et al., 2006) and detected using a SpectraMax 340PC platereader (Molecular Devices, Sunnyvale, CA). Protein values from cell lysates were used for normalization of GSH values and were determined spectrophotometrically with the Coomassie Protein Assay Kit according to the manufacturer’s protocol (Pierce, Rockford, IL).
Real time reverse transcriptase polymerase chain reaction (RT-RTPCR) SuperArray assay
Cells were grown to confluence in T-75 flasks. Isolation of mRNA was completed using the Qiagen RNeasy Mini Spin Column – QIAshredder Kit (Qiagen, Valencia, CA), according to the manufacturer protocol. Purity and quantity of total RNA was determined using the Nanodrop (ND-100) UV-Vis spectrophotometer (NanoDrop Technologies, Wilmington, DE). First strand DNA was created using RT2 First Strand Kit (SABiosciences Corporation, Frederick, MD) according to the manufacturer’s protocol. The reverse transcriptase step utilized a 9800 FAST 96-well block PCR (Applied Biosystems, Foster City, CA). Two-stage real time RT-PCR on proteins known to contribute to the MDR phenotype in cancer cells and several GSH related enzymes were probed on a custom designed 96-well format RT2 SuperArray (SABiosciences Corporation, Frederick, MD) (refer to Supplemental Table 1 for list of super array targets). The super arrays were designed for the Bio-Rad (MJ) Opticon 2 thermal cycler (Bio-Rad, Hercules, CA) and sample preparation and cycle times were used according to the RT2 SuperArray protocol. All solutions, including the SYBR green RT PCR mix were purchased from SABiosciences Corporation, as recommended by the SuperArray protocol. Relative mRNA abundance for each target was determined by comparing the cycle time of the target against a 6-point (1:1 to 1:100,000) GAPDH standard curve created by serial dilutions of loaded cDNA template within each plate.
Statistical Analysis
Data are expressed as the mean ± standard error of the mean (S.E.M.). All experiments included at least triplicate treatment groups and each experiment was repeated at least two times. ANOVA comparison, Tukey comparison, t-tests, linear regression curves and cytotoxicities (ICs) were calculated using Prizm version 5 (GraphPad, San Diego, CA).
RESULTS
Chrysin induced glutathione depletion in four non-small cell lung tumor cell lines
Cells were treated with increasing concentrations of chrysin (0–25 μM) over a time course of 8–72 hours (Fig. 1). These treatments were not toxic as determined by the LDH assay (data not shown). As compared to untreated controls, chrysin treatment resulted in significant and sustained GSH depletion in all four cell lines (A549, H157, H460 and H1975). Intracellular GSH concentrations decrease overtime in control cultures, buthighest concentration of chrysin (25μM) depleted intracellular GSH by 46 percent as early as 8 hours in A549 cells and maintained 64% depletion over the entire 72-hour time course. In H157 cells, 25 μM chrysin induced 83% intracellular GSH depletion by 8 hours and maintained 57% depletion over 72 hours. Approximately a 50% GSH depletion was achieved with 25 μM chrysin in H460 and H1975 cells throughout the 72-hour time course.
Figure 1.

Intracellular GSH depletion induced by chrysin (0–25 μM) over a 72-hour time course. Significant and sustained GSH depletion was achieved in (A) A549, (B) H157, (C) H460 and (D) H1975 non-small cell cancer cells. Data are presented as the mean ± S.E.M. and columns with non-identical superscripts are significantly different (p < 0.05) as determined using ANOVA with the Tukey post comparison test.
In order to determine if the intracellular GSH depletion was a consequence of chrysin induced GSH efflux, we also assessed changes in extracellular GSH (Fig. 2). Chrysin (25 μM) treatment increased extracellular GSH levels 11.2-fold, 5.1-fold, 3.0-fold and 1.5-fold in A549, H157, H1975 and H460 cells, respectively, as compared to untreated controls after 8 hours. By the 72-hour time point, extracellular GSH levels maintained an increase of approximately 9.7-fold, 5.0-fold, 3.9-fold and 2.4-fold in A549, H157, H1975 and H460 cells, respectively. These results support the conclusion that GSH depletion after chrysin exposure is in part a consequence of its export.
Figure 2.

Extracelluar GSH efflux induced by chrysin treatment (0–25 μM) over a 72-hour time course in the lung epithelial cancer cells (A) A549, (B) H157, (C) H460 and (D) H1975. Significant GSH efflux was induced in all cancer cell lines, A549 cells had the greatest GSH efflux response, followed by H157, H1975 and H460 cells. Data are presented as the mean ± S.E.M. and columns with non-identical superscripts are significantly different (p < 0.05) as determined using ANOVA with the Tukey post comparison test.
GSH maintenance enzyme network in A549, H157, H460 and H1975 cells
Many enzymes are important for synthesis, turnover and maintenance of intracellular GSH concentrations. For the purpose of this paper, we term this group of enzymes the “GSH maintenance network.” The major enzymes affecting GSH homeostasis are glutatmate-cysteine ligase catalytic and modifier subunits (GCLC and GCLM), GSH reductase (GR), GSH synthetase (GSS), gamma-glutamyltransferase (GTT) and glutathione S-transferases (GSTs). Several reviews have been written describing how these enzymes work in concert to maintain intracellular and extracellular GSH concentrations (Brunati et al.; Circu and Aw; Giles, 2006). We monitored these proteins on a gene array to gauge the basal capacity of the cells to respond to chyrsin-induced GSH depletion (Supplemental Table 1).
We first determined if chrysin induced GSH depletion was related to the level of GSH synthesis enzymes in each cell type. Next we compared GSH synthesis enzymes of each cell line by converting the raw expression values from the real time PCR (Supplemental Table 1) to a percentage scale where the highest signal for each target represents 100% (Supplemental Table 2 and Fig. 3A). GCLC expression was approximately 3- to 5-fold greater in A549 and H157 cells as compared to H1975 and H460 cells respectively. GCLM expression was greatest in H1975 cells followed by A549 > H460 > H157. GSR and GSS expression was ordered A549 > H157 ≈ H1975 > H460 and A549 > H157 > H1975 > H460, respectively.
Figure 3.

Percent gene expression for the basal GSH maintenance network in A549 (white bar), H157 (black bar), H460 (grey bar) and H1975 (checkered bar) cancer cells. The percent gene expression for a target was determined by assigning the cell with the greatest expression for that target (data from Supplemental Table 1) the value of 100 percent. For each target, the cells were compared as a percentage of 100. (A) Percent gene expression of individual targets on the GSH associated gene array. (B) Summation of the expression GSH synthesis enzymes (GCLC, GCLM, GSR and GSS) in each cancer cell type. (C) Summation of the expression of GGT1 and GST enzymes in each cancer cell type.
Intracellular GSH (25 μM chrysin) at 72 hours was decreased 40–50% compared to control concentrations in all 4 cell lines, but GSH efflux varied greatly between the cell lines (A549 > H157 > H1975 > H460). For example, the 72-hour chrysin (25 μM) time course in A549 cells led to a 9.7-fold increase in GSH efflux, but the cells were still able to maintain at least 40 percent of their intracellular GSH concentration. Maintenance of intracellular GSH concentration in the face of significant GSH efflux requires the cell to have a significant GSH synthesis or recycling capacity. Summation of the relative expression for GCLC, GCLM, GSS and GSR in each cell type indicates the relative abundance of the GSH enzyme network in the cell lines and generally supports the requirements for maintaining moderate intracellular GSH concentrations while simultaneously effluxing significant quantities of GSH with total signal falling in the order of H157 > A549 > H1975 ≈ H460 (Fig 3B). Summation of the relative expression for GGT1 and GSTs indicates the relative breakdown and utilization of GSH with the toal signal falling in the order of H157≫A549~H1975~H460 (Fig. 3C). From this data we conclude that: 1) chrysin is an efficient agent for significantly depleting intracellular GSH in lung cancer epithelial cells; 2) a single concentration of chrysin can maintain significant GSH depletion over several days and; 3) the extent of chrysin induced GSH depletion is partly dependent on the GSH enzyme network within the cell.
Basal MDR related protein profiles in relation to chrysin elimination
The MDR protein profile is expected to play an important role in chrysin elimination. When we treated the cells with chrysin alone, GSH efflux was greatest in A549 cells followed by H157 > H1975 > H460. We previously determined and reported the basal MDR expression profile in the four cell lines used for this study (data not shown and reference (Brechbuhl et al., 2010). Our data indicated that MRP1, MRP3, MRP4, MRP5 and MRP7 demonstrate the same rank order (A549 > H157 > H1975 > H460) as did the GSH efflux data. It is worth noting that our data indicates the basal level of these transporters in the cells prior to chrysin or DOX treatment. Prolonged treatment with either compound may result in alteration of this expression profile. However, given these restraints, there have been no reports indicating that MRP3 or MRP7 efflux GSH, GSSG, or GS-X (Toyoda et al., 2008). MRP4 and MRP5 transport GS-X and might have a low affinity for reduced GSH (Toyoda et al., 2008). MRP1 has been clearly identified as a GSH efflux protein and has a high affinity for GSH, GSSG and GS-X (Cole and Deeley, 2006). Our data supports that MRP1 has a large role in the chrysin-induced GSH efflux response based on the amount of GSH efflux induced by chrysin in each cell line and the high affinity of MRP1 for transporting GSH. Our data also supports the possibility that chrysin may induce GSH efflux through MRP4 and/or MRP5 as it has been suggested previously (Walle et al., 1999).
GST enzyme and MDR related protein profiles in relation to DOX elimination
We measured the sensitivity of each cell line to the single agent DOX. H157 and A549 cells are a factor of 10 more resistant to DOX as compared to H460 and H1975 based on IC50 values (Table 1 and Fig. 4A–D). Two major elements in determining the success of this combination therapy include the ability of the cell to metabolize and eliminate the compounds. Elimination of GS-X DOX conjugates occurs through MDR proteins and we contend that altering either GSH availability for DOX conjugation or MDR expression may sensitize the cells to DOX therapy. We examined the basal MDR and GST enzyme profile in the A549, H157, H460 and H1975 cells.
Table 1.
IC values in A549, H157, H460 and H1975 cells co-treated with chrysin and DOX (0–2 μM)*.
| A549 | Chrysin (μM) | H157 | Chrysin (μM) | ||||||||||||
|---|---|---|---|---|---|---|---|---|---|---|---|---|---|---|---|
| Dox | 0 | 5 | 10 | 15 | 20 | 25 | 30 | Dox | 0 | 5 | 10 | 15 | 20 | 25 | 30 |
| IC10 | 0.042 | 0.041 | 0.040 | 0.031 | 0.029 | 0.018 | 0.017 | IC10 | 0.065 | 0.075 | 0.095 | 0.072 | 0.091 | 0.062 | 0.075 |
| IC20 | 0.093 | 0.085 | 0.081 | 0.062 | 0.061 | 0.046 | 0.045 | IC20 | 0.147 | 0.135 | 0.153 | 0.124 | 0.150 | 0.114 | 0.132 |
| IC30 | 0.158 | 0.137 | 0.128 | 0.100 | 0.099 | 0.085 | 0.086 | IC30 | 0.253 | 0.199 | 0.212 | 0.179 | 0.209 | 0.171 | 0.193 |
| IC40 | 0.245 | 0.203 | 0.187 | 0.147 | 0.147 | 0.140 | 0.146 | IC40 | 0.393 | 0.274 | 0.275 | 0.241 | 0.247 | 0.239 | 0.264 |
| IC50 | 0.365 | 0.291 | 0.264 | 0.210 | 0.212 | 0.223 | 0.238 | IC50 | 0.589 | 0.367 | 0.350 | 0.317 | 0.351 | 0.325 | 0.351 |
| IC60 | 0.543 | 0.418 | 0.374 | 0.300 | 0.306 | 0.354 | 0.388 | IC60 | 0.884 | 0.492 | 0.446 | 0.417 | 0.451 | 0.442 | 0.467 |
| IC70 | 0.839 | 0.620 | 0.545 | 0.441 | 0.456 | 0.587 | 0.661 | IC70 | 1.38 | 0.678 | 0.581 | 0.562 | 0.591 | 0.671 | 0.638 |
| IC80 | 1.43 | 1.00 | 0.864 | 0.707 | 0.742 | 1.087 | 1.267 | IC80 | 2.36 | 1.00 | 0.801 | 0.809 | 0.823 | 0.928 | 0.932 |
|
| |||||||||||||||
| H460 | Chrysin (μM) | H1975 | Chrysin (μM) | ||||||||||||
|
| |||||||||||||||
| Dox | 0 | 5 | 10 | 15 | 20 | 25 | 30 | Dox | 0 | 5 | 10 | 15 | 20 | 25 | 30 |
|
| |||||||||||||||
| IC10 | 0.012 | 0.010 | 0.011 | 0.013 | 0.014 | 0.004 | 0.003 | IC10 | 0.014 | 0.018 | 0.017 | 0.013 | 0.013 | 0.014 | 0.015 |
| IC20 | 0.022 | 0.016 | 0.017 | 0.017 | 0.020 | 0.007 | 0.006 | IC20 | 0.025 | 0.024 | 0.023 | 0.017 | 0.019 | 0.019 | 0.020 |
| IC30 | 0.034 | 0.021 | 0.023 | 0.021 | 0.024 | 0.009 | 0.008 | IC30 | 0.036 | 0.030 | 0.029 | 0.021 | 0.024 | 0.024 | 0.025 |
| IC40 | 0.049 | 0.026 | 0.028 | 0.025 | 0.029 | 0.013 | 0.011 | IC40 | 0.050 | 0.036 | 0.035 | 0.024 | 0.029 | 0.028 | 0.030 |
| IC50 | 0.067 | 0.033 | 0.035 | 0.030 | 0.033 | 0.016 | 0.015 | IC50 | 0.066 | 0.042 | 0.042 | 0.028 | 0.034 | 0.034 | 0.035 |
| IC60 | 0.042 | 0.035 | 0.039 | 0.020 | 0.020 | 0.020 | 0.020 | IC60 | 0.087 | 0.049 | 0.050 | 0.033 | 0.041 | 0.040 | 0.041 |
| IC70 | 0.133 | 0.052 | 0.053 | 0.042 | 0.046 | 0.026 | 0.027 | IC70 | 0.119 | 0.058 | 0.060 | 0.038 | 0.050 | 0.047 | 0.049 |
| IC80 | 0.205 | 0.070 | 0.070 | 0.051 | 0.056 | 0.036 | 0.039 | IC80 | 0.173 | 0.072 | 0.076 | 0.047 | 0.063 | 0.059 | 0.061 |
Chrysin significantly sensitized all four cell lines to DOX treatment as compared to DOX alone treated cells (column 0 in each cell type box). IC50 values were determined using Prizm and calculated from the dose response curves.
Figure 4.

Co-treatment of (A) A549, (B) H157, (C) H460 and (D) H1975 cells with chrysin (0–30 μM) and DOX (0–2 μM) results in significant sensitization of the cells to DOX as compared to DOX treatment alone (black line). Shifts in the curves to the left of the DOX alone line indicates increased toxicity as measured by LDH release. Concentration response curves were developed using Prizm software.
The basal GST profile of each cell type was very robust across the board but each cell type had a unique profile in regards to the extent of expressing differing GST isoforms (Supplemental Table 2 and Fig. 3C). The diverse and stout GST profile in the cells demonstrated a large potential for all of the cells to rapidly conjugate DOX with GSH. This may in part explain why DOX is not effective in clinical treatment of non-small cell lung cancers represented by these four cell lines. Summation of the expression signals (Supplemental Table 2) provided evidence that H157 and A549 cells would have a greater DOX resistance with an order of H157 > A549 > H1975 > H460 (Fig. 3C). We predicted that the extent of MDR protein involvement would impact the success/hindrance of the combination therapy.
In regard to DOX elimination, we focused on the known GS-X/DOX conjugate carriers, i.e. MRP1, MRP2, MRP7, MDR1, ABCG2 and RLIP76. Based on previously obtained gene array data (data not shown and reference (Brechbuhl et al.)), MDR1 had negligible expression in all 4 cell lines as compared to the other transporters responsible for DOX efflux, therefore it is likely that in this instance MDR1 had a minor role in DOX elimination. The overall basal MDR expression profile was most robust in A549 cells followed by H157 > H460 > H1975 (data not shown and reference (Brechbuhl et al.)). Our observation of the overall basal MDR expression profile is consistent with the hypothesis that the cells with the most diverse MDR protein profile are most resistant to DOX. RLIP76 has recently been identified as a major determinant for DOX resistance specifically in lung cancer cells. Our results indicate that H157 had the greatest signal for RLIP76 and were most resistant to DOX compared to the other cell lines.
Chrysin induced GSH depletion sensitizes resistant cells to DOX
Cells were co-treated with chrysin (0–30 μM) and DOX (0.025–2 μM) for 72 hours and LDH release was used as the measure of cytotoxicity (Table 2 and Fig. 4A–D). Chrysin (5 μM) potentiated DOX toxicity across all 4 cell lines by decreasing the IC50 for DOX by 21% in A549 cells, 38% in H157 cells, 51% in H460 cells and 37% in H1975 cells. At the highest used chrysin concentration (30 μM), DOX cytotoxicity was potentiated in all four cell lines with decreases in IC50 values of 35, 40, 78 and 47 percent in A549, H157, H460 and H1975 cells, respectively. Maximum potentiation in A549 (43%), H157 (47%) and H1975 (47%) cells occurred with 15 μM chrysin, which were statistically different (p < 0.01) from DOX alone (Figure 5). H460 cells demonstrated a 55% potentiation at 15 μM chrysin and reached 78% at the highest chrysin concentration (30 μM).
Figure 5.

Trend analysis comparing the expression of the total GSH maintenance network in H157, A549, H1975 and H460 cancer cells as a function of resistance to treatment with DOX alone and the DOX/chrysin combination. The white bar is the summed GSH gene expression in each cell line. The black bar represents the single agent DOX IC50. The grey bar represents the IC50 for combination treatment with DOX and chrysin at chrysin concentration of 15 μM. Asterisks indicate a statistically significant differences between DOX IC50 and Chrysin/DOX IC50, p < 0.01.
We compared the summed expression of the total GSH maintenance network in each cell type to its IC50 data (Fig. 5). Trend analysis demonstrated a significant trend for cells with the greatest expression of GSH maintenance network enzymes as most resistant to DOX treatment (H157 > A549 > H1975 > H460) (Fig. 5). The ability of each cell to express GSH maintenance network enzymes also significantly impacted its resistance to the combination DOX and chrysin therapy (H157 > A549 > H1975 > H460).
Calculation of the combination index demonstrates that the increased toxicity of DOX in the cells is attributable to synergistic interactions of chrysin and DOX (Fig. 6). In this representation of the data, a combination index value below 1 indicate synergistic effects, values equal to one suggest additive effects, and values greater than 1 are indicative of antagonistic actions. Every dosing combination used in H460, H1975 and H157 cells demonstrated synergism (Fig. 6A–C). In A549 cells, synergism was most prominent at chrysin concentrations between 5–15 μM in combination with DOX concentrations between 0.025–0.1 μM (Fig. 6D). Similar to the sensitivity of the cells to the combination (H460 > H1975 > H157 > A549), synergistic interactions were greatest in H460 cells followed by H1975 > H157 > A549. We conclude from this data that: 1) Co-treating DOX resistant non-small lung cancer cells with chrysin significantly increases their sensitivity to DOX; 2) the extent of each cell to combat chrysin induced GSH depletion contributes to the resistance or sensitivity of the cells to the combination therapy; and 3) chrysin and DOX increase sensitivity of the cells to treatment through synergy.
Figure 6.

Combination index analysis demonstrates that chrysin increases DOX toxicity synergistically in all four cell lines within the concentrations of chrysin 5–15 μM and DOX 0.025–1 μM. Combination index values above 1 indicate antagonistic, equal to 1 indicate additive and less than 1 indicate synergism.
DISCUSSION
Two of the major challenges to chemotherapy approaches are: 1) finding the appropriate balance between drug efficacy and toxicity; and 2) combating drug resistance. DOX is an example of a highly effective drug that is hampered by its narrow therapeutic range, outside of which patients develop adverse side effects, the most severe of which is cardiotoxicity (Singal et al., 2000). One reason DOX therapy is ineffective against some cancer types, like non-small lung cancer, or becomes ineffective is the need to escalate its dosing due to the ability of cancer cells to adapt and evade DOX by increasing expression of MDR proteins that eliminate DOX from the tumor (Ueda et al., 1987; Priebe et al., 1998; Awasthi et al., 2003; Folmer et al., 2007; Calcagno et al., 2008).
A concerted effort has been put forth to find ways to decrease MDR protein function in tumors and clinical trials with MDR inhibitors have had some success (O’Connor, 2007). However, potential hindrance to development of MDR inhibitors is development of off-target effects as most MDR proteins have important functions in normal tissues and inhibiting these proteins can have consequences on common metabolic processes (Toyoda et al., 2008). For example, deficiency in MRP2 leads to defective bilirubin glucuronide elimination in the liver and results in Dubin-Johnson syndrome (Toh et al., 1999). MRP1 deficiency is attributed to a decreased inflammatory response due to defective transport of the MRP1 substrate and inflammatory signaling molecule LTC4 (Wijnholds et al., 1997). Normal tissues also use these transporters to protect cells from xenobiotics and inhibiting them can result in increased sensitivity to xenobiotic exposure (Dean, 2002a).
Another approach to sensitizing cancer cells to chemotherapy has been to target their antioxidant defenses such as GSH synthesis (BSO) and turnover (carmustine). Phase I clinical trials with BSO and melphalan demonstrated that continuous BSO infusion at concentrations producing 80–90% reduction in GSH concentrations had no side-effects {O’Dwyer, 1996}. In our studies chyrsin produced similar level of GSH reduction in tumor cells as seen in BSO treated patients. The BSO/melphalan combination resulted in occasional occurrence of severe myelosupression and frequent mild nausea/vomiting. The minimal side effects with BSO/melphalan treatments lend promise to the ability to use GSH depletion as a mechanism to sensitize tumors to chemotherapy. One drawback to compounds currently developed to target GSH synthesis (BSO) and turnover (carmustine) is a lack of specificity toward cancer cells (Bailey, 1998; Helal and Helal, 2009). In addition to GSH depletion in tumor cells, BSO administration has been shown to result in similar GSH depletion in normal tissues. Unlike tumors, normal tissues have been shown to rapidly recover basal GSH concentrations after a BSO challenge (Bailey, 1998). This fact indicates that normal tissues have a stronger capacity to respond to GSH challenges as compared to tumors and may be one reason tumor cells are more susceptible to chemotherapies after GSH depletion.
Flavonoids are intriguing compounds because of their diametric ability to act as cancer preventative agents and as cancer toxins (Ramos, 2008). In addition to their ability to prevent and alter the course of cancer progression, several naturally occurring flavonoids have been shown to protect against the adverse effects of common chemotherapy agents (Psotova et al., 2004; Perez-Tomas, 2006; Klein et al., 2007; O’Connor, 2007; Lee et al., 2008). A wide array of these compounds were screened and were shown capable of inducing significant GSH depletion in a number of cancer cell lines in the interest of using flavonoids as chemotherapy adjuncts (Kachadourian and Day, 2006). The ability of flavonoids to cause GSH efflux/depletion, their anti-tumor effects and their ability to protect against chemotherapy induced toxicities make flavonoids especially interesting in regard to development as agents. Due to the rapid metabolism of flavonoids, additional drug development will be needed to improve their bioavailability to achieve and maintain effective therapeutic concentrations.
This study provides evidence that chrysin-induced GSH depletion enhances the effect of DOX. We demonstrate the ability of a single concentration of chrysin to induce significant GSH efflux and subsequent long-term GSH depletion in four human epithelial lung cancer cells. Our results support MRP1 as the main chrysin-induced GSH transporter, but MRP4, MRP5 and MRP7 may also play a role. However, chrysin has been shown to specifically inhibit the ability MDR1 to efflux DOX and to inhibit efflux of some substrates through ABCG2 (Kars et al., 2008). Also, MRP2 is currently the only identified transporter to efflux the metabolites of chrysin, i.e., chrysin glucoronide and chrysin sulfate, and these substrates may compete with DOX metabolites for elimination. In addition, the possibility exists that GSH depletion could alter DOX GSH conjugation by GSTs and cellular elimination. Therefore, cellular accumulation of DOX as an additional mechanism for the ability of chrysin to potentiate DOX-induced cytotoxicity cannot be discarded.
Overall, our results with chrysin and DOX indicate that drug-induced GSH depletion through MDR proteins can be successful in vitro through a variety of possible mechanisms (Fig. 7). More research is required to better understand these mechanisms and to pair flavonoids that induce GSH efflux/depletion with MDR proteins for this new strategy to be most effective. Thorough investigations similar to those done for MRP1 can lead to identification of MDR proteins susceptible to GSH efflux with flavonoid exposure. Development of in vivo models to test this concept is of great interest. Ideally, this type of pairing could lead to personalized chemotherapy regimes. Such personalized medicine could be put in practice by developing MDR protein arrays and applying readily available and rapid PCR methods to identify the MDR protein profile in a patient’s tumor biopsy. This information could subsequently be used to prescribe a flavonoid(s) adjunct that would result in tumor GSH depletion through the agent/MDR protein pairs and ultimately result to increased efficacy of the patient’s chemotherapy regime.
Figure 7.
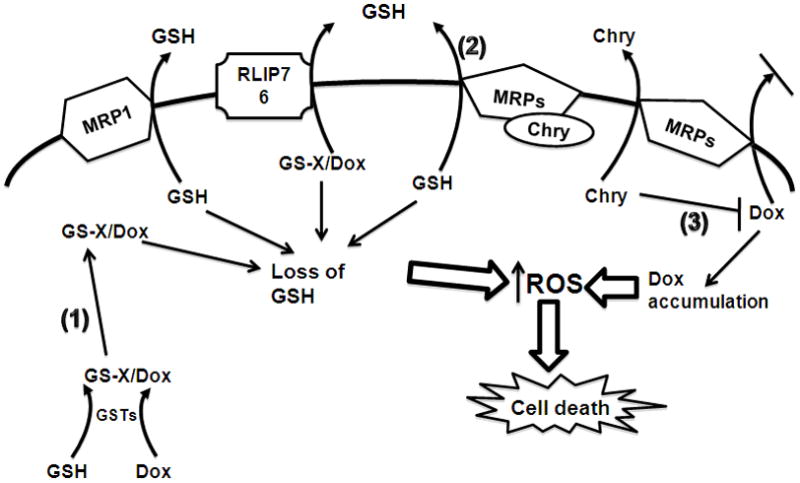
A model for the possible mechanisms resulting in chrysin (Chry) potentiation of doxorubicin (Dox) cytotoxicity in cancer cells. Co-treating cancer cells with the pro-oxidant chemotherapeutic Dox and the flavonoid chrysin (Chry) results in decreased intracellular GSH concentration and increased cytotoxicity. There are several possible mechanisms responsible for this effect: 1) Dox metabolism by GSH S-transferases (GSTs) results in decreased GSH availability due to conjugation reactions with GSH; 2) Chry induces GSH export through several MRPs; 3) Dox is a pro-oxidant and its accumulation in the cells results in increased reactive oxygen species (ROS) production, Chry may compete with Dox for MRP mediated export. The overall result in cancer cells is increased ROS production and cell death.
Supplementary Material
GSH maintenance enzyme network in A549, H157, H460 and H1975 cancer cells. GSH synthesis enzymes in all 4 cell lines indicate that the lung epithelial cancer cells have a high capacity to regulate cellular GSH levels. In general the A549 cells express GSH synthesis enzymes to the greatest degree, followed by H157, H1975 and H460 cells. GSTs have an important role in facilitating rapid conjugation of DOX to GSH. All four cell types have a very robust GST profile, indicating a large ability for these cells to perform GSH conjugation reactions.
Percent gene expression of the GSH maintenance enzyme networks in A549, H157, H460 and H1975 cancer cells. The percent gene expression for a target was determined by assigning the cell with the greatest expression for that target (from data in Supplemental Table 1) the value of 100 percent. For each target, the cells were compared as a percentage of 100.
Abbreviations
- ABC
ATP-binding cassette
- GSH
glutathione
- MDR
multidrug resistance
- MRP
multidrug resistant protein
Footnotes
Publisher's Disclaimer: This is a PDF file of an unedited manuscript that has been accepted for publication. As a service to our customers we are providing this early version of the manuscript. The manuscript will undergo copyediting, typesetting, and review of the resulting proof before it is published in its final citable form. Please note that during the production process errors may be discovered which could affect the content, and all legal disclaimers that apply to the journal pertain.
References
- Awasthi S, Singhal SS, Singhal J, Cheng J, Zimniak P, Awasthi YC. Role of RLIP76 in lung cancer doxorubicin resistance: II. Doxorubicin transport in lung cancer by RLIP76. International journal of oncology. 2003;22:713–720. [PubMed] [Google Scholar]
- Bailey HH. L-S,R-buthionine sulfoximine: historical development and clinical issues. Chemico-biological interactions. 1998;111–112:239–254. doi: 10.1016/s0009-2797(97)00164-6. [DOI] [PubMed] [Google Scholar]
- Bailey HH, Mulcahy RT, Tutsch KD, Arzoomanian RZ, Alberti D, Tombes MB, Wilding G, Pomplun M, Spriggs DR. Phase I clinical trial of intravenous L-buthionine sulfoximine and melphalan: an attempt at modulation of glutathione. J Clin Oncol. 1994;12:194–205. doi: 10.1200/JCO.1994.12.1.194. [DOI] [PubMed] [Google Scholar]
- Bailey HH, Ripple G, Tutsch KD, Arzoomanian RZ, Alberti D, Feierabend C, Mahvi D, Schink J, Pomplun M, Mulcahy RT, Wilding G. Phase I study of continuous-infusion L-S,R-buthionine sulfoximine with intravenous melphalan. Journal of the National Cancer Institute. 1997;89:1789–1796. doi: 10.1093/jnci/89.23.1789. [DOI] [PubMed] [Google Scholar]
- Brechbuhl HM, Gould N, Kachadourian R, Riekhof WR, Voelker DR, Day BJ. Glutathione transport is a unique function of the ATP-binding cassette protein ABCG2. J Biol Chem. 2010;285:16582–16587. doi: 10.1074/jbc.M109.090506. [DOI] [PMC free article] [PubMed] [Google Scholar]
- Brunati AM, Pagano MA, Bindoli A, Rigobello MP. Thiol redox systems and protein kinases in hepatic stellate cell regulatory processes. Free Radic Res. 44:363–378. doi: 10.3109/10715760903555836. [DOI] [PubMed] [Google Scholar]
- Calcagno AM, Fostel JM, To KK, Salcido CD, Martin SE, Chewning KJ, Wu CP, Varticovski L, Bates SE, Caplen NJ, Ambudkar SV. Single-step doxorubicin-selected cancer cells overexpress the ABCG2 drug transporter through epigenetic changes. British journal of cancer. 2008;98:1515–1524. doi: 10.1038/sj.bjc.6604334. [DOI] [PMC free article] [PubMed] [Google Scholar]
- Calvert P, Yao KS, Hamilton TC, O’Dwyer PJ. Clinical studies of reversal of drug resistance based on glutathione. Chemico-biological interactions. 1998;111–112:213–224. doi: 10.1016/s0009-2797(98)00008-8. [DOI] [PubMed] [Google Scholar]
- Circu ML, Aw TY. Reactive oxygen species, cellular redox systems, and apoptosis. Free Radic Biol Med. 48:749–762. doi: 10.1016/j.freeradbiomed.2009.12.022. [DOI] [PMC free article] [PubMed] [Google Scholar]
- Chou TC, Talalay P. Analysis of combined drug effects: a new look at a very old problem. Trends Pharmacol Sci. 1983;4:450–454. [Google Scholar]
- Cole SP, Deeley RG. Transport of glutathione and glutathione conjugates by MRP1. Trends Pharmacol Sci. 2006;27:438–446. doi: 10.1016/j.tips.2006.06.008. [DOI] [PubMed] [Google Scholar]
- Dean M. The NCBI handbook [Internet] Vol. 2002. Bethesda (MD): National Library of Medicine (US), National Center for Biotechnology Information; 2002a. Oct, The Human ATP-Binding Cassette (ABC) Transporter Superfamily. Available from http://www.ncbi.nlm.nih.gov/entrez/query.fcgi?db=Books. [Google Scholar]
- Dean M. The Human ATP-Binding Cassette (ABC) Transporter Superfamily. National Library of Medicine (US); NCBI Bookshelf; Bethesda, MD: 2002b. [Google Scholar]
- Estrela JM, Ortega A, Obrador E. Glutathione in cancer biology and therapy. Critical reviews in clinical laboratory sciences. 2006;43:143–181. doi: 10.1080/10408360500523878. [DOI] [PubMed] [Google Scholar]
- Folmer Y, Schneider M, Blum HE, Hafkemeyer P. Reversal of drug resistance of hepatocellular carcinoma cells by adenoviral delivery of anti-ABCC2 antisense constructs. Cancer gene therapy. 2007;14:875–884. doi: 10.1038/sj.cgt.7701082. [DOI] [PubMed] [Google Scholar]
- Frischer H, Ahmad T. Severe generalized glutathione reductase deficiency after antitumor chemotherapy with BCNU” [1,3-bis(chloroethyl)-1-nitrosourea] The Journal of laboratory and clinical medicine. 1977;89:1080–1091. [PubMed] [Google Scholar]
- Gaudet R. The ABCs of trans(porter) inhibition. Nature chemical biology. 2008;4:454–455. doi: 10.1038/nchembio0808-454. [DOI] [PubMed] [Google Scholar]
- Gerber S, Comellas-Bigler M, Goetz BA, Locher KP. Structural basis of trans-inhibition in a molybdate/tungstate ABC transporter. Science (New York, NY) 2008;321:246–250. doi: 10.1126/science.1156213. [DOI] [PubMed] [Google Scholar]
- Giles GI. The redox regulation of thiol dependent signaling pathways in cancer. Curr Pharm Des. 2006;12:4427–4443. doi: 10.2174/138161206779010549. [DOI] [PubMed] [Google Scholar]
- Grant CE, Gao M, DeGorter MK, Cole SP, Deeley RG. Structural determinants of substrate specificity differences between human multidrug resistance protein (MRP) 1 (ABCC1) and MRP3 (ABCC3) Drug Metab Dispos. 2008;36:2571–2581. doi: 10.1124/dmd.108.022491. [DOI] [PubMed] [Google Scholar]
- Helal GK, Helal OK. Metallothionein attenuates carmustine-induced oxidative stress and protects against pulmonary fibrosis in rats. Arch Toxicol. 2009;83:87–94. doi: 10.1007/s00204-008-0325-7. [DOI] [PubMed] [Google Scholar]
- Jordan J, d’Arcy Doherty M, Cohen GM. Effects of glutathione depletion on the cytotoxicity of agents toward a human colonic tumour cell line. British journal of cancer. 1987;55:627–631. doi: 10.1038/bjc.1987.127. [DOI] [PMC free article] [PubMed] [Google Scholar]
- Kachadourian R, Day BJ. Flavonoid-induced glutathione depletion: potential implications for cancer treatment. Free radical biology & medicine. 2006;41:65–76. doi: 10.1016/j.freeradbiomed.2006.03.002. [DOI] [PMC free article] [PubMed] [Google Scholar]
- Kachadourian R, Leitner HM, Day BJ. Selected flavonoids potentiate the toxicity of cisplatin in human lung adenocarcinoma cells: a role for glutathione depletion. International journal of oncology. 2007;31:161–168. [PMC free article] [PubMed] [Google Scholar]
- Kars MD, Iseri OD, Gunduz U, Molnar J. Reversal of multidrug resistance by synthetic and natural compounds in drug-resistant MCF-7 cell lines. Chemotherapy. 2008;54:194–200. doi: 10.1159/000140462. [DOI] [PubMed] [Google Scholar]
- Klein R, Brown D, Turnley AM. Phenoxodiol protects against Cisplatin induced neurite toxicity in a PC-12 cell model. BMC neuroscience. 2007;8:61. doi: 10.1186/1471-2202-8-61. [DOI] [PMC free article] [PubMed] [Google Scholar]
- Kovacic P. Unifying mechanism for anticancer agents involving electron transfer and oxidative stress: clinical implications. Medical hypotheses. 2007;69:510–516. doi: 10.1016/j.mehy.2006.08.046. [DOI] [PubMed] [Google Scholar]
- Kovacic P, Osuna JA., Jr Mechanisms of anti-cancer agents: emphasis on oxidative stress and electron transfer. Current pharmaceutical design. 2000;6:277–309. doi: 10.2174/1381612003401046. [DOI] [PubMed] [Google Scholar]
- Lee CK, Son SH, Park KK, Park JH, Lim SS, Chung WY. Isoliquiritigenin inhibits tumor growth and protects the kidney and liver against chemotherapy-induced toxicity in a mouse xenograft model of colon carcinoma. Journal of pharmacological sciences. 2008;106:444–451. doi: 10.1254/jphs.fp0071498. [DOI] [PubMed] [Google Scholar]
- Leitner HM, Kachadourian R, Day BJ. Harnessing drug resistance: using ABC transporter proteins to target cancer cells. Biochem Pharmacol. 2007;74:1677–1685. doi: 10.1016/j.bcp.2007.05.014. [DOI] [PMC free article] [PubMed] [Google Scholar]
- Mallery SR, Clark YM, Ness GM, Minshawi OM, Pei P, Hohl CM. Thiol redox modulation of doxorubicin mediated cytotoxicity in cultured AIDS-related Kaposi’s sarcoma cells. Journal of cellular biochemistry. 1999;73:259–277. [PubMed] [Google Scholar]
- Marelli L, Grasso A, Pleguezuelo M, Martines H, Stigliano R, Dhillon AP, Patch D, Davidson BR, Sharma D, Rolles K, Burroughs AK. Tumour size and differentiation in predicting recurrence of hepatocellular carcinoma after liver transplantation: external validation of a new prognostic score. Ann Surg Oncol. 2008;15:3503–3511. doi: 10.1245/s10434-008-0128-3. [DOI] [PubMed] [Google Scholar]
- Mena S, Benlloch M, Ortega A, Carretero J, Obrador E, Asensi M, Petschen I, Brown BD, Estrela JM. Bcl-2 and glutathione depletion sensitizes B16 melanoma to combination therapy and eliminates metastatic disease. Clin Cancer Res. 2007;13:2658–2666. doi: 10.1158/1078-0432.CCR-06-2642. [DOI] [PubMed] [Google Scholar]
- Muller I, Niethammer D, Bruchelt G. Anthracycline-derived chemotherapeutics in apoptosis and free radical cytotoxicity (Review) Int J Mol Med. 1998;1:491–494. doi: 10.3892/ijmm.1.2.491. [DOI] [PubMed] [Google Scholar]
- O’Connor R. The pharmacology of cancer resistance. Anticancer research. 2007;27:1267–1272. [PubMed] [Google Scholar]
- O’Dwyer PJ, Hamilton TC, LaCreta FP, Gallo JM, Kilpatrick D, Halbherr T, Brennan J, Bookman MA, Hoffman J, Young RC, Comis RL, Ozols RF. Phase I trial of buthionine sulfoximine in combination with melphalan in patients with cancer. J Clin Oncol. 1996;14:249–256. doi: 10.1200/JCO.1996.14.1.249. [DOI] [PubMed] [Google Scholar]
- Ozben T. Mechanisms and strategies to overcome multiple drug resistance in cancer. FEBS letters. 2006;580:2903–2909. doi: 10.1016/j.febslet.2006.02.020. [DOI] [PubMed] [Google Scholar]
- Perez-Tomas R. Multidrug resistance: retrospect and prospects in anti-cancer drug treatment. Current medicinal chemistry. 2006;13:1859–1876. doi: 10.2174/092986706777585077. [DOI] [PubMed] [Google Scholar]
- Priebe W, Krawczyk M, Kuo MT, Yamane Y, Savaraj N, Ishikawa T. Doxorubicin- and daunorubicin-glutathione conjugates, but not unconjugated drugs, competitively inhibit leukotriene C4 transport mediated by MRP/GS-X pump. Biochemical and biophysical research communications. 1998;247:859–863. doi: 10.1006/bbrc.1998.8887. [DOI] [PubMed] [Google Scholar]
- Psotova J, Chlopcikova S, Miketova P, Hrbac J, Simanek V. Chemoprotective effect of plant phenolics against anthracycline-induced toxicity on rat cardiomyocytes. Part III. Apigenin, baicalelin, kaempherol, luteolin and quercetin. Phytother Res. 2004;18:516–521. doi: 10.1002/ptr.1462. [DOI] [PubMed] [Google Scholar]
- Rahman I, Kode A, Biswas SK. Assay for quantitative determination of glutathione and glutathione disulfide levels using enzymatic recycling method. Nature protocols. 2006;1:3159–3165. doi: 10.1038/nprot.2006.378. [DOI] [PubMed] [Google Scholar]
- Ramos S. Cancer chemoprevention and chemotherapy: dietary polyphenols and signalling pathways. Molecular nutrition & food research. 2008;52:507–526. doi: 10.1002/mnfr.200700326. [DOI] [PubMed] [Google Scholar]
- Schnelldorfer T, Gansauge S, Gansauge F, Schlosser S, Beger HG, Nussler AK. Glutathione depletion causes cell growth inhibition and enhanced apoptosis in pancreatic cancer cells. Cancer. 2000;89:1440–1447. [PubMed] [Google Scholar]
- Singal PK, Li T, Kumar D, Danelisen I, Iliskovic N. Adriamycin-induced heart failure: mechanism and modulation. Molecular and cellular biochemistry. 2000;207:77–86. doi: 10.1023/a:1007094214460. [DOI] [PubMed] [Google Scholar]
- Sinha BK, Katki AG, Batist G, Cowan KH, Myers CE. Adriamycin-stimulated hydroxyl radical formation in human breast tumor cells. Biochem Pharmacol. 1987;36:793–796. doi: 10.1016/0006-2952(87)90164-x. [DOI] [PubMed] [Google Scholar]
- Sinha BK, Mimnaugh EG, Rajagopalan S, Myers CE. Adriamycin activation and oxygen free radical formation in human breast tumor cells: protective role of glutathione peroxidase in adriamycin resistance. Cancer Res. 1989;49:3844–3848. [PubMed] [Google Scholar]
- Smith TK, Ikeda Y, Fujii J, Taniguchi N, Meister A. Different sites of acivicin binding and inactivation of gamma-glutamyl transpeptidases. Proceedings of the National Academy of Sciences of the United States of America. 1995;92:2360–2364. doi: 10.1073/pnas.92.6.2360. [DOI] [PMC free article] [PubMed] [Google Scholar]
- Soriano AF, Helfrich B, Chan DC, Heasley LE, Bunn PA, Jr, Chou TC. Synergistic effects of new chemopreventive agents and conventional cytotoxic agents against human lung cancer cell lines. Cancer Res. 1999;59:6178–6184. [PubMed] [Google Scholar]
- Takayanagi S, Kataoka T, Ohara O, Oishi M, Kuo MT, Ishikawa T. Human ATP-binding cassette transporter ABCC10: expression profile and p53-dependent upregulation. Journal of experimental therapeutics & oncology. 2004;4:239–246. [PubMed] [Google Scholar]
- Toh S, Wada M, Uchiumi T, Inokuchi A, Makino Y, Horie Y, Adachi Y, Sakisaka S, Kuwano M. Genomic structure of the canalicular multispecific organic anion-transporter gene (MRP2/cMOAT) and mutations in the ATP-binding-cassette region in Dubin-Johnson syndrome. American journal of human genetics. 1999;64:739–746. doi: 10.1086/302292. [DOI] [PMC free article] [PubMed] [Google Scholar]
- Toyoda Y, Hagiya Y, Adachi T, Hoshijima K, Kuo MT, Ishikawa T. MRP class of human ATP binding cassette (ABC) transporters: historical background and new research directions. Xenobiotica; the fate of foreign compounds in biological systems. 2008;38:833–862. doi: 10.1080/00498250701883514. [DOI] [PubMed] [Google Scholar]
- Ueda K, Cardarelli C, Gottesman MM, Pastan I. Expression of a full-length cDNA for the human “MDR1” gene confers resistance to colchicine, doxorubicin, and vinblastine. Proceedings of the National Academy of Sciences of the United States of America. 1987;84:3004–3008. doi: 10.1073/pnas.84.9.3004. [DOI] [PMC free article] [PubMed] [Google Scholar]
- Velsor LW, Kariya C, Kachadourian R, Day BJ. Mitochondrial oxidative stress in the lungs of cystic fibrosis transmembrane conductance regulator protein mutant mice. American journal of respiratory cell and molecular biology. 2006;35:579–586. doi: 10.1165/rcmb.2005-0473OC. [DOI] [PMC free article] [PubMed] [Google Scholar]
- Walle UK, Galijatovic A, Walle T. Transport of the flavonoid chrysin and its conjugated metabolites by the human intestinal cell line Caco-2. Biochemical pharmacology. 1999;58:431–438. doi: 10.1016/s0006-2952(99)00133-1. [DOI] [PubMed] [Google Scholar]
- Wijnholds J, Evers R, van Leusden MR, Mol CA, Zaman GJ, Mayer U, Beijnen JH, van der Valk M, Krimpenfort P, Borst P. Increased sensitivity to anticancer drugs and decreased inflammatory response in mice lacking the multidrug resistance-associated protein. Nature medicine. 1997;3:1275–1279. doi: 10.1038/nm1197-1275. [DOI] [PubMed] [Google Scholar]
- Yang DI, Chen SD, Yin JH, Hsu CY. S-nitrosoglutathione and hypoxia-inducible factor-1 confer chemoresistance against carbamoylating cytotoxicity of BCNU in rat C6 glioma cells. Annals of the New York Academy of Sciences. 2005;1042:229–234. doi: 10.1196/annals.1338.025. [DOI] [PubMed] [Google Scholar]
Associated Data
This section collects any data citations, data availability statements, or supplementary materials included in this article.
Supplementary Materials
GSH maintenance enzyme network in A549, H157, H460 and H1975 cancer cells. GSH synthesis enzymes in all 4 cell lines indicate that the lung epithelial cancer cells have a high capacity to regulate cellular GSH levels. In general the A549 cells express GSH synthesis enzymes to the greatest degree, followed by H157, H1975 and H460 cells. GSTs have an important role in facilitating rapid conjugation of DOX to GSH. All four cell types have a very robust GST profile, indicating a large ability for these cells to perform GSH conjugation reactions.
Percent gene expression of the GSH maintenance enzyme networks in A549, H157, H460 and H1975 cancer cells. The percent gene expression for a target was determined by assigning the cell with the greatest expression for that target (from data in Supplemental Table 1) the value of 100 percent. For each target, the cells were compared as a percentage of 100.