

Abstract
Background
Hydrogen sulfide (H2S), an endogenous vasoactive agent, is produced by cystathionine γ-lyase (CGL) and cystathionine β-synthase (CBS) enzymes. This study was conducted to evaluate the relative contribution of these enzymes in regulating systemic arterial pressure.
Methods
Sprague–Dawley rats were chronically treated with CGL inhibitor, -propargylglycine (PAG, 37.5 mg/kg/day; intraperitoneally, i.p.) or CBS inhibitor, aminooxyacetic acid (AOA, 8.75 mg/kg/day; i.p.) or in combination for 4 weeks and the effects on arterial pressure (tail-cuff plethysmography) and renal excretory function (24 h urine collections using metabolic cages) were assessed once in a week. Changes in renal blood flow (RBF; Ultrasonic flowmetry) and glomerular filtration rate (GFR; Inulin clearance) were assessed in acute experiments in anesthetized rats at the end of treatment period.
Results
Compared to vehicle treated control group, only the rats with combination therapy showed a decrease in urinary sulfate excretion rate (248 ± 47 vs. 591 ± 70 nmol/24 h; marker for endogenous H2S level) which was associated with an increase in mean arterial pressure (MAP; 130 ± 2 vs. 99 ± 2 mm Hg). Urine flow and sodium excretion were also increased in combination group as consequent to the increase in MAP. GFR did not alter due to these treatments but RBF was lowered (4 ± 0.3 vs. 7 ± 0.4 ml/min/g) only in the combination group compared to the control group.
Conclusion
These findings indicate that a deficiency in one enzyme's activity could be compensated by the activity of the other to maintain the endogenous H2S level, the deficiency of which modulates systemic and renal vascular resistances leading to the development of hypertension.
Keywords: aminooxyacetic acid, blood pressure, dl-propargylglycine, hypertension, hydrogen sulfide, renal hemodynamics, sodium excretion
Hydrogen sulfide (H2S), a gaseous molecule is known to be synthesized endogenously in the mammalian tissues from the amino acid -cysteine. Although considered as an environmental toxic gas, endogenously produced H2S is now appreciated as gaseous signalling molecule alongside nitric oxide (NO) and carbon monoxide that modulates many physiological functions of the human body at molecular and systemic levels.1 It is generated mainly by the action of two tissue specific enzymes named cystathionine γ-lyase (CGL) and cystathionine β-synthase (CBS) on the substrate -cysteine. At present, the distribution of CGL and CBS throughout the body is not well characterized. However, it is reported that CGL is the major H2S producing enzyme in the cardiovascular system and is present in the vascular smooth muscle as well as the endothelium.2,3 On the other hand, CBS is mainly present in nervous tissues; although, its presence is also reported in many vascular tissues.4 Recently, it has also been suggested that another enzyme, 3-Mercaptopyruvate sulfurtransferase, which is specifically localized to neuronal tissue, is also involved in the generation of this gaseous molecule in the brain.5 However, only CGL and CBS enzymes are mainly present in liver and kidney tissues that are important for not only the metabolism of sulfur containing amino acids, but also the production of H2S, which may exert various functions in different tissues.6
Recent studies have implicated an important role for endogenously formed H2S as a critical regulator of cardiovascular homeostasis. H2S has been characterized as autocrine/paracrine messenger implicated in the control of vascular tone. It has been demonstrated that H2S-donor compound, sodium hydrogen sulfide (NaHS), causes dose-dependent relaxations of the isolated rat aorta2,7,8 and mesenteric arteries.9 Administration of NaHS, both acutely and chronically, caused reduction in blood pressure in hypertensive rats induced by NO synthase inhibition.10 However, conflicting findings were reported in mice with disrupted CGL enzyme as it was observed in one study3 that CGL knock-out mice developed hypertension after seventh week of age but other study11 have shown that such knock-out mice were usually normotensive. Although it is generally accepted that the action of CGL in the cardiovascular system is responsible for the effect of H2S on cardiovascular function, the activity of CBS may also play an important role in modulating vascular tone via its effects on autonomic nervous system.12 It is reported that H2S is critical in maintaining the excitatory/inhibitory balance in neurotransmission and thus serves as a novel neuromodulator.13 Although no specific mechanism has yet been identified, it may be possible that H2S exerts an inhibitory effect on sympathetic nerve activity and thus modulates vascular tone to maintain blood pressure homeostasis.12 However, the relative contribution of CGL- and CBS-mediated production of H2S in the regulation of blood pressure and the deficiency of their activities in the pathophysiology of hypertension is not yet clearly known.
We hypothesized that as CGL enzyme is present mostly in the vascular tissue, H2S production induced by the CGL activity would play a more predominant role in the regulation of systemic blood pressure compared to the activity of CBS which is primarily located in the nervous tissue. In this study, we examined the effects of chronic administration of the inhibitors of CGL (-propargylglycine; PAG)14 and CBS (aminooxyacetic acid; AOA)6 in rats for a 4-week period to determine the relative contribution of these enzymes in regulating blood pressure. As the kidney plays a key-regulatory role in maintaining systemic blood pressure, the effects of chronic inhibition of CGL and CBS on renal hemodynamic and excretory function are also assessed in this study.
Methods
All of the experimental procedures described in this study were approved by and performed in accordance with the guidelines and practices established by the Tulane University Animal Care and Use Committee. These experiments were conducted on male Sprague–Dawley rats weighing 250–300 g body weight (8 week-old) that were purchased from Charles River Laboratories (Wilmington, MA), housed in a temperature- and light-controlled room in the Tulane University Vivarium, and allowed free access to a standard diet and tap water. The rats were divided into four groups (n = 6 in each group) according to chronic drug treatment as described below:
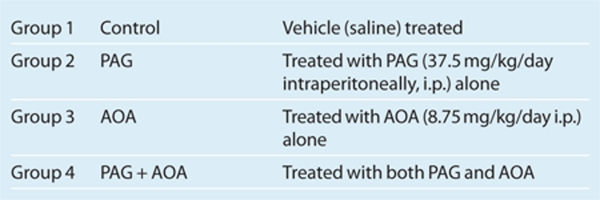 The doses of PAG (37.5 mg/kg/day i.p.) and AOA (8.75 mg/kg/day i.p.) for chronic daily injections were considered as these doses were calculated based on the assumption that the injected would be completely absorbed into the blood circulation and reach a circulating concentration around 5 mmol/l and 1 mmol/l for PAG and AOA respectively. These concentrations were shown to cause maximal inhibitory effect on H2S production in vitro in rat aortic14 and in liver tissue.6 These rats were exposed to the experimental procedures for a week prior to the beginning of the actual experiments in order to minimize the effects of environmental and procedural stresses on the experimental results. Both chronic studies at the conscious state and acute experiments under anesthesia at the end of chronic experimental periods were performed in these rats.
Chronic experiments. In the chronic studies, blood pressure was measured using tail-cuff plethysmography, and 24-h urine collections were made using metabolic cages in conscious rats. Baseline blood pressure and urine collections were obtained on the day prior to the start of daily drug treatment. During the 4-week treatment period, blood pressure and 24-h urine collections were made at the end of each week. On each occasion, blood pressure was measured first and then the rats were placed in metabolic cages for 24 h for urine collections. After noting the volume of urine-output, all urine samples were kept frozen (−20 °C) until analyzed for sulfate, sodium, and potassium concentrations in the urine.
Acute experiments. At the end of the 4-week chronic experimental period, the rats were anesthetized with thiobutabarbital sodium (Inactin; Sigma-Aldrich, St Louis, MO) at a dose of 100 mg/kg i.p. Supplemental doses of anesthesia were administered throughout the experimental period as required. The rats were placed on a servo-controlled surgical table that maintained body temperature at 37 °C. Tracheostomy was performed, and the animals were continuously provided with a mixture of 95% O2 and 5% CO2 through the endotracheal tube (PE-200).15 The right jugular vein was cannulated for the intravenous administration of an isotonic saline solution containing 1% albumin and 7.5% inulin (Inutest, Laevosan, Linz/Donau, Austria) as well as for supplemental doses of anesthesia. The right femoral artery was catheterized, and the cannula was connected to a pressure transducer to allow for continuous monitoring of arterial blood pressure using the AcqKnowledge data acquisition system (Biopac). The left kidney was exposed via a left-flank incision and placed in a lucite cup, and the left ureter was cannulated with a PE-10 catheter for urine collection. An ultrasonic flow probe (Transonic System) was placed on the left renal artery to measure total renal blood flow (RBF).15 Laser-Doppler flow probes (500 µm OD, Periflex 4001; Perimed) were used to measure the regional blood flow in the kidney.15,16 Cortical blood flow was measured by a Laser-Doppler flow probe placed on the surface of the kidney, and medullary blood flow was measured by a needle Laser-Doppler flow probe inserted ~3 mm deep into the left kidney. After a 60-min equilibration period following completion of surgical procedures, urine collections for two consecutive 30-min clearance periods were made with collections of corresponding blood samples and recordings of hemodynamic parameters. All blood and urine samples were kept frozen (−20°C) until analyzed for concentrations of inulin.
Measurement of proteins level and expressions of CGL and CBS in the renal tissue. At the end of the experiments, 29 or 30 days following the start of the treatment with inhibitors, rats were killed and the right kidneys were sagittally sectioned to use one half fixed in formalin for immunohistochemistry for localization CGL and CBS proteins in the renal tissues, and the other half was snap-frozen for eventual western blot analysis. CGL and CBS immunohistochemistry were performed in formalin fixed renal tissue sections (3 µm) by peroxidase technique using specific antibodies for CGL (cat no H00001434-M01; Abnova) and CBS (cat no H00000875-M01; Abnova) respectively at 1:3,000 and 1:500 dilutions to determine the distribution of the specific proteins and their changes during chronic treatments with PAG and AOA. Semi-quantitation of immunoreactivity was performed using NIS Elements AR version 3.0 software; (Nikon). In addition, whole kidney samples were used to measure CGL and CBS protein levels by western blot. The proteins were electrophoretically transferred to a nitrocellulose membrane (Invitrogen, Carsbad, CA) using iBlot (Invitrogen), blocked with Odyssey blocking buffer (LI-COR Biosciences, Lincoln, NE) followed by the incubation overnight at 4 °C with the primary antibodies mouse anti-CGL (1:500 dilution) and mouse anti-CBS (1:1,000 dilution). Detection was accomplished using an Odyssey fluorescent scanner.
Analytical procedures for blood and urine samples and statistical analysis. Urinary excretion rate of sulfate (USV) is determined by analyzing urine samples acquired from the chronic experiments using Zinc-trapping and colorimetry method.17,18 The changes in USV are considered as an indicator for assessing the status of endogenous H2S production in the animals used in this study. The concentrations of sodium and potassium in urine samples were determined by flame-photometry. Spectrophotometry was used to determine inulin levels in the urine and blood samples obtained during the acute experiment. The value of inulin clearance was considered as glomerular filtration rate (GFR). Data are expressed as means ± SE. Statistical comparisons of differences in means were done by one-way ANOVA followed by Holm-Sidak post hoc t-tests. Differences in the mean values were deemed significant at P < 0.05.
Results
Effect of chronic PAG and AOA treatment on USV
These effects are summarized in Figure 1. Inhibition of CGL or CBS by chronic treatments of PAG or AOA alone had no significant effect on USV. However, the combination therapy of these inhibitors resulted in significant decreases in USV after the second week of treatment period (240 ± 18 vs 591 ± 70 nmol/24 h; P < 0.05) compared to values at day 0 (D0) which remains unaltered on the fourth week of treatment (248 ± 50 nmol/24 h; P < 0.05). This finding indicated that the dose of combination therapy was effective in causing substantial inhibition (>50%) of endogenous H2S production. Although changes in USV is considered as an indicator for assessing the changes in endogenous H2S production, it should be noted here that USV may also represent the dietary and other metabolic sources of sulfur.19 However, as it was ensured that the animals of similar age and sex in different groups were given identical diet and housed in identical condition, the contribution of other sources of sulfur was deemed minimal in causing the observed changes in USV.
Figure 1.

Urinary excretion rate of sulfate (USV) responses to chronic inhibition of H2S production (data from the chronic experiments). PAG, -propargylglycine (CGL inhibitor); AOA, aminooxyacetic acid (CBS inhibitor). *P < 0.05 vs. values on day 0 (D0). AOA, aminooxyacetic acid; CBS, cystathionine β-synthase; CGL, cystathionine γ-lyase; PAG, -propargylglycine.
Effect of chronic treatment of PAG and AOA on mean arterial blood pressure
The changes in mean arterial pressure (MAP) in each group of rats are illustrated in Figure 2. It was observed that the treatment with PAG or AOA alone for 4 weeks did not alter MAP in rats. However, in the group of rats that were treated with combination therapy of both PAG and AOA, MAP increased gradually from 99 ± 2 mm Hg at D0 to 130 ± 1 mm Hg (P < 0.05) at the end of 4-week treatment period. However, significant difference was noted at the end of third week (130 ± 2; P < 0.05) but not at the end of second week (114 ± 5 mm Hg; P = n.s.) treatment period when compared to the values at D0. It was noted that the changes in USV (significant changes at the end of second week) were preceded the changes in MAP (significant changes at the end of third week).
Figure 2.

Mean blood pressure (MBP) responses to chronic inhibition of H2S production (data from the chronic experiments). *P < 0.05 vs. values on day 0 (D0). AOA, aminooxyacetic acid (CBS inhibitor); CBS, cystathionine β-synthase; CGL, cystathionine γ-lyase; PAG, -propargylglycine (CGL inhibitor).
Effects of chronic treatment of PAG and AOA on urine flow, urinary excretion of sodium and potassium
The results of these measurements are summarized in Figures 3 and 4. Urine flow (V; Figure 3), urinary excretion rate of sodium (UNaV; Figure 4) and urinary excretion of potassium did not alter during treatment of PAG or AOA alone. However, in the combined therapy group, V was increased gradually from 12.7 ± 0.8 ml/day on D0 to 38.8 ± 5.4 ml/day (P < 0.05) at the fourth week treatment period. Similar to the response on V, urinary excretion rate of sodium (UNaV; Figure 4) were also increased in combination therapy group. UNaV was increased gradually from 3.6 ± 0.5 mmol/day on D0 to 13.4 ± 3.1 mmol/day (P < 0.05) at the fourth week treatment period. However, the changes in urinary excretion of potassium during combination therapy were not statistically different during the treatment period (2.4 ± 0.2 mmol/day on D0 to 3.2 ± 0.3, 5.1 ± 0.7, 4.5 ± 0.4, and 4.3 ± 1.2 mmol/day at the end of first, second, third, and fourth week period of treatment respectively.)
Figure 3.

Urine flow (V) responses to chronic inhibition of H2S production (data from the chronic experiments). *P < 0.05 vs. values on day 0 (D0). AOA, aminooxyacetic acid (CBS inhibitor); CBS, cystathionine β-synthase; CGL, cystathionine γ-lyase; PAG, -propargylglycine (CGL inhibitor).
Figure 4.

Urinary excretion rate of sodium (UNaV) responses to chronic inhibition of H2S production (data from the chronic experiments). *P < 0.05 vs. values on day 0 (D0). AOA, aminooxyacetic acid (CBS inhibitor); CBS, cystathionine β-synthase; CGL, cystathionine γ-lyase; PAG, -propargylglycine (CGL inhibitor).
Effects of chronic treatment of PAG and AOA on renal blood flow and glomerular filtration rate
The results obtained from acute experiments at the end of 4-week treatment period, are provided in Table 1. The total RBF was significantly lower in rats with combination therapy compared to that in the vehicle treated group as well as in groups treated with PAG or AOA alone. Similarly, regional blood flow (cortical blood flow and medullary blood flow) was also lower in the combination therapy group compared to the values in other groups. However, the values of GFR were not significantly different in any of these treatment groups compared to the vehicle treated group.
Table 1. Renal hemodynamic parameters after 4 weeks of H2S inhibition (data from the acute experiments).

Immunohistochemistry analysis of CGL and CBS in renal tissues
CGL and CBS immunoreactivity and densitometric analysis in kidney slices are illustrated in Figure 5 and Figure 6, respectively. As illustrated in Figure 5a, CGL was mainly located in renal vasculature as well as in distal nephron segments in tissues taken vehicle treated control rats. Mean data from the densitometric analysis of the intensity of CGL immunoreactivity in these kidney sections are illustrated in Figure 5e. It was observed that CGL immunoreactivity increased nearly threefold in PAG treated rats and nearly twofold in rats subjected to combination therapy compared to vehicle treated group. This enhancement in CGL immune-expression in combined treatment group was significantly lower than that in PAG treated group. There was no change in CGL intensity in AOA treated group. On the other hand, CBS immunostaining was observed exclusively in intracellular compartment of proximal tubular cells in control rats (Figure 6a). Similar distribution, though with markedly increased immunointensity, was observed in kidney sections from rats treated with combination therapy. It should be noted that CBS immunoreactivity was mainly observed at the brush border but not intracellularly in the proximal tubular cells in rats treated with either PAG or AOA alone. This CBS immunoreactivity was absent in the glomeruli and other tubular segments as well as in renal vasculature. Mean data from the densitometric analysis of the CBS intensity in these kidney sections are illustrated in Figure 6e. CBS immunoreactivity was slightly but significantly increased in combination therapy group compared to PAG alone treated group.
Figure 5.

CGL Immunoreactivity and Densitometric analysis in kidney slices: CGL immunoreactivity (Brown staining with 3,3- diaminobenzidine) in paraffin embedded kidney sections (5 µm) from controls (a) and treated groups (b–d) was observed in the apical aspect of the renal vasculature and in collecting ducts cells. Mean data from the densitometric analysis of the CGL intensity in these kidney sections from control rats (panel a) and the rats treated with either PAG (panel b), AOA (panel c) or combination of both (PAG + AOA; panel d) are illustrated in e. Values are mean ± s.e. *P < 0.0001 vs. control; #P < 0.0001 vs. PAG; $P < 0.0001 vs. AOA. Magnification: 400X. AOA, aminooxyacetic acid; CD, collecting duct; CGL, cystathionine γ-lyase; Glom, glomerulus; PAG, -propargylglycine; PT, proximal tubule.
Figure 6.

CBS immunoreactivity and densitometric analysis in kidney slices: CBS immunoreactivity (Brown staining with 3,3- diaminobenzidine) was observed exclusively in intracellular compartment of proximal tubular (PT) cells of paraffin embedded kidney (5 µm) sections of control rats. Similar distribution, though with marked increased immunointensity, was observed in kidney sections from rats treated with combination (PAG + AOA) therapy (panel d). It should be noted that CBS immunoreactivity was mainly observed at the brush border but not intracellularly in the PT cells in rats treated either PAG (panel b) or AOA (panel c) alone. Glomeruli, other tubular segments and renal vasculature were negative. Mean data from the densitometric analysis of the CBS intensity in these kidney sections are illustrated in e. Values are mean ± s.e. *P < 0.05 vs. PAG treated group only. Magnification: 200X. AOA, aminooxyacetic acid; CBS, cystathionine β-synthase; CD, collecting duct; Glom, glomerulus; PAG, -propargylglycine.
Western blot analysis of CGL and CBS in renal tissue
Further quantification of the levels of these enzyme proteins in the renal tissues by western blot analysis revealed that PAG and PAG plus AOA treatments significantly increased CGL protein levels (25 kDa)20 in whole kidney samples compared to controls (PAG: 3.0 ± 0.3; PAG + AOA: 1.7 ± 0.4 vs. control: 1.0 ± 0.1-fold change; P < 0.01; n = 4 in each cases) but not AOA alone (1.0 ± 0.1) (Figure 7a). In contrast, these treatments did not alter the protein levels of CBS (63 kDa)21 in the kidney (PAG: 0.7 ± 0.04; AOA: 1.1 ± 0.3; PAG + AOA: 0.8 ± 0.1; vs. control: 1.0 ± 0.1-fold change; P = 0.02; n = 4 in each cases) (Figure 7b). These results of the protein levels quantified by western blot were comparable with those observed with immunohistochemistry analysis as above.
Figure 7.

Representative western blots showing CGL (Upper panel; a) and CBS (Lower panel; b) protein levels in whole kidney samples (n = 4 in each cases) from the control rats and the rats treated with either PAG (-propargylglycine; CGL inhibitor), AOA (aminooxyacetic acid; CBS inhibitor) or combination of both (PAG + AOA). Densitometric analyses were done against β actin, used as loading control. Control levels were defined as the unit. *P < 0.01 vs. control, #P < 0.01 vs. PAG. CBS, cystathionine β-synthase; CGL, cystathionine γ-lyase.
Discussion
In the present investigation, we have demonstrated that chronic administration of the inhibitors of both CGL and CBS enzymes in combination for 4 weeks in rats resulted in a decrease in USV which is considered as an indicator for endogenous H2S production. Although the doses of these inhibitors independently were shown to be effective in preventing H2S generation in rat aortic14 and liver6 tissues, the level of USV was not altered by these doses when given individually in this study. The changes in USV were also associated with increases in MAP in the combination therapy group. It was noted that the changes in USV (at the second week) preceded the changes in MAP (at the third week) indicating that a deficiency in H2S production leads to an increase in arterial pressure. These findings demonstrate that the reduction in H2S production in the vascular system occurred only when activities of both H2S producing enzymes (CGL and CBS) were simultaneously blocked. These results suggest that the deficiency in the activity of one enzyme could be compensated by the activity of the other in maintaining the endogenous production level of H2S.
Although USV or blood pressure did not alter during 4 weeks of treatment with PAG alone in this study, the same dose administration of this CGL inhibitor in a previous study in rats14 reported a reduction in plasma level of H2S and associated increase in blood pressure at the end of more than 5 weeks treatment period. This apparent discrepancy seems related to the difference in the period of treatment with the inhibitor. CGL expressions in the renal tissue were also not reduced (rather increased) during 4-week period of PAG treatment in the present study. However, the results from the previous study14 indicate that CGL expression as well as the reductions in tissue and plasma H2S levels in the aortic tissue was decreased only after 5-week period of treatment with the enzyme inhibitor. These results may indicate a time dependency of this inhibitor's ability on reducing endogenous H2S production that contributes to increase in arterial pressure. It is also noted that a considerable time-delay exists in mediating the response to a deficiency in CGL activity and the consequent increases in blood pressure. The knock-out mice lacking the gene for CGL usually not hypertensive at early age3,11 but developed hypertension after at least after 7 weeks of age.3
A link between H2S deficiency and an increase in arterial pressure has been suggested in many previous studies.10,22,23 A deficient level of plasma H2S was reported in hypertensive rat models such as SHR when compared to the level in normotensive WKY rat models.14 Hypertension induced by treatment with NO synthase inhibitors in rats was also associated with a decrease in plasma H2S level.10 On the other hand, systemic administration of the H2S-donor compound NaHS resulted in hypotension in many previous studies.7,10,23 In one study, it was reported that the genetic deletion of CGL enzymes in mice resulted in nearly 50% reduction in the plasma level of H2S, which was associated with ~20–25 mm Hg increases in MAP.3 In the present study in rats, we also observed comparable changes in MAP (~25 mm Hg) in response to combination therapy with PAG and AOA that resulted in nearly a 50% reduction in USV, indicating a similar reduction in the plasma level of H2S in rats as reported in earlier studies on mice.3
The cardiovascular effects of H2S have been demonstrated in experimental studies in vivo10 and in vitro.2,7,8,9 Most of these studies provided evidence that H2S is a novel gaseous vasorelaxant agent, acting by directly increasing KATP channel currents and hyperpolarizing the cellular membrane.7 However, as opposed to other gaso-transmitters such as NO and carbon monoxide, H2S-induced vasorelaxation is not mediated by the cyclic guanosine 3′,5′-monophosphate signaling pathway, but rather by the cyclic adenosine 3′,5′-monophosphate signaling pathway.24,25,26 It is suggested that H2S is acting as a putative endothelium dependent hyperpolarizing factor, thus reducing the extracellular Ca2+ entry and relaxing vascular smooth muscle cells.27 Although acting as a vasorelaxant, H2S also caused inhibition of vascular smooth muscle cells' proliferation and induced apoptosis in some in vitro studies.28,29 Thus, a generalized vasoconstriction and structural remodeling by vascular smooth muscle cells' proliferation may be involved in the hypertensive response to the chronic H2S deficiency in the present study.
Associated with increases in MAP in the present study, there were also reductions in total RBF and regional blood flow (cortical blood flow and medullary blood flow) in the kidney due to this combination therapy, demonstrating that the reduction in H2S formation resulted in increases in systemic as well as in renal vascular resistances. In the present study, there was no appreciable change in GFR though RBF decreased in rats chronically treated with combined administration of PAG and AOA. This indicates that there were proportionate reductions in vascular resistances in both afferent and efferent arterioles during chronic combination therapy that maintained the net glomerular pressure at a steady state30 and thus, GFR remains unchanged. The increases in urine flow and sodium excretion in the rats treated with both PAG and AOA in combination is likely to be related to pressure-diuresis and natriuresis phenomenon as MAP increased in rats with this combination therapy.16 These data suggest that the hypertensive response to chronic H2S deficiency may be primarily due to its' effect on systemic vascular resistance. However, as the renal excretory function could be influenced by the systemic effects of these inhibitors, it may not be possible to determine the specific functional effects of CGL and CBS inhibition in the kidney from the present results. It was also reported23 that acute administration of PAG and AOA in combination directly in the kidney caused reductions in GFR, urine flow, and sodium excretion without appreciable change in RBF or systemic arterial pressure. Although these renal excretory changes to acute administration of CGL and CBS inhibitors23 seem apparently contradictory with the findings in the present chronic study, it should be noted here that these responses to H2S deficiency in both these studies were only observed when these inhibitors were administered in combination but not in alone. Thus the findings in these studies (23 and the current study) are supportive of the conclusion that endogenous H2S level is interdependently maintained by the activity of these enzymes.
In the present study, it was observed that chronic PAG treatment enhanced CGL immune-expression as well as protein levels in the renal tissue that was slightly reversed but remained high at significant level in rats treated with combination therapy as determined by both immune-staining (Figure 5) and western blot analysis (Figure 7a). The reason for such enhancement of CGL protein expression during chronic PAG administration with or without AOA treatment is not yet clearly understood. However, it seems that inhibition of CGL enzymatic activity by PAG caused a compensatory stimulation of the synthesis of it own enzyme proteins. Such up-regulation of specific enzyme protein expressions in response to chronic treatment with its inhibitor agent may not be entirely unexpected. For example, angiotensinogen mRNA was also seen up-regulated during chronic treatment with angiotensin converting enzyme inhibitors.31 However, chronic AOA treatment alone in the present study did not show any marked changes in the protein levels of CBS or CGL in the renal tissue (Figures 6 and 7b). It is interesting to note that the immunohistochemistry analysis of renal tissues in the present study demonstrated that CGL was mainly located in renal vasculature as well distal nephron segments while CBS was located only in the proximal tubules. These data demonstrate distinctive tubular locations of CBS (proximal tubule) and CGL (distal tubules and collecting ducts) that warrants further experiments to determine the differential regulation of tubular function by these H2S producing enzymes.
In conclusion, the findings in the present investigation indicate that the functional deficiency in the activity of one H2S producing enzyme could be compensated by the activity of the other to maintain the endogenous H2S production level. The present data demonstrate that chronic H2S deficiency caused increases in vascular resistance leading to renal vasoconstriction and systemic hypertension. These data suggest that the hypertensive response to chronic H2S deficiency may be primarily due to its effect of increasing systemic vascular resistance.
Acknowledgments
The authors are grateful to Alexander Castillo, BS and Camille Bourgeois, BS for their excellent technical assistance in this study. This study was supported by National Heart Lung and Blood Institute Grant HL-66432 (D.S.A.M.), American Heart Association (09BGIA2280440; M.C.P.) and Tulane Enhancement Fund (D.S.A.M.).
The authors declared no conflict of interest.
References
- Tang CS, Li XH, Du JB. Hydrogen sulfide as a new endogenous gaseous transmitter in the cardiovascular system. Curr Vasc Pharmacol. 2006;4:17–22. doi: 10.2174/157016106775203144. [DOI] [PubMed] [Google Scholar]
- Hosoki R, Matsuki N, Kimura H. The possible role of hydrogen sulfide as an endogenous smooth muscle relaxant in synergy with nitric oxide. Biochem Biophys Res Commun. 1997;237:527–531. doi: 10.1006/bbrc.1997.6878. [DOI] [PubMed] [Google Scholar]
- Yang G, Wu L, Jiang B, Yang W, Qi J, Cao K, Meng Q, Mustafa AK, Mu W, Zhang S, Snyder SH, Wang R. H2S as a physiologic vasorelaxant: hypertension in mice with deletion of cystathionine gamma-lyase. Science. 2008;322:587–590. doi: 10.1126/science.1162667. [DOI] [PMC free article] [PubMed] [Google Scholar]
- Abe K, Kimura H. The possible role of hydrogen sulfide as an endogenous neuromodulator. J Neurosci. 1996;16:1066–1071. doi: 10.1523/JNEUROSCI.16-03-01066.1996. [DOI] [PMC free article] [PubMed] [Google Scholar]
- Shibuya N, Tanaka M, Yoshida M, Ogasawara Y, Togawa T, Ishii K, Kimura H. 3-Mercaptopyruvate sulfurtransferase produces hydrogen sulfide and bound sulfane sulfur in the brain. Antioxid Redox Signal. 2009;11:703–714. doi: 10.1089/ars.2008.2253. [DOI] [PubMed] [Google Scholar]
- Zhao W, Ndisang JF, Wang R. Modulation of endogenous production of H2S in rat tissues. Can J Physiol Pharmacol. 2003;81:848–853. doi: 10.1139/y03-077. [DOI] [PubMed] [Google Scholar]
- Zhao W, Zhang J, Lu Y, Wang R. The vasorelaxant effect of H(2)S as a novel endogenous gaseous K(ATP) channel opener. EMBO J. 2001;20:6008–6016. doi: 10.1093/emboj/20.21.6008. [DOI] [PMC free article] [PubMed] [Google Scholar]
- Zhao W, Wang R. H(2)S-induced vasorelaxation and underlying cellular and molecular mechanisms. Am J Physiol Heart Circ Physiol. 2002;283:H474–H480. doi: 10.1152/ajpheart.00013.2002. [DOI] [PubMed] [Google Scholar]
- Cheng Y, Ndisang JF, Tang G, Cao K, Wang R. Hydrogen sulfide-induced relaxation of resistance mesenteric artery beds of rats. Am J Physiol Heart Circ Physiol. 2004;287:H2316–H2323. doi: 10.1152/ajpheart.00331.2004. [DOI] [PubMed] [Google Scholar]
- Zhong G, Chen F, Cheng Y, Tang C, Du J. The role of hydrogen sulfide generation in the pathogenesis of hypertension in rats induced by inhibition of nitric oxide synthase. J Hypertens. 2003;21:1879–1885. doi: 10.1097/00004872-200310000-00015. [DOI] [PubMed] [Google Scholar]
- Ishii I, Akahoshi N, Yamada H, Nakano S, Izumi T, Suematsu M. Cystathionine gamma-Lyase-deficient mice require dietary cysteine to protect against acute lethal myopathy and oxidative injury. J Biol Chem. 2010;285:26358–26368. doi: 10.1074/jbc.M110.147439. [DOI] [PMC free article] [PubMed] [Google Scholar]
- Kulkarni KH, Monjok EM, Zeyssig R, Kouamou G, Bongmba ON, Opere CA, Njie YF, Ohia SE. Effect of hydrogen sulfide on sympathetic neurotransmission and catecholamine levels in isolated porcine iris-ciliary body. Neurochem Res. 2009;34:400–406. doi: 10.1007/s11064-008-9793-7. [DOI] [PubMed] [Google Scholar]
- Han Y, Qin J, Chang X, Yang Z, Bu D, Du J. Modulating effect of hydrogen sulfide on gamma-aminobutyric acid B receptor in recurrent febrile seizures in rats. Neurosci Res. 2005;53:216–219. doi: 10.1016/j.neures.2005.07.002. [DOI] [PubMed] [Google Scholar]
- Yan H, Du J, Tang C. The possible role of hydrogen sulfide on the pathogenesis of spontaneous hypertension in rats. Biochem Biophys Res Commun. 2004;313:22–27. doi: 10.1016/j.bbrc.2003.11.081. [DOI] [PubMed] [Google Scholar]
- Matavelli LC, Kadowitz PJ, Navar LG, Majid DS. Renal hemodynamic and excretory responses to intra-arterial infusion of peroxynitrite in anesthetized rats. Am J Physiol Renal Physiol. 2009;296:F170–F176. doi: 10.1152/ajprenal.90487.2008. [DOI] [PMC free article] [PubMed] [Google Scholar]
- Majid DS, Godfrey M, Navar LG. Pressure natriuresis and renal medullary blood flow in dogs. Hypertension. 1997;29:1051–1057. doi: 10.1161/01.hyp.29.4.1051. [DOI] [PubMed] [Google Scholar]
- Stipanuk MH, Beck PW. Characterization of the enzymic capacity for cysteine desulphhydration in liver and kidney of the rat. Biochem J. 1982;206:267–277. doi: 10.1042/bj2060267. [DOI] [PMC free article] [PubMed] [Google Scholar]
- Siegel LM. A direct microdetermination for sulfide. Anal Biochem. 1965;11:126–132. doi: 10.1016/0003-2697(65)90051-5. [DOI] [PubMed] [Google Scholar]
- Ishigami M, Hiraki K, Umemura K, Ogasawara Y, Ishii K, Kimura H. A source of hydrogen sulfide and a mechanism of its release in the brain. Antioxid Redox Signal. 2009;11:205–214. doi: 10.1089/ars.2008.2132. [DOI] [PubMed] [Google Scholar]
- Bruinenberg PG, De Roo G, Limsowtin G. Purification and characterization of cystathionine (gamma)-lyase from lactococcus lactis subsp. cremoris SK11: Possible role in flavor compound formation during cheese maturation. Appl Environ Microbiol. 1997;63:561–566. doi: 10.1128/aem.63.2.561-566.1997. [DOI] [PMC free article] [PubMed] [Google Scholar]
- Skovby F, Kraus JP, Rosenberg LE. Biosynthesis of human cystathionine beta-synthase in cultured fibroblasts. J Biol Chem. 1984;259:583–587. [PubMed] [Google Scholar]
- Zhang C, Du J, Bu D, Yan H, Tang X, Tang C. The regulatory effect of hydrogen sulfide on hypoxic pulmonary hypertension in rats. Biochem Biophys Res Commun 2003. 302:810–816. doi: 10.1016/s0006-291x(03)00256-0. [DOI] [PubMed] [Google Scholar]
- Xia M, Chen L, Muh RW, Li PL, Li N. Production and actions of hydrogen sulfide, a novel gaseous bioactive substance, in the kidneys. J Pharmacol Exp Ther. 2009;329:1056–1062. doi: 10.1124/jpet.108.149963. [DOI] [PMC free article] [PubMed] [Google Scholar]
- Furchgott RF, Jothianandan D. Endothelium-dependent and -independent vasodilation involving cyclic GMP: relaxation induced by nitric oxide, carbon monoxide and light. Blood Vessels. 1991;28:52–61. doi: 10.1159/000158843. [DOI] [PubMed] [Google Scholar]
- Kimura H. Hydrogen sulfide induces cyclic AMP and modulates the NMDA receptor. Biochem Biophys Res Commun. 2000;267:129–133. doi: 10.1006/bbrc.1999.1915. [DOI] [PubMed] [Google Scholar]
- Lim JJ, Liu YH, Khin ES, Bian JS. Vasoconstrictive effect of hydrogen sulfide involves downregulation of cAMP in vascular smooth muscle cells. Am J Physiol, Cell Physiol. 2008;295:C1261–C1270. doi: 10.1152/ajpcell.00195.2008. [DOI] [PubMed] [Google Scholar]
- Wang R. Hydrogen sulfide: a new EDRF. Kidney Int. 2009;76:700–704. doi: 10.1038/ki.2009.221. [DOI] [PubMed] [Google Scholar]
- Du J, Hui Y, Cheung Y, Bin G, Jiang H, Chen X, Tang C. The possible role of hydrogen sulfide as a smooth muscle cell proliferation inhibitor in rat cultured cells. Heart Vessels. 2004;19:75–80. doi: 10.1007/s00380-003-0743-7. [DOI] [PubMed] [Google Scholar]
- Yang G, Sun X, Wang R. Hydrogen sulfide-induced apoptosis of human aorta smooth muscle cells via the activation of mitogen-activated protein kinases and caspase-3. Faseb J. 2004;18:1782–1784. doi: 10.1096/fj.04-2279fje. [DOI] [PubMed] [Google Scholar]
- Navar LG, Inscho EW, Majid SA, Imig JD, Harrison-Bernard LM, Mitchell KD. Paracrine regulation of the renal microcirculation. Physiol Rev. 1996;76:425–536. doi: 10.1152/physrev.1996.76.2.425. [DOI] [PubMed] [Google Scholar]
- Peeler TC, Baker KM, Esmurdoc CF, Chernin MI. Angiotensin converting enzyme inhibition in Dahl salt-sensitive rats. Mol Cell Biochem. 1991;104:45–50. doi: 10.1007/BF00229802. [DOI] [PubMed] [Google Scholar]