

Abstract
Promising findings from genetic association studies are commonly presented with two distinct figures: one gives the association study results and the other indicates linkage disequilibrium (LD) between genetic markers in the region(s) of interest. Fully interpreting the results of such studies requires synthesizing the information in these figures, which is generally done in a subjective and unsystematic manner. Here we present a method to formally combine association results and LD and display them in the same figure; we have developed a freely available web-based application that can be used to generate figures to display the combined data. To demonstrate this approach we apply it to fine mapping data from the prostate cancer 8q24 loci. Combining these two sources of information in a single figure allows one to more clearly assess patterns of association, facilitating the interpretation of genome-wide and fine mapping data and improving our ability to localize causal variants.
Introduction
Genome-wide association studies have recently suc- ceeded in identifying multiple genetic variants that underlie a number of human diseases. A typical genetic locus identified in these studies contains numerous variants which are significantly associated with the disease of interest. It is often difficult to determine which of these variants provides the strongest evidence of association because of correlation between variants due to linkage disequilibrium (LD). To address this problem, authors have reported both association results and LD maps using two adjoining figures; in general, −log10 P-values are displayed for the association between disease and each single nucleotide polymorphism (SNP) in the region, and below that a map of pairwise LD between SNPs in the same region [Amos et al., 2008; McPherson et al., 2007; Scott et al., 2007; Weedon et al., 2007; Winkelmann et al., 2007; Yeager et al., 2007]. We show an example of this type of figure using fine mapping data of the prostate cancer 8q24 region from a study by Haiman et al. [2007] in Figure 1. Figure 1a depicts the association P-values for SNPs in the region, while Figure 1b shows the LD structure.
Fig. 1.
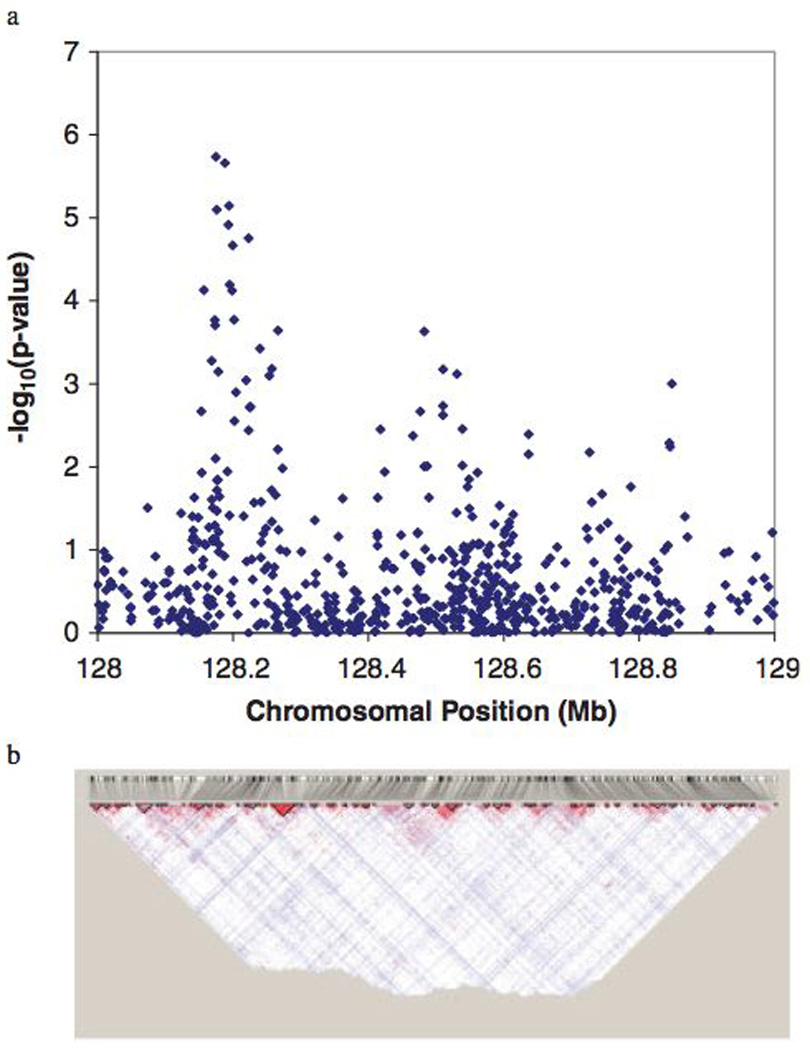
Association results and corresponding linkage disequili- brium map. (a) Results from the Haiman et al. [2007] study of prostate cancer on chromosome 8q24 in African-Americans. (b) A Haploview plot of pairwise linkage disequilibrium between SNPs in the region of interest from the HapMap YRI popula- tion. SNP, single nucleotide polymorphism.
Two problems arise with this type of display. First, because association is a single measure while LD is a pairwise measure, it is difficult to line up the results of each figure. Second, it is not clear how the two measures are related. For example, a marginally significant SNP marker may not have a significant association signal once LD with other associated SNPs is taken into account. Both of these problems can be addressed by combining the association study test results with the LD information and displaying them in the same figure. Below we describe a method and a freely available web-based software tool that can be used to combine association and LD data in the same figure.
Methods
Assume one is interested in the association between two neighboring SNPs (SNP1 and SNP2) and a particular phenotype. The standard association approach would simply estimate the marginal association between the genotypes at each SNP and the phenotype (e.g., a w2-test statistic and corresponding P-value). One can also measure the pairwise LD between SNP1 and SNP2 using r2 [Devlin and Risch, 1995]. It is possible then to calculate the expected w2 for SNP1 conditional on the observed w2 for the SNP2 and the r2 between the two markers:
For SNP2 conditional on SNP1, this is given by
(Formal details of this relationship are given in the Appendix.)
For SNP1 and SNP2, there are a total of four conditional values, one for SNP1 conditional on SNP2, one for SNP2 conditional on SNP1, one for SNP1 conditional on itself, and one for SNP2 conditional on itself. The latter two values are simply the observed association signals for SNP1 and SNP2, because r2 is 1 for any SNP and itself. One can display the four corresponding −log10 P-values in a two-dimensional heat map. This method can be expanded to display a large number of SNPs in a genomic region. The resulting figure provides information about the strength of association signals in the region (on the diagonal) and correlation of association signals due to LD (off-diagonal elements).
Application
We illustrate the strength of this approach with an example plot that utilizes the data from the fine mapping study of Haiman et al. [2007] of the prostate cancer 8q24 region in an African-American sample, along with information on LD in the YRI population from the HapMap (Fig. 2). The location of SNPs in the sample data is represented from most proximal to most distal from left to right on the x-axis and from top to bottom on the y-axis. In this example, there are several strong association signals or “hotspots” that can be readily identified by the intensity of warmer colors on the diagonal of the matrix (Fig. 2a). The SNPs with the strongest association signals are labeled to the right of the figure, and the SNP with the strongest overall signal is highlighted in red.
Fig. 2.
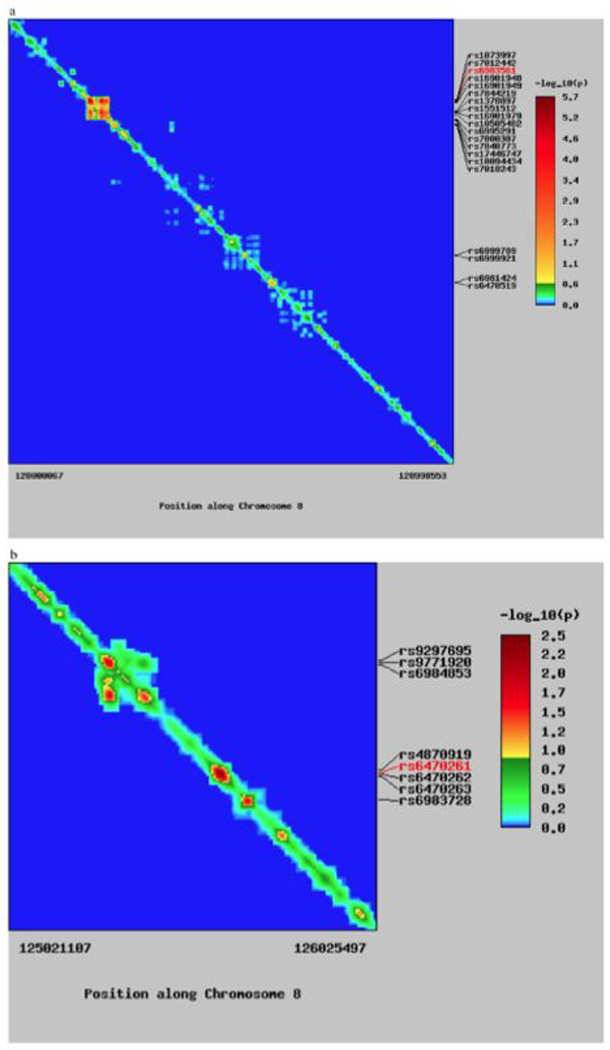
Heat map for association and LD on chromosome 8q24. (a) Heat map for the 8q24 region. Chromosomal position is labeled on the bottom. SNPs with strong association signals are identified to the right of the figure, with the strongest signal labeled in red. Both the rows and columns represent individual SNPs. Colors in the matrix represent the strength of the association signal for the SNP in that row. On the diagonal, the association signal is simply the observed value for that particular SNP. Off-diagonal elements represent the expected association signal for the SNP in that row due to its correlation with the SNP in the corresponding column. (b) View of additional 8q24 loci illustrating an asymmetric association pattern. SNP, single nucleotide polymorphism.
This method provides a way to display association signals and LD together, and it also allows for the visual identification of association signals that can be explained entirely due to their correlation with other associated loci. A second locus provides an example of a signal at one location that may be driven by its correlation with neighboring SNPs (Fig. 2b). Focusing on the top left quadrant, a cluster of positive association signals can be identified by visual inspection of the heat map; two local peaks of association are indicated by hotspots on the diagonal. In addition, warm colors appearing off the diagonal indicate that the SNP in that row is expected to have a positive association signal due to its correlation with SNPs in the corresponding columns.
For the first association peak, the off-diagonal elements in the corresponding rows (to its right in the figure) reach a tepid green in the columns that correspond to the second association peak. This indicates that a modest association signal with those SNPs would be expected solely due to their correlation with SNPs in the second peak. For the second hotspot, the off-diagonal elements in those rows (here, to the left) reach a hotter orange, indicating that a strong association signal would be expected solely due to the correlation of those SNPs with SNPs in the first hotspot. Because the first association signal appears hotter than its expected conditional association signal and the second association signal does not appear hotter than its expected association signal, this suggests that the associa- tion signals seen here are due to SNPs in the first hotspot, and that the signal at the second hotspot is most likely due to correlation with SNPs in the first hotspot. The algorithm used for labeling top SNP signals utilizes this information to display the rs numbers of the top SNP signals (see the Appendix).
Discussion
Our method for displaying genome-wide association results and LD in the same figure has several advantages over other methods of display. First, it provides a clear picture of the relative strength of association signals in a specific region of the genome. Second, it allows for the visualization of the effect of LD between neighboring SNPs on their observed association signals. This can help localize the source of a particular association as well as identify multiple independent associations in a single region such as those that exist in the prostate cancer 8q24 region.
To implement this method, we have developed software that can effectively handle dense genotype data using a simple file input format, and we have made it available on our web site. Investigators can tailor their individual plots by adjusting a number of options to best display their data. In addition to utilizing LD information from the HapMap, one can also use LD information from the study itself. This can provide potentially more accurate estimates of LD, especially for populations that are not well represented by the HapMap populations. Finally, users can also upload the results of association analyses that adjust for the effect of neighboring SNPs. Association results for individual SNPs can again be represented on the diagonal of the matrix, while adjusted results can be represented in the off-diagonal. These types of analyses can address concerns about potential bias in LD estimates in small samples [Terwilliger and Hiekkalinna, 2006; Thomas and Stram, 2006]. For meta-analyses, such data are often unavailable, and the method described in this paper can be applied.
As the volume of genomic data is rapidly increasing, tools that can help researchers visualize, understand, and interpret this large-scale association data are needed. Our method addresses this need by synthesizing information on association analyses and LD. Ultimately, this tool can help clarify the patterns of association observed, facilitate the interpretation of genomic data, and improve our ability to localize causal variants.
ACKNOWLEDGMENTS
We thank Drs. Gary Chen, Iona Cheng, Vincent Fradet, Sung Kim, Audrey Schnell, and Yu Chuan Tai for their helpful comments on the web application.
Contract grant sponsor: NIH; Contract grant numbers: RR024130, GM061390, CA088164, and CA127298.
APPENDIX
We describe a method to combine information on association and LD and display them together in the same plot. The goal of displaying information in this way is to determine which SNPs have the strongest evidence for association and which association signals exceed the signal expected due to the association of surrounding markers. To do this, we can use the test of association for each marker and a pairwise measure of LD between markers.
For a case-control study with a sample of size N, we can measure the association between the locus, with alleles A and a, and disease using a Χ2-test:
where π̂DA is the frequency of allele A among cases, π̂CA is the frequency of allele A among controls, N is the total sample size, ϕ is the proportion of the same, that is, cases, and π̂A is the frequency of allele A in the total sample. Similarly, a test between a second locus, with alleles B and b, and disease is
The distribution of the w2 statistic is approximately the square of that of a normal random variable, Z. The expected value (mean) of Z for locus 1 is
and for locus 2:
Where
And
If qAB is the probability that a chromo- some carrying the A allele at the first locus carries the B allele at the second locus and similarly qaB is the probability that a chromosome carrying the a allele at the first locus carries the B allele at the second locus, then
and therefore
is equivalent to
As noted by Pritchard and Przeworski [2001], since the pairwise LD measure r2 between loci 1 and 2 is
this is equivalent to
Therefore, the expected value of Z for locus 2 due to association at locus 1 is
or
Because the top association signals in our example are clear from scanning the figure, and can be easily gleaned by examining the association results themselves, we label a subset of SNPs on the y-axis of the figure when they meet two criteria: first, being in the top strata of association signals of n SNPs in the region of interest, where the default value is
We also provide a user option to specify a threshold. Of the SNPs that pass the first criteria, we label those meeting or exceeding the expected association signal due to any neighboring SNP as
Finally, we note that our example association test compares differences in allele frequencies across groups, as is commonly reported in the literature, and not genotype frequencies. Allelic association tests are con- founded with deviations from Hardy-Weinberg equili- brium [Sasieni, 1997], and several other tests have been shown to be more powerful than allelic association tests [Matthews et al., 2008; Zhang et al., 2008].
Footnotes
WEB RESOURCES
VALID Visualization Tool: http://www.humgen.medschool.ucsf.edu/Research/Software.aspx.
HapMap: http://www.hapmap.org.
Haploview: http://www.broad.mit.edu/mpg/haploview.
REFERENCES
- Amos CI, Wu X, Broderick P, Gorlov IP, Gu J, Eisen T, Dong Q, Zhang Q, Gu X, Vijayakrishnan J, Sullivan K, Matakidou A, Wang Y, Mills G, Doheny K, Tsai YY, Chen WV, Shete S, Spitz MR, Houlston RS. Genome-wide association scan of tag SNPs identifies a susceptibility locus for lung cancer at 15q25.1. Nat Genet. 2008;40:616–622. doi: 10.1038/ng.109. [DOI] [PMC free article] [PubMed] [Google Scholar]
- Devlin B, Risch N. A comparison of linkage disequilibrium measures for fine-scale mapping. Genomics. 1995;29:311–322. doi: 10.1006/geno.1995.9003. [DOI] [PubMed] [Google Scholar]
- Haiman CA, Patterson N, Freedman ML, Myers SR, Pike MC, Waliszewska A, Neubauer J, Tandon A, Schirmer C, McDonald GJ, Greenway SC, Stram DO, Le Marchand L, Kolonel LN, Frasco M, Wong D, Pooler LC, Ardlie K, Oakley-Girvan I, Whittemore AS, Cooney KA, John EM, Ingles SA, Altshuler D, Henderson BE, Reich D. Multiple regions within 8q24 independently affect risk for prostate cancer. Nat Genet. 2007;39:638–644. doi: 10.1038/ng2015. [DOI] [PMC free article] [PubMed] [Google Scholar]
- Matthews AG, Haynes C, Liu C, Ott J. Collapsing SNP genotypes in case-control genome-wide association studies increases the type I error rate and power. Stat Appl Genet Mol Biol. 2008;7 doi: 10.2202/1544-6115.1325. Article23. [DOI] [PMC free article] [PubMed] [Google Scholar]
- McPherson R, Pertsemlidis A, Kavaslar N, Stewart A, Roberts R, Cox DR, Hinds DA, Pennacchio LA, Tybjaerg-Hansen A, Folsom AR, Boerwinkle E, Hobbs HH, Cohen JC. A common allele on chromosome 9 associated with coronary heart disease. Science. 2007;316:1488–1491. doi: 10.1126/science.1142447. [DOI] [PMC free article] [PubMed] [Google Scholar]
- Pritchard JK, Przeworski M. Linkage disequilibrium in humans: models and data. Am J Hum Genet. 2001;69:1–14. doi: 10.1086/321275. [DOI] [PMC free article] [PubMed] [Google Scholar]
- Sasieni PD. From genotypes to genes: doubling the sample size. Biometrics. 1997;53:1253–1261. [PubMed] [Google Scholar]
- Scott LJ, Mohlke KL, Bonnycastle LL, Willer CJ, Li Y, Duren WL, Erdos MR, Stringham HM, Chines PS, Jackson AU, Prokunina- Olsson L, Ding CJ, Swift AJ, Narisu N, Hu T, Pruim R, Xiao R, Li XY, Conneely KN, Riebow NL, Sprau AG, Tong M, White PP, Hetrick KN, Barnhart MW, Bark CW, Goldstein JL, Watkins L, Xiang F, Saramies J, Buchanan TA, Watanabe RM, Valle TT, Kinnunen L, Abecasis GR, Pugh EW, Doheny KF, Bergman RN, Tuomilehto J, Collins FS, Boehnke M. A genome-wide association study of type 2 diabetes in Finns detects multiple susceptibility variants. Science. 2007;316:1341–1345. doi: 10.1126/science.1142382. [DOI] [PMC free article] [PubMed] [Google Scholar]
- Terwilliger JD, Hiekkalinna T. An utter refutation of the “Fundamental Theorem of the HapMap.”. Eur J Hum Genet. 2006;14:426–437. doi: 10.1038/sj.ejhg.5201583. [DOI] [PubMed] [Google Scholar]
- Thomas DC, Stram DO. An utter refutation of the “Fundamental Theorem of the HapMap” by Terwilliger and Hiekkalinna. Eur J Hum Genet. 2006;14:1238–1239. doi: 10.1038/sj.ejhg.5201697. [DOI] [PubMed] [Google Scholar]
- Weedon MN, Lettre G, Freathy RM, Lindgren CM, Voight BF, Perry JR, Elliott KS, Hackett R, Guiducci C, Shields B, et al. A common variant of HMGA2 is associated with adult and childhood height in the general population. Nat Genet. 2007;39:1245–1250. doi: 10.1038/ng2121. [DOI] [PMC free article] [PubMed] [Google Scholar]
- Winkelmann J, Schormair B, Lichtner P, Ripke S, Xiong L, Jalilzadeh S, Fulda S, Putz B, Eckstein G, Hauk S, Trenkwalder C, Zimprich A, Stiasny-Kolster K, Oertel W, Bachmann CG, Paulus W, Peglau I, Eisensehr I, Montplaisir J, Turecki G, Rouleau G, Gieger C, Illig T, Wichmann HE, Holsboer F, Muller-Myhsok B, Meitinger T. Genome-wide association study of restless legs syndrome identi- fies common variants in three genomic regions. Nat Genet. 2007;39:1000–1006. doi: 10.1038/ng2099. [DOI] [PubMed] [Google Scholar]
- Yeager M, Orr N, Hayes RB, Jacobs KB, Kraft P, Wacholder S, Minichiello MJ, Fearnhead P, Yu K, Chatterjee N, Wang Z, Welch R, Staats BJ, Calle EE, Feigelson HS, Thun MJ, Rodriguez C, Albanes D, Virtamo J, Weinstein S, Schumacher FR, Giovannucci E, Willett WC, Cancel-Tassin G, Cussenot O, Valeri A, Andriole GL, Gelmann EP, Tucker M, Gerhard DS, Fraumeni JF, Jr, Hoover R, Hunter DJ, Chanock SJ, Thomas G. Genome-wide association study of prostate cancer identifies a second risk locus at 8q24. Nat Genet. 2007;39:645–649. doi: 10.1038/ng2022. [DOI] [PubMed] [Google Scholar]
- Zhang Q, Wang S, Ott J. Combining identity by descent and association in genetic case-control studies. BMC Genet. 2008;9:42. doi: 10.1186/1471-2156-9-42. [DOI] [PMC free article] [PubMed] [Google Scholar]