

Abstract
Among the criteria to evaluate the performance of a phylogenetic method, robustness to model violation is of particular practical importance as complete a priori knowledge of evolutionary processes is typically unavailable. For studies of robustness in phylogenetic inference, a utility to add well-defined model violations to the simulated data would be helpful. We therefore introduce ImOSM, a tool to imbed intermittent evolution as model violation into an alignment. Intermittent evolution refers to extra substitutions occurring randomly on branches of a tree, thus changing alignment site patterns. This means that the extra substitutions are placed on the tree after the typical process of sequence evolution is completed. We then study the robustness of widely used phylogenetic methods: maximum likelihood (ML), maximum parsimony (MP), and a distance-based method (BIONJ) to various scenarios of model violation. Violation of rates across sites (RaS) heterogeneity and simultaneous violation of RaS and the transition/transversion ratio on two nonadjacent external branches hinder all the methods recovery of the true topology for a four-taxon tree. For an eight-taxon balanced tree, the violations cause each of the three methods to infer a different topology. Both ML and MP fail, whereas BIONJ, which calculates the distances based on the ML estimated parameters, reconstructs the true tree. Finally, we report that a test of model homogeneity and goodness of fit tests have enough power to detect such model violations. The outcome of the tests can help to actually gain confidence in the inferred trees. Therefore, we recommend using these tests in practical phylogenetic analyses.
Keywords: sequence evolution, model violation, heterotachy, maximum likelihood, maximum parsimony, neighbor joining
Introduction
Phylogenetic reconstruction comprises three approaches: maximum parsimony (MP), distance-based methods (e.g., neighbor joining [NJ] and BIONJ), and statistical approaches including maximum likelihood (ML) and Bayesian inference (felsenstein2004 and references therein). MP uses an implicit model of sequence evolution, whereas the latter two assume an explicit evolutionary model. Available software packages such as PHYLIP (Felsenstein 1993), PAUP* (Swofford 2002), PhyML (Guindon and Gascuel 2003), IQPNNI (Vinh and von Haeseler 2004, Minh et al. 2005), MEGA4 (Kumar et al. 2008), RAxML (Stamatakis et al. 2008), and MrBayes (Huelsenbeck and Ronquist 2001) allow phylogenetic reconstruction under increasingly complex evolutionary models. This enables more and more studies to gain insights into the performance of different tree-building methods under various scenarios (e.g. Felsenstein 1978, huelsenbeck1993, huelsenbeck1995, 1995b; [pp. 185–204 and references therein], pp. 185–204 and references therein). For analyses of real data, such studies may then help to have a better understanding of possible pitfalls of the inferred phylogenies, as some observations might be due to reconstruction artifacts such as long-branch attraction (see., e.g., Anderson and Swofford 2004, Brinkmann et al. 2005)
Performance of phylogenetic reconstruction methods can be evaluated under several criteria such as consistency (the ability to estimate the correct tree with sufficient data), efficiency (the ability to quickly converge on the correct phylogeny), and robustness (the ability to infer the correct tree in the presence of model violation, see, e.g., Yang 2006, p. 186–190). Among these, robustness to incorrect assumptions about the underlying evolutionary model is of particular practical importance as complete and accurate a priori knowledge of evolutionary processes is typically unavailable. Previous studies of robustness (e.g., Yang 1997, bruno1999, sullivan2001, lemmon2004) used an evolutionary model and a tree to generate alignments and then assessed the accuracy of phylogenetic methods using different models of sequence evolution. Accuracy is measured by the proportion of generated alignments yielding the true tree.
Using one evolutionary model for the whole tree and for all sites to generate data is evidently a simplification (see, e.g., Lopez et al. 2002). Such a model is certainly not adequate to describe the complicated evolutionary process. Thus, more sophisticated studies of robustness have employed several techniques to model the evolutionary process more realistically, such as adding different guanine and cytosine (GC) content to different parts of the simulated data (Kolaczkowski and Thornton 2009), changing the proportions of variable sites across the tree (Shavit Grievink et al. 2010) and using different sets of branch lengths to simulate partitioned data (Kolaczkowski and Thornton 2004, kolaczkowski2009, spencer2005).
Currently available sequence simulation programs incorporate increasingly complex evolutionary scenarios to account for insertion and deletion events (e.g., Fletcher and Yang 2009), lineage-specific models (Shavit Grievink et al. 2008) or site-specific interactions (Gesell and von Haeseler 2006). Nonetheless, studies of robustness in phylogenetic inference need an additional utility: a systematic means to introduce model violation to the simulated alignments. We therefore introduce ImOSM, a flexible tool to “pepper” a model tree with well-defined deviations from the original model.
ImOSM simulates “intermittent evolution,” where intermittent evolution refers to extra substitution(s) that are thrown on arbitrary branch(es) of the tree to convert a site pattern of the alignment into another site pattern. Extra substitutions are modeled by the one-step mutation (OSM) matrix (Klaere et al. 2008). Thus, ImOSM actually “imbeds one-step mutations” into the alignment. ImOSM provides a variety of settings, which allow for different model violation scenarios such as violating the substitution rates or rates across sites (RaS) along certain branches of the tree.
Using ImOSM to violate the underlying model, we report that the reconstruction accuracy of ML, MP, and BIONJ all suffer severely from RaS heterogeneity violation and a simultaneous violation of RaS and the transition/transversion (Ts/Tv) ratio along two nonadjacent external branches of a four-taxon tree. For an eight-taxon balanced tree, such violations cause each of the three methods to produce a different topology, and BIONJ constantly infers the true tree if the sequence length is large (≥105). Subsequently, we examine possible topological biases and perform several tests regarding the model and the inferred tree. Based on this, recommendations for phylogenetic analyses of real data are drawn.
Materials and Methods
ImOSM Method
Assume that we have a phylogenetic tree 𝒯 and an alignment 𝒜 that evolved along 𝒯 under a model of sequence evolution ℳ. ImOSM introduces extra substitutions that occur somewhere on 𝒯, thus changing the alignment 𝒜, which otherwise perfectly fits the substitution process defined by ℳ. To this end, we utilize the concept of an OSM matrix (Klaere et al. 2008) applied to the Kimura three parameter (K3ST) model (Kimura 1981). The K3ST model distinguishes three classes of substitutions: 1) transitions (s1) within purines (A,G) and pyrimidines (C,T), 2) transversions (s2) within the nucleotide pairs (A,C) and (G,T), and 3) transversions (s3) within the nucleotide pairs (A,T) and (G,C). Figure 1 illustrates the connection between the K3ST model and the OSM matrix. For the left branch of the two taxon tree (fig. 1a), a transition s1 of the K3ST model (fig. 1b) produces a unique 16×16-dimensional (permutation) matrix σ11 (fig. 1c). Each row and each column of the matrix has exactly one nonzero entry, which describes how a transition changes a pattern (row) into a new pattern (column).
Fig 1.

(a) A rooted tree with leaves 1 and 2. (b) The K3ST model (Kimura 1981). A transition s1 on the left branch of the tree changes a pattern into exactly one new pattern (black square) in the (permutation) matrix (c). The matrix has 16 rows and 16 columns representing the possible site patterns for the alignment of two nucleotide sequences.
Klaere et al. (2008) showed how to efficiently construct the (permutation) matrices for every branch in a tree. The construction of the OSM matrix M𝒯 for the tree 𝒯 is completed by taking into account the relative contribution of each branch in the tree and the probabilities for the three substitution classes for each branch. Thus, we obtain:
where σei is the matrix generated by substitution class si∈{s1,s2,s3} for branch e, αe1,αe2,αe3 are the probabilities of the three substitution classes for branch e(αe1 + αe2 + αe3 = 1), E the set of all branches of 𝒯, and pe the ratio between the branch length of branch e and the sum of all branch lengths (pe ≥ 0 and ∑e∈Epe = 1). M𝒯 is the weighted exchangeability matrix for all patterns given that an extra substitution occurs somewhere on the tree 𝒯.
We now explain the different options ImOSM offers. Given a rooted tree and an alignment, one can, on the one hand, explicitly introduce an extra substitution to change a given alignment site by specifying a substitution class and a branch. For example, an extra substitution s2 occurring on the external branch leading to taxon 1 of the rooted four-taxon tree (fig. 2a) changes the site pattern AACA at the first position (column) of the alignment (fig. 2b) into the pattern CACA. Another extra substitution s3 on the internal branch leading to taxa 3 and 4 changes the site pattern GGAC at the second position into the pattern GGTG. Figure 2c depicts the resulting (disturbed) alignment. This explicit specification is worthwhile if one wants to study the effect of a (small) number of extra substitutions.
Fig 2.

An example of an explicit setting in ImOSM. An extra substitution s2 occurring on the external branch leading to taxon 1 of the rooted four-taxon tree (a) changes the site pattern AACA at the first position of the alignment (b) into the pattern CACA. An extra substitution s3 on the internal branch leading to taxa 3 and 4 changes the site pattern GGAC at the second position into the pattern GGTG. The disturbed alignment is depicted in (c).
On the other hand, one may want to introduce the extra substitutions systematically and in a more convenient way. ImOSM provides a variety of settings to accomplish this. First, for each branch, different substitution classes may have different probabilities as described above. By providing equal probabilities for all the three substitution classes or for the two transversion classes, the more specialized models JC69 (Jukes and Cantor 1969) or K2P (Kimura 1980) are derived, respectively. Second, one can assign the number of extra substitutions per site to each branch by providing the branch lengths for the input tree. A branch is free from intermittent evolution by setting its length to zero. Last, the extra substitutions can be distributed to alignment sites according to a user-defined distribution.
Accordingly, ImOSM introduces various model violation scenarios to the data: 1) Putting extra substitutions on a specific subset of branches violates the assumption of model homogeneity along the tree, 2) the probabilities of the three substitution classes of the K3ST model violate the underlying substitution rates along these branches, and 3) distributing extra substitutions to alignment sites under a different rate distribution violates the underlying RaS distribution. This implies heterotachy as the rate at a site shifts along branch(es) (Philippe and Lopez 2001).
Simulations
We study the robustness of three phylogenetic reconstruction methods ML, MP, and BIONJ against model violation yielded by ImOSM. Intermittent evolution is introduced to two nonsister external branches of a four-taxon tree and an eight-taxon balanced tree. The four-taxon tree allows for a unique choice of two nonadjacent external branches (ignoring the leaf labels); the eight-taxon tree allows for two possibilities (fig. 3). We call the trees C4, C8, and C8f, respectively. The internal branch lengths are set to 0.05 substitutions per site; whereas the external branch lengths (br) vary in {0.05,0.10,0.20,0.30,0.40,0.50,0.75,1.00}.
Fig 3.

Trees used in simulation and the corresponding abbreviations. Extra substitutions are introduced to the indicated external branches (refer to the text for further details).
Seq-Gen (Rambaut and Grassly 1997) generates 100 alignments of length ℓ∈{104,105} under the K2P + Γ model, assuming a Ts/Tv ratio of 2.5 and a Γ-shape parameter α of 0.5 to model RaS heterogeneity. ImOSM then “disturbs” each alignment by putting brie extra substitutions on the indicated external branches such that brie + 0.05 = br. Thus, the trees are “clock like” but two nonadjacent external branches evolve only partially according to the original K2P + Γ model.
Table 1 summarizes the different simulation settings. First, intermittent evolution retains Ts/Tv = 2.5 and the extra substitutions follow the site-specific rates as determined by Seq-Gen. Hence, the simulation does not introduce any model violation. We refer to this simulation setting as vNONE. Second, extra substitutions are selected uniformly from the substitution classes (JC69 model) but site-specific rates are not changed. Thus, ImOSM “violates” the Ts/Tv ratio on the indicated branches. We abbreviate this setting as vTsTv. Third, intermittent evolution retains Ts/Tv = 2.5 but now the extra substitutions are uniformly distributed. Therefore, ImOSM violates the RaS heterogeneity assumption on the indicated branches. This setting is referred to as vRaSV. Lastly, extra substitutions are selected uniformly from the substitution classes and distributed uniformly to alignment sites. Thus, both Ts/Tv and RaS heterogeneity are violated on the indicated branches. This setting is abbreviated as vBOTH.
Table 1.
Different Settings Illustrate Different Extent of Model Violation Introduced by ImOSM.
| Abbreviation | Model | ImOSM Setting | Extents of Violation |
| vNONE | K2P + Γa | Ts/Tv = 2.5 and RaS | No violation |
| vTsTv | K2P + Γ | Ts/Tv = 1.0 and RaS | Ts/Tv violation |
| vRaSV | K2P + Γ | Ts/Tv = 2.5 and no RaS | RaS violation |
| vBOTH | K2P + Γ | Ts/Tv = 1.0 and no RaS | Violating both Ts/Tv |
| and RaS |
The underlying model is K2P + Γ with a Ts/TV ratio of 2.5 and a Γ-shape parameter α of 0.5 to model RaS heterogeneity.
The disturbed alignments are subject to tree reconstruction. We use IQPNNI (Vinh and von Haeseler 2004, minh2005a) and PAUP* (Swofford 2002) to estimate the ML and MP trees, respectively. For the ML inference, we use K2P + Γ and estimate the model parameters. NJ trees are computed with BIONJ (Gascuel 1997) using the ML distances based on the inferred model parameters from the ML tree estimation. This means that the ML and BIONJ inferences are conducted under a misspecified model for the vTsTv, vRaSV, and vBOTH settings. In addition, we perform Model-Test (Posada and Crandall 1998), test of model homogeneity across branches (Weiss and von Haeseler 2003) and goodness of fit tests (Goldman 1993, nguyen2011).
Results
Tree Reconstruction Accuracy
Figure 4 presents the tree reconstruction accuracy for all simulation settings. The accuracy, that is, the proportion of alignments that yield the true tree, is shown on the y axis. The x axis displays the external branch length br or (brie + 0.05). The first two columns show the results for the four-taxon tree C4 with the sequence length of 104 and 105, respectively. The last two columns show the results for the eight-taxon tree C8. Results for C8f are similar to those for C8 and can be found in the supplementary figure S1, Supplementary Material online.
Fig 4.

Tree reconstruction accuracy, that is, the proportion of alignments that yield the true tree, is shown on the y axis for simulations with no model violation (vNONE, first row), with Ts/Tv violation (vTsTv, second row), with RaS violation (vRaSV, third row), and with both Ts/Tv and RaS violation (vBOTH, last row). The first two columns show the results for the four-taxon tree C4 with alignment length 104 and 105, respectively. The last two columns show the results for the eight-taxon tree C8. The x axis displays the external branch length br or (brie+0.05). Accuracy of ML is depicted by +, MP by о, and BIONJ by ×.
It should be noted that 100 replicates are sufficient for each (ℓ,br) combination in agreement with Shavit Grievink et al. (2010), who also generated alignments of length 104. A further increase in the number of replicates does not change the results substantially (data not shown).
No Model Violation and Ts/Tv Violation
The first two rows of figure 4 show the accuracy for simulations with no model violation (vNONE) and with the violation of the transition/transversion ratio (vTsTv), respectively. For sequence length ℓ = 104, the accuracy of all three tree-building methods decreases as br increases for both scenarios (vNONE, vTsTv). ML performs best, whereas MP performs worst on the eight-taxon tree (C8). Nonetheless, as the sequence length increases to 105, all the methods successfully recover the true topology. Thus, the violation of the Ts/Tv ratio has almost no impact on the reconstruction accuracy; the accuracy is governed by the sequence length. This observation corroborates previous results (Fukami-Kobayashi and Tateno 1991, huelsenbeck1995).
RaS Violation
The third row of figure 4 displays the accuracy for simulations with the rates across sites heterogeneity violation (vRaSV). For the four-taxon tree C4 (the first two columns), the reconstruction accuracy, independent of the methods and independent of the alignment length, dramatically drops to 0 as br exceeds 0.4. Thus, the violation of RaS heterogeneity causes dramatic changes in the tree reconstruction accuracy.
Surprisingly, for the eight-taxon tree C8 (fig. 4, third row, last two columns), BIONJ constantly performs best and recovers the true tree once the sequence length is large. ML performs slightly better than MP. However, they both suffer from the RaS heterogeneity violation: Their accuracy drops to 0 if br exceeds 0.4.
It should be noted that we have checked and recorded no possible bias of BIONJ due to the input order of the sequences in the distance matrix. All runs with the “randomized input order” option in the NEIGHBOR program (the PHYLIP package, Felsenstein 1993) produced the same tree as the BIONJ tree. Moreover, the results do not change when PhyML (Guindon and Gascuel 2003) and DNAPARS (the PHYLIP package, Felsenstein 1993) are used to reconstruct the ML and MP trees, respectively.
Both RaS and Ts/Tv Violation
The last row of figure 4 shows the accuracy for simulations with the violation of both RaS heterogeneity and the Ts/Tv ratio (vBOTH). Similar to the vRaSV setting, this simultaneous violation yields not only a dramatic change in the accuracy but also distinct patterns for the C4 and C8 trees. For C4, the accuracy of all methods decreases independently of the sequence length as br increases. Interestingly, we observe a slow recovery of the accuracy for ML and BIONJ when br approaches 1.0; nonetheless, their accuracy never exceeds , even when we extend br to 2.0 (supplementary fig. S2, Supplementary Material online). The reason for the increase in the accuracy of ML and BIONJ as the external branch length exceeds 0.75 remains unclear. We note that Ho and Jermiin (2004) observed a similar behavior concerning ML.
For C8, the accuracy of ML and MP suffers severely from the violation vBOTH, whereas BIONJ's accuracy is not affected for large sequence lengths.
Parameter Estimation
The observed behavior of ML and BIONJ provokes a further investigation of the ML-estimated model parameters. Without any kind of model violation, vNONE, the ML estimations of both parameters, the Ts/Tv ratio and the Γ-shape α are very close to the corresponding true values (supplementary fig. S3, Supplementary Material online). This confirms the statistical consistency of ML inference for the model parameters if the sequence length is large enough.
The transition/transversion ratio violation, vTsTv, has no influence on the estimation of α: the Inferred α is very close to the true value 0.5 (fig. 5, first row). However, the inferred Ts/Tv ratio substantially decreases from approximately 2.50 to 1.67 (C4) and to 2.07 (C8) as brie increases (fig. 5, second row). We note that the estimated Ts/Tv ratio roughly agrees with the branch length-weighted average of the two Ts/Tv ratios that were used in the simulations.
Fig 5.

ML parameter estimation in the presence of the transition/transversion ratio violation (vTsTv). The first and the last rows show the estimation of the Γ-shape parameter α and the Ts/Tv ratio, respectively. Results for the four-taxon tree C4 are presented on the left and for the C8 tree on the right. The x axis displays the external branch length br or (brie + 0.05).
Notably, the rates across sites heterogeneity violation, vRaSV, influences not only the estimation of α but also the Ts/Tv inference (fig. 6, first and last row, respectively). The estimated α for the C4 and C8 trees are both larger than 0.5 reflecting lower RaS heterogeneity induced by ImOSM. A substantially larger α is inferred for C4 than for C8. For the C4 tree, the inferred α grows almost linearly with increasing external branch lengths, whereas the estimated α for C8 increases to a maximum of 1.11 and subsequently decreases. Similarly, the inferred Ts/Tv deviates from 2.5 more dramatically for C4 than for C8. Note that the proportion of extra substitutions with respect to the total tree length (sum of all branch length plus extra substitutions) is larger on the four-taxon tree () than on the eight-taxon tree (). This leads to the above differences and results in the distinct patterns of behavior (in terms of reconstruction accuracy) of BIONJ between the C4 and C8 trees.
Fig 6.

ML parameter estimation in the presence of rates across sites violation (vRaSV). The first and the last rows show the estimation of the Γ-shape parameter α and the Ts/Tv ratio, respectively. Results for the four-taxon tree C4 are presented on the left and for the C8 tree on the right. The x axis displays the external branch length br or (brie + 0.05).
Finally, the estimation of α and Ts/Tv under the violation of both RaS and Ts/Tv (vBOTH) shows similar patterns to those under vRaSV (supplementary fig. S4, Supplementary Material online). The parameters estimated for the C8f tree are similar to those for C8 as summarized in the supplementary figure S5, Supplementary Material online.
Possible Topological Bias under vRaSV Setting
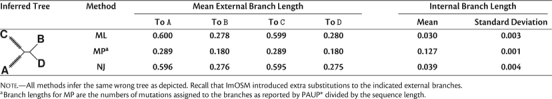
We further check for possible topological biases, that is, consistently inferring a “wrong” topology, under the vRaSV setting. For the four-taxon tree C4, as the sequence length increases to 105 and br exceeds 0.4, all three methods always infer the wrong topology (A,C,(B,D)), which groups taxa that evolve similarly, that is, (A,C) and (B,D). We noted that a unique MP tree is reconstructed for each of the alignments. Remarkably, although evolution was clock like, all methods infer substantially larger branch lengths for the external branches leading to A and to C than for the other external branch lengths. Moreover, the estimated internal branch length is significantly larger than zero (the average internal branch length inferred by each of the three methods is larger than 0.03, table 2). This means that we did not observe a polytomy concerning the inferred tree.
Table 2.
Trees and Branch Lengths Inferred by ML, MP, and BIONJ for the Four-Taxon Tree (C4) with External Branch Length br = 0.5 Under the vRaSV Setting for Sequence Length l ≥ 105
 |
For the eight-taxon trees BIONJ always infers, independently of the external branch lengths, one tree (the true tree) as ℓ grows to 105. In contrast, as br exceeds 0.4 neither ML nor MP converge to a single tree. Therefore, we increased ℓ up to 107. Table 3 shows the number of tree topologies reconstructed by ML and MP for the C8 and C8f trees with br = 0.5. As ℓ increases to 107, the ML inference converges to a single tree, whereas MP reconstructs more than one tree.
Table 3.
Number of Tree Topologies Inferred by ML (First Block) and MP (Second Block) for the C8 and C8f Trees with External Branch br = 0.5 Under the vRaSV Setting for Sequence Length l ∈ {105, 106, 107}
| Method | Tree | Sequence Length l | ||
| 105 | 106 | 107 | ||
| ML | C8 | 2 | 1 | 1 |
| C8f | 9 | 4 | 1 | |
| MP | C8 | 2 | 2 | 2 |
| C8f | 4 | 3 | 2 | |
Table 4 shows the tree topologies and their frequencies inferred by ML (first block) and MP (second block) for the C8 tree (left) and C8f (right) with ). For both the C8 and C8f trees, ML constantly recovers the innermost branch. On each side of the innermost branch, ML then groups taxa that evolve under the pure K2P + Γ model. For C8, the subtree ((E,F),(G,H)) is accurately reconstructed; however, taxa B and D are always incorrectly clustered in the other subtree. In addition, ML cannot resolve the positions of taxa A and C, thus yielding a multifurcating node in the tree. For C8f, the two cherries (C,D) and (G,H), each in one subtree of the innermost branch, are correctly inferred. However, in 67%, the cherry (C,D) is wrongly grouped with taxon B in one subtree and the cherry (G,H) is erroneously clustered with taxon F in the other subtree. The remaining 33 trees are multifurcating. Nonetheless, as ℓ grows to 107, the ML reconstruction converges to the first (the highlighted) tree. Hence, ML fails to recover the true tree for both the C8 and C8f trees.
Table 4.
Tree Topologies Inferred by ML (First Block) and MP (Second Block) for the C8 (Left) and C8f (Right) Trees with External Branch br = 0.5 Under the vRaSV Setting for Sequence Length l ≥ 106
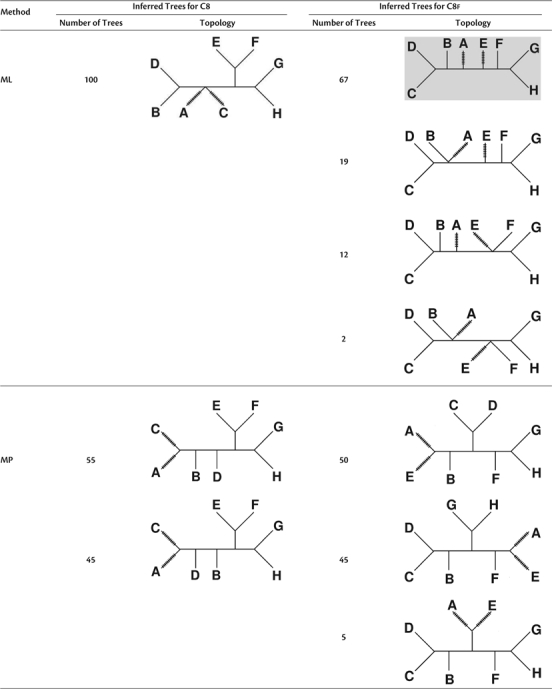 |
Note.—Recall that ImOSM introduced extra substitutions to the indicated external branches.
MP also fails to reconstruct the true tree for both the C8 and C8f trees but shows a different behavior from ML. For C8, MP infers two tree topologies for ℓ = 106 (table 4, second block, left column). In both topologies, the two taxa A and C, which are affected by intermittent evolution, erroneously form a cherry. For C8f, three topologies are reconstructed and they all group taxa A and E (table 4, second block, right column); therefore, MP cannot recover the internal branch separating {A,B,C,D} from {E,F,G,H}.
Thus, MP does not converge to a single tree (even if ℓ = 107) and always clusters taxa evolving with lower RaS heterogeneity (induced by ImOSM) regardless of their positions in the tree (refer to the C8 and C8f trees) and regardless of the tree size (four- and eight-taxon trees). In contrast, ML infers a single wrong tree and tends to group “relatively close” taxa (on the same side of the innermost branch of the eight-taxon trees) evolving with larger RaS heterogeneity, that is, taxa evolving under the pure K2P + Γ model. Finally, we note that the behavior of each of the methods under the vBOTH setting is similar to its behavior under the vRaSV setting.
Model Test and Goodness of Fit Evaluation under vRaSV Setting
We perform several tests to complete the ML analysis for ℓ = 105 under the vRaSV setting. The Bayesian information criterion, BIC, (Schwarz 1978) selects K2P + Γ for more than 99% of the alignments (Table S1 a). This means BIC does not identify local deviation from the original model. Markedly, the test proposed by Weiss and von Haeseler (2003) rejects the assumption of model homogeneity across branches (significance level α = 0.05) for almost all alignments (more than 99% on average) if brie > 0 (Table S1 b).
We further investigate the goodness of fit of the K2P + Γ model and the inferred ML tree to the data using the Cox test (Goldman 1993) and MISFITS (Nguyen et al. 2011). For each of the 100 disturbed alignments, we performed parametric bootstrap with 100 replicates. The Cox test rejects, independently of the tree size, the K2P + Γ model for all alignments if brie > 0 (Table S1 c). MISFITS rejects the K2P + Γ model and the inferred tree for a smaller proportion of alignments from the four-taxon tree (an average of 46% for brie > 0) than from the eight-taxon trees (90%, Table S1 d).
Discussion
We introduced ImOSM, a tool to imbed intermittent evolution into phylogenetic data in a systematic manner. The intermittent evolution processes allow for an arbitrary number of distinct sets of relative substitution rates between specific nucleotides (as reflected by the probabilities of the three substitution classes in the K3ST model) along different branches. Moreover, the distribution of RaS can be different across branches. Thereby, ImOSM provides a convenient means to simulate heterogeneous relative substitution rates across branches (e.g., the vTsTv setting) and heterotachy (e.g., the vRaSV setting). For studies of robustness in phylogenetic inference, ImOSM complements currently available sequence simulation programs by providing a flexible utility to incorporate various types of model violations into the simulated alignments. We note that several studies of postmortem sequence damage in ancient DNA also employed the concept of extra mutations (e.g., Ho et al. 2007, Mateiu and Rannala 2008, Rambaut et al. 2009). Additional mutations were introduced to external branches of the tree to mimic the presence of damaged nucleotides in extant sequences. The “disturbed” data were then used to study the estimation of the amount of nucleotide damage.
We investigated the robustness of ML and BIONJ under a misspecified model as well as MP to model violations introduced to four- and eight-taxon clock-like trees. We showed that the accuracy of all methods was unaffected by the violation of the Ts/Tv ratio on two nonadjacent external branches. The RaS heterogeneity violation hampered all methods recovery of the true topology for the four-taxon tree as the external branch length increased. For the eight-taxon balanced trees, the violation of RaS heterogeneity and the simultaneous violation of RaS and the Ts/Tv ratio on two nonsister external branches caused each of the three methods to infer a different topology. BIONJ using the ML-estimated distances always returned the correct tree; MP incorrectly grouped the two branches undergoing intermittent evolution (i.e., with lower RaS heterogeneity), whereas ML tended to cluster close taxa evolving with higher RaS heterogeneity. In addition, if the affected branches are close, that is, on the same side of the innermost branch in the C8 tree, ML inferred a multifurcating tree.
Previously, Kolaczkowski and Thornton (2004) reported that MP outperforms misspecified ML inference and is resistant to a specific setting of heterotachy, in which concatenated data are generated from the same four-taxon tree but with different branch length sets. Their result stimulated numerous discussions about the performance of MP and ML tree estimation in the presence of heterotachy. Contradictions to this result were demonstrated for many other combinations of branch lengths (see e.g., Gadagkar and Kumar 2005, gaucher2005, philippe2005, spencer2005, lockhart2006). More recently, Wu and Susko (2009) proposed a pairwise alpha heterotachy adjusted (PAHA) distance approach such that NJ with PAHA distances outperformed ML in several settings of heterotachy including the one from Kolaczkowski and Thornton (2004). Here, we reported cases in which all methods (ML, MP, and BIONJ) incorrectly grouped two nonadjacent branches affected by RaS violation for the four-taxon clock-like tree if the external branch length exceeds 0.4. Moreover, they all estimated larger branch lengths for these two branches. This implies that quartet-based analyses, where different methods reconstruct the same tree with long-branch attraction, should be interpreted with caution for real data.
The superiority of BIONJ over ML and MP for the eight-taxon trees is surprising. ML was reported in previous studies (e.g., Hasegawa et al. 1991, Huelsenbeck 1995b) to be more robust to model violation than distance methods such as NJ; nonetheless, the simulation settings (one evolutionary model) and model trees (four-taxon trees) used in these studies were different from our simulations. Unfortunately, as the three methods infer three different topologies (see also supplementary fig. S6, Supplementary Material online), the joint analysis of such alignments by different tree reconstruction methods does not provide any indication of which tree may be the correct one. Thus, a more detailed analysis of the data is advised. Model-Test (Posada and Crandall 1998), which selects a model from a collection of available models but makes no statement about the goodness of fit, did not help in these cases. BIC constantly selected K2P + Γ as the best model for the disturbed alignments. Fortunately, the test proposed by Weiss and von Haeseler (2003) rejected the assumption of a homogeneous substitution process along the tree. This indicates that the data show model violation. Subsequently, the Cox test (Goldman 1993) and MISFITS (Nguyen et al. 2011) demonstrated that the violation is so severe that the selected model and the inferred tree cannot explain the data adequately; hence, one should be careful in interpreting the tree. Therefore, we recommend using tests of model homogeneity when applicable and using tests of model fit in every practical phylogenetic analysis. If the tests reject the model, then any biological conclusion from the inferred trees should be handled with care.
Finally, we note that our simulations imply a kind of heterotachy. Thus, an interesting extension of this work would be to evaluate the accuracy of branch length mixture models that aim to account for heterotachy (Kolaczkowski and Thornton 2008, pagel2008). We also note that the aim of the paper was not an exhaustive simulation study for different model violations. We rather provide a tool to introduce model violations and show that already very simple violations of the model on two branches of the tree can lead to bewildering results, like the three different trees inferred by the three different phylogenetic reconstruction methods.
Supplementary Material
Supplementary figures S1–S6 are available at Molecular Biology and Evolution online (http://www.mbe.oxfordjournals.org/).
Program Availability
A C++ implementation for ImOSM is freely available at http://www.cibiv.at/software/imosm.
Supplementary Material
Acknowledgments
We would like to thank Bui Quang Minh for the kind support on using the IQPNNI program and helpful comments on the manuscript. We acknowledge Barbara Holland and two anonymous reviewers for their comments, which greatly improved the manuscript. We thank Mareike Fischer for carefully reading our manuscript. Financial support from the Wiener Wissenschafts-, Forschungs- and Technologiefonds is greatly appreciated. A.v.H. also acknowledges the funding from the DFG Deep Metazoan Phylogeny project, SPP (HA1628/9). T.G. and A.v.H. appreciate the support from the Genome Research in Austria project Bioinformatics Integration Network III.
References
- Anderson FE, Swofford DL. Should we be worried about long-branch attraction in real data sets? Investigations using metazoan 18S rDNA. Mol Phylogenet Evol. 2004;33:440–451. doi: 10.1016/j.ympev.2004.06.015. [DOI] [PubMed] [Google Scholar]
- Brinkmann H, van der Giezen M, Zhou Y, Poncelin de Raucourt G. An empirical assessment of long-branch attraction artefacts in deep eukaryotic phylogenomics. Syst Biol. 2005;54:743–757. doi: 10.1080/10635150500234609. [DOI] [PubMed] [Google Scholar]
- Bruno WJ, Halpern AL. Topological bias and inconsistency of maximum likelihood using wrong models. Mol Biol Evol. 1999;16:564–566. doi: 10.1093/oxfordjournals.molbev.a026137. [DOI] [PubMed] [Google Scholar]
- Felsenstein J. Cases in which parsimony or compatibility methods will be positively misleading. Syst Zool. 1978;27:401–410. [Google Scholar]
- Felsenstein J. University of Washington; 1993. PHYLIP (Phylogeny Inference Package) version 3.5c. Seattle (WA): Department of Genetics.Distributed by the author. [Google Scholar]
- Felsenstein J. Sunderland (MA): Sinauer Associates; 2004. Inferring Phylogenies. [Google Scholar]
- Fletcher W, Yang Z. INDELible: a flexible simulator of biological sequence evolution. Mol Biol Evol. 2009;26:1879–1888. doi: 10.1093/molbev/msp098. [DOI] [PMC free article] [PubMed] [Google Scholar]
- Fukami-Kobayashi K, Tateno Y. Robustness of maximum likelihood tree estimation against different patterns of base substitutions. J Mol Evol. 1991;32:79–91. doi: 10.1007/BF02099932. [DOI] [PubMed] [Google Scholar]
- Gadagkar SR, Kumar S. Maximum likelihood outperforms maximum parsimony even when evolutionary rates are heterotachous. Mol Biol Evol. 2005;22:2139–2141. doi: 10.1093/molbev/msi212. [DOI] [PubMed] [Google Scholar]
- Gascuel O. BIONJ: an improved version of the NJ algorithm based on a simple model of sequence data. Mol Biol Evol. 1997;14:685–695. doi: 10.1093/oxfordjournals.molbev.a025808. [DOI] [PubMed] [Google Scholar]
- Gaucher EA, Miyamoto MM. A call for likelihood phylogenetics even when the process of sequence evolution is heterogeneous. Mol Phylogenet Evol. 2005;37:928–931. doi: 10.1016/j.ympev.2005.03.027. [DOI] [PubMed] [Google Scholar]
- Gesell T, von Haeseler A. In silico sequence evolution with site-specific interactions along phylogenetic trees. Bioinformatics. 2006;22:716–722. doi: 10.1093/bioinformatics/bti812. [DOI] [PubMed] [Google Scholar]
- Goldman N. Statistical tests of models of DNA substitution. J Mol Evol. 1993;36:182–198. doi: 10.1007/BF00166252. [DOI] [PubMed] [Google Scholar]
- Guindon S, Gascuel O. A simple, fast, and accurate algorithm to estimate large phylogenies by maximum likelihood. Syst Biol. 2003;52:696–704. doi: 10.1080/10635150390235520. [DOI] [PubMed] [Google Scholar]
- Hasegawa M, Kishino H, Saitou M. On maximum likelihood method in molecular phylogenetics. J Mol Evol. 1991;32:443–445. doi: 10.1007/BF02101285. [DOI] [PubMed] [Google Scholar]
- Ho SYW, Heupink TH, Rambaut A, Shapiro B. Bayesian estimation of sequence damage in ancient DNA. Mol Biol Evol. 2007;24:1416–1422. doi: 10.1093/molbev/msm062. [DOI] [PubMed] [Google Scholar]
- Ho SYW, Jermiin L. Tracing the decay of the historical signal in biological sequence data. Syst Biol. 2004;53:623–637. doi: 10.1080/10635150490503035. [DOI] [PubMed] [Google Scholar]
- Huelsenbeck JP. Performance of phylogenetic methods in simulation. Syst Biol. 1995a;44:17–48. [Google Scholar]
- Huelsenbeck JP. The robustness of two phylogenetic methods: four-taxon simulations reveal a slight superiority of maximum likelihood over neighbor joining. Mol Biol Evol. 1995b;12:843–849. doi: 10.1093/oxfordjournals.molbev.a040261. [DOI] [PubMed] [Google Scholar]
- Huelsenbeck JP, Hillis D. Success of phylogenetic methods in the four-taxon case. Syst Zool. 1993;42:247–264. [Google Scholar]
- Huelsenbeck JP, Ronquist F. MRBAYES: Bayesian inference of phylogenetic trees. Bioinformatics. 2001;17:754–755. doi: 10.1093/bioinformatics/17.8.754. [DOI] [PubMed] [Google Scholar]
- Jukes TH, Cantor CR. Evolution of protein molecules. In: Munro HN, editor. Mammalian protein metabolism. Vol. 3. New York: Academic Press; 1969. pp. 21–132. [Google Scholar]
- Kimura M. A simple method for estimating evolutionary rates of base substitutions through comparative studies of nucleotide sequences. J Mol Evol. 1980;16:111–120. doi: 10.1007/BF01731581. [DOI] [PubMed] [Google Scholar]
- Kimura M. Estimation of evolutionary distances between homologous nucleotide sequences. Proc Natl Acad Sci U S A. 1981;78:454–458. doi: 10.1073/pnas.78.1.454. [DOI] [PMC free article] [PubMed] [Google Scholar]
- Klaere S, Gesell T, von Haeseler A. The impact of single substitutions on multiple sequence alignments. Philos Trans R Soc Lond B Biol Sci. 2008;363:4041–4047. doi: 10.1098/rstb.2008.0140. [DOI] [PMC free article] [PubMed] [Google Scholar]
- Kolaczkowski B, Thornton JW. Performance of maximum parsimony and likelihood phylogenetics when evolution is heterogeneous. Nature. 2004;431:980–984. doi: 10.1038/nature02917. [DOI] [PubMed] [Google Scholar]
- Kolaczkowski B, Thornton JW. A mixed branch length model of heterotachy improves phylogenetic accuracy. Mol Biol Evol. 2008;25:1054–1066. doi: 10.1093/molbev/msn042. [DOI] [PMC free article] [PubMed] [Google Scholar]
- Kolaczkowski B, Thornton JW. Long-branch attraction bias and inconsistency in Bayesian phylogenetics. PLoS One. 2009;4:e7891. doi: 10.1371/journal.pone.0007891. [DOI] [PMC free article] [PubMed] [Google Scholar]
- Kumar S, Nei M, Dudley J, Tamura K. MEGA: a biologist-centric software for evolutionary analysis of DNA and protein sequences. Brief Bioinform. 2008;9:299–306. doi: 10.1093/bib/bbn017. [DOI] [PMC free article] [PubMed] [Google Scholar]
- Lemmon AR, Moriarty EC. The importance of proper model assumption in Bayesian phylogenetics. Syst Biol. 2004;53:265–277. doi: 10.1080/10635150490423520. [DOI] [PubMed] [Google Scholar]
- Lockhart P, Novis P, Milligan BG, Riden J, Rambaut A, Larkum T. Heterotachy and tree building: a case study with plastids and eubacteria. Mol Biol Evol. 2006;23:40–45. doi: 10.1093/molbev/msj005. [DOI] [PubMed] [Google Scholar]
- Lopez P, Casane D, Philippe H. Heterotachy, an important process of protein evolution. Mol Biol Evol. 2002;19:1–7. doi: 10.1093/oxfordjournals.molbev.a003973. [DOI] [PubMed] [Google Scholar]
- Mateiu LM, Rannala BH. Bayesian inference of errors in ancient DNA caused by postmortem degradation. Mol Biol Evol. 2008;25:1503–1511. doi: 10.1093/molbev/msn095. [DOI] [PubMed] [Google Scholar]
- Minh BQ, Vinh LS, von Haeseler A, Schmidt HA. pIQPNNI—parallel reconstruction of large maximum likelihood phylogenies. Bioinformatics. 2005;21:3794–3796. doi: 10.1093/bioinformatics/bti594. [DOI] [PubMed] [Google Scholar]
- Nguyen MAT, Klaere S, von Haeseler A. MISFITS: evaluating the goodness of fit between a phylogenetic model and an alignment. Mol Biol Evol. 2011;28:143–152. doi: 10.1093/molbev/msq180. [DOI] [PubMed] [Google Scholar]
- Pagel M, Meade A. Modelling heterotachy in phylogenetic inference by reversible-jump Markov chain Monte Carlo. Philos Trans R Soc Lond B Biol Sci. 2008;363:3955–3964. doi: 10.1098/rstb.2008.0178. [DOI] [PMC free article] [PubMed] [Google Scholar]
- Philippe H, Lopez P. On the conservation of protein sequences in evolution. Trends Biochem Sci. 2001;26:414–416. doi: 10.1016/s0968-0004(01)01877-1. [DOI] [PubMed] [Google Scholar]
- Philippe H, Zhou Y, Brinkmann H, Rodrigue N, Delsuc F. Heterotachy and long-branch attraction in phylogenetics. BMC Evol Biol. 2005;5:50. doi: 10.1186/1471-2148-5-50. [DOI] [PMC free article] [PubMed] [Google Scholar]
- Posada D, Crandall KA. MODELTEST: testing the model of DNA substitution. Bioinformatics. 1998;14:817–818. doi: 10.1093/bioinformatics/14.9.817. [DOI] [PubMed] [Google Scholar]
- Rambaut A, Grassly NC. Seq-Gen: an application for the Monte Carlo simulation of DNA sequence evolution along phylogenetic trees. Comput Appl Biosci. 1997;13:235–238. doi: 10.1093/bioinformatics/13.3.235. [DOI] [PubMed] [Google Scholar]
- Rambaut A, Ho SY, Drummond AJ, Shapiro B. Accommodating the effect of ancient DNA damage on inferences of demographic histories. Mol Biol Evol. 2009;26:245–248. doi: 10.1093/molbev/msn256. [DOI] [PubMed] [Google Scholar]
- Schwarz G. Estimating the dimension of a model. Ann Stat. 1978;6:461–464. [Google Scholar]
- Shavit Grievink L, Penny D, Hendy MD, Holland BR. LineageSpecificSeqgen: generating sequence data with lineage-specific variation in the proportion of variable sites. BMC Evol Biol. 2008;8:317. doi: 10.1186/1471-2148-8-317. [DOI] [PMC free article] [PubMed] [Google Scholar]
- Shavit Grievink L, Penny D, Hendy MD, Holland BR. Phylogenetic tree reconstruction accuracy and model fit when proportions of variable sites change across the tree. Syst Biol. 2010;59:288–297. doi: 10.1093/sysbio/syq003. [DOI] [PMC free article] [PubMed] [Google Scholar]
- Spencer M, Susko E, Roger AJ. Likelihood, parsimony, and heterogeneous evolution. Mol Biol Evol. 2005;22:1161–1164. doi: 10.1093/molbev/msi123. [DOI] [PubMed] [Google Scholar]
- Stamatakis A, Hoover P, Rougemont J. A rapid bootstrap algorithm for the RAxML web servers. Syst Biol. 2008;57:758–771. doi: 10.1080/10635150802429642. [DOI] [PubMed] [Google Scholar]
- Sullivan J, Swofford DL. Should we use model-based methods for phylogenetic inference when we know that assumptions about among-site rate variation and nucleotide substitution pattern are violated? Syst Biol. 2001;50:723–729. doi: 10.1080/106351501753328848. [DOI] [PubMed] [Google Scholar]
- Swofford DL. PAUP*: phylogenetic analysis using parsimony (*and other methods). version 4. Sunderland (MA): Sinauer Associates; 2002. [Google Scholar]
- Vinh LS, von Haeseler A. IQPNNI: moving fast through tree space and stopping in time. Mol Biol Evol. 2004;21:1565–1571. doi: 10.1093/molbev/msh176. [DOI] [PubMed] [Google Scholar]
- Weiss G, von Haeseler A. Testing substitution models within a phylogenetic tree. Mol Biol Evol. 2003;20:572–578. doi: 10.1093/molbev/msg073. [DOI] [PubMed] [Google Scholar]
- Wu J, Susko E. General heterotachy and distance method adjustments. Mol Biol Evol. 2009;26:2689–2697. doi: 10.1093/molbev/msp184. [DOI] [PubMed] [Google Scholar]
- Yang Z. How often do wrong models produce better phylogenies? Mol Biol Evol. 1997;14:105–108. doi: 10.1093/oxfordjournals.molbev.a025695. [DOI] [PubMed] [Google Scholar]
- Yang Z. Computational molecular biology. New York: Oxford University Press; 2006. [Google Scholar]
Associated Data
This section collects any data citations, data availability statements, or supplementary materials included in this article.