


Abstract
Chemical probing is a common method for the structural characterization of RNA. Typically, RNA is radioactively end-labelled, subjected to probing conditions, and the cleavage fragment pattern is analysed by gel electrophoresis. In recent years, many chemical modifications, like fluorophores, were introduced into RNA, but methods are lacking that detect the influence of the modification on the RNA structure with single-nucleotide resolution. Here, we first demonstrate that a 5′-terminal 32P label can be replaced by a dye label for in-line probing of riboswitch RNAs. Next, we show that small, highly structured FRET-labelled Diels–Alderase ribozymes can be directly probed, using the internal or terminal FRET dyes as reporters. The probing patterns indeed reveal whether or not the attachment of the dyes influences the structure. The existence of two dye labels in typical FRET constructs is found to be beneficial, as ‘duplexing’ allows observation of the complete RNA on a single gel. Structural information can be derived from the probing gels by deconvolution of the superimposed band patterns. Finally, we use fluorescent in-line probing to experimentally validate the structural consequences of photocaging, unambiguously demonstrating the intentional destruction of selected elements of secondary or tertiary structure.
INTRODUCTION
Chemical and enzymatic probing of structured RNA species is of outstanding importance for RNA biochemistry (1–4). Usually, these techniques provide the first (and often only) insight into the structural basis of ribozyme function (5–8) or aptamer-target recognition (9–11). One of the simplest chemical probing techniques is in-line probing, where the RNA is incubated at slightly alkaline pH, and the spontaneous cleavage of the sugar backbone by adjacent 2′-hydroxyl groups is monitored. The cleavage rate of an individual phosphodiester group depends on the ionization state of the 2′-OH group, the distance between 2′-OH and phosphorus, and the correct in-line orientation of incoming nucleophile, electrophilic centre and leaving group (12). The latter two parameters are correlated to the local flexibility: in regular helical parts this in-line conformation cannot be formed, causing a lack of cleavage bands in these regions. In contrast, extended unstructured, ‘random coil’ regions have a high degree of conformational freedom so that in-line conformations are statistically adopted, leading to rather uniform ladder-like cleavage band patterns. Strong cleavage bands, however, will be detected when the phosphodiester bond is fixed in an optimal in-line conformation. In-line probing can be conducted in a titration-type manner to study binding interactions and thereby even allows mechanistic conclusions (13). Commonly, RNA is radioactively end-labelled for these studies, and the cleavage fragments are analysed by gel electrophoresis (14).
In past years, an increasing number of chemical modifications have been introduced into RNA and studied in a biological context. Fluorescently labelled RNA molecules were used in smFRET (single-molecule FRET) folding studies (15–19), ribozyme activity assays (20,21) or high-resolution microscopy (22). Furthermore, the molecular characteristics of RNAs were expanded and tuned by incorporating a multitude of different modifiers. One example are RNAs that have been specifically modified with photocleavable protection groups (caged RNAs) to unravel folding processes or to switch functional states of RNAs (23,24). However, it is often only assumed that the highly modified RNA preserves all structural characteristics of its unmodified parent. Yet, there is no suitable technique available to directly verify this assumption. A FRET efficiency value in the expected range can at most confirm the global fold of the RNA of interest, while local perturbations caused by the dyes or other modifiers are impossible to resolve. Such information, on the other hand, could be provided by chemical probing. Therefore, we asked whether the fluorescent labels already present in the RNA molecules could be utilized to gather structural information by in-line probing, without the need to incorporate additional radioactive labels, and without the disadvantages associated with radioactive work.
Here, we first demonstrate that a 5′-terminal 32P label can be directly replaced by a dye label for in-line probing of riboswitches. Side-by-side comparison shows near-identical probing patterns and binding constants of its cognate ligand. Next, we show that small, highly structured FRET-labelled Diels–Alderase (DAse) ribozymes can be directly probed, and the probing patterns reveal whether or not the attachment of the dyes influences the correct folding. Finally, we probe highly modified RNAs, carrying FRET dyes, photocaging groups and a biotin tag, that are not accessible to 5′- or 3′-32P labelling, and provide structural information about these molecules. The existence of two dye labels in typical FRET constructs is found to be beneficial, as additional structural information can be derived from the probing gels by deconvolution of the superimposed band patterns.
MATERIALS AND METHODS
Oligonucleotides
Bacillus subtilis was cultured overnight at 37°C, 250 rpm in LB-medium. Genomic DNA was isolated with the GenElute Bacterial Genomic DNA Kit (Sigma), and the 5′-UTR of the lysC gene from 305 to 126 nt before the start of the coding region was amplified by PCR using the forward primer (additionally containing a T7-promoter sequence): 5′-TAA TAC GAC TCA CTA TAG GTG AAG ATA GAG GTG CG-3′, and the reverse primer: 5′-AAC GAG ATA GCC CTC CAA GA-3′, applying the supplier′s standard protocol with an annealing temperature of 57°C using Taq polymerase (Rapidozyme). The product obtained was transcribed with T7 RNA polymerase to yield the 179 nt riboswitch aptamer.
A total of 600 pmol of this product were dephosphorylated, thiophosphorylated and fluorescently labelled by the 5′-EndTag Nucleic Acid End Labeling Kit (Vector Laboratories) using Atto 633 maleimide (Atto-Tec) as fluorescent dye. After phenol–ether extraction, labelled RNA was ethanol precipitated. To obtain the product in high purity, it was afterwards subjected to spin column purification (GE Healthcare). Elution lead to 200 pmol of labelled RNA.
Unmodified wild-type DAse ribozyme (5′-GGA GCU CGC CCG GGC GAG GCC GUG CCA GCU CUU CGG AGC AAU ACU CGG C-3′) was obtained from CSS Chemical Synthesis Services (Craigavon, Northern Ireland). 5′-32P labelling was performed using T4 polynucleotide kinase and γ-32P-ATP (Hartmann Analytics). DAse variants with up to five site-specific modifications were synthesized by a combined procedure of solid-phase chemical synthesis and splinted enzymatic ligation of separately modified RNA fragments. Oligonucleotides carrying only a Cy3 or Cy5 modification, as well as the 49-mer splint DNA (5′-Fluorescein-GTC GAG TAT TGC TCC GAA GAG CTG GCA CGA CCT CGC CGA AGC GAG CTC C-3′), were obtained from IBA GmbH (Göttingen, Germany) as 100 µM stock solutions and were used as received. In comparison to the parental sequence, nucleotides C20 and G48 were mutated to U20 and A48, respectively, in order to introduce an optional fluorophore labelling site in helix 2. Activity measurements have shown that this sequence modification does not influence ribozyme catalysis (25).
All modified DAse constructs were derived from the RNA sequences 5′-GGA GCU CGC UUC GGC GAG GUC GUG CCA-3′ (27-mer, Cy3), 5′-GCU CUU CGG AGC AAU ACU CGA C(U)-biotin-3′ (22-/23-mer, Cy5), 5′-GGA GCU CGC UUC GG-3′ (14-mer, Cy3), 5′-CGA GGU CGU GCC A-3′ (13-mer, NPE), 5′-GCU CUU CGG AG-3′ (11-mer, Cy5) and 5′-CAA UAC UCG AC-biotin-3′ (11-mer, NPE) carrying the respective modifications at one of the underlined positions. For post-synthetic attachment of fluorescent sulphonated cyanine dyes, uridine or adenine was substituted with 5-{3-[(6-aminohexyl)amino]-3-oxo-1-propenyl}-2′-deoxyuridine or N8-(aminohex-1-yl)-8-amino-2′-deoxyadenosine, respectively (Supplementary Figure S1). For constructs A and C, the 22-mer was extended by an additional uridine (parenthesized) to incorporate a 3′-terminal Cy5 dye. Oligonucleotide fragments carrying the photocleavable NPE group were self-made by using the respective phosphoramidites of NPE-protected cytidine or uridine (26,27) in RNA solid-phase synthesis (Supplementary Figure S1). A biotin-loaded resin (IBA GmbH) was used for the 3′-biotin-derivatized sequences. All self-made oligonucleotides were purified (semi-preparative reversed phase HPLC, DMT-on), desalted (NAP-25, GE Healthcare), DMT-deprotected and precipitated according to standard procedures. Their chemical identity was confirmed by high-resolution mass spectroscopy on a Bruker micrOTOF-Q II (ESI) in negative mode (Supplementary Table S1).
A two-way RNA ligation system was used to assemble the constructs A–D (3′-27-mer+23-mer-5′), whereas a three-way RNA ligation system was used to assemble the NPE-protected 49-mer constructs E–H (3′-14-mer + 13-mer + 22-mer-5′) essentially as described previously (28). All ligation products were purified on preparative gels (denaturing PAGE, 12.5%). The high purity of all DAse constructs was verified by analysing the samples on a denaturing sequencing gel (PAGE, 15%) and scanning for Cy3 and Cy5 fluorescence with a Typhoon 9400 gel scanner (GE Healthcare).
In-line probing
Lysine Riboswitch Aptamer: 6 pmol of the fluorescently labelled riboswitch or 0.06 pmol of 5′-32P-labelled riboswitch (29) were dissolved in a volume of 20 µl containing 50 mM Tris–HCl buffer (pH 8.5 at 25°C), 100 mM KCl and 20 mM MgCl2, in the presence of 20 µg Escherichia coli total tRNA. If indicated, the samples were supplemented with 1 nM to 1 mM l-lysine (Sigma). After unfolding for 4 min at 70°C, the RNA was refolded by controlled cooling to 4°C at a rate of 0.2 K/s, and left at that temperature for 10 min. Then the probing reaction was performed at 35°C for 24 h until it was quenched by addition of gel loading buffer containing 7 M urea, 10 mM EDTA and bromophenol blue dye.
Partial alkaline digest was done by incubation of 6 pmol fluorescently labelled RNA or 0.06 pmol of 5′-32P-labelled riboswitch in 10 µl 50 mM NaHCO3 buffer (pH 9) with 10 µg E. coli total tRNA at 90°C for 5 min and subsequent immediate quenching of the reaction on ice and addition of gel loading buffer.
G-specific sequencing ladders were generated by incubation of 6 pmol fluorescently labelled RNA or 0.06 pmol of 5′-32P-labelled riboswitch with 10 µg E. coli total tRNA in 10 µl 12.5 mM sodium citrate buffer (pH 4.5) containing 3.5 M urea and 0.5 mM EDTA. After denaturation of the RNA for 10 min at 55°C, 0.4 U (2 µl) RNase T1 were added and the sample incubated for additional 10 min at 55°C. Then the reaction was terminated by addition of gel loading buffer.
The cleavage products were separated by loading 6 µl samples on 10% PAGE gels. Gels were run for 3 h at 45 W and visualized by scanning the Atto 633 label with a Typhoon 9400 gel scanner. After subtracting the average background intensity of a region on the gel that was not penetrated by a radioactive or dye-labelled sample, the intensity of the cleavage bands in all in-line probing lanes was corrected for loading differences by using a lysine-invariant cleavage band. The lanes NR, T1 and OH do not play any role in the quantification process. Quantification was done using ImageQuant software (Molecular Dynamics). Data were normalized and fitted to a logistic dose-response model according to the equation
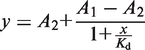 |
using OriginPro8 (OriginLab), where A1 is the higher and A2 the lower limit the curve approaches, Kd the apparent dissociation constant, y the fraction cleaved and x the concentration of l-lysine (30).
DAase ribozyme constructs
A total of 2 pmol of each fluorescently labelled construct or 0.2 pmol 32P-labelled ribozyme were dissolved in a volume of 10 µl containing 50 mM Tris–HCl (pH 8.5 at 23°C), 100 mM KCl, 250 mM NaCl, 10% ethanol and MgCl2 in a concentration of 0, 20 or 80 mM. The samples were refolded by heating for 4 min to 70°C and allowing them to slowly cool down to room temperature. Afterwards the samples were incubated at 23°C for 4 days. Then the reaction was terminated by addition of 10 µl gel loading buffer.
Partial alkaline digests of the samples were performed by incubation of 2 pmol of each fluorescently labelled construct or 0.2 pmol 32P-labelled ribozyme in a volume of 10 µl with 10 µg of E. coli total tRNA in a 50 mM NaHCO3 buffer (pH 9) at 90°C for 10 min. Reactions were terminated by putting the samples on ice and addition of gel loading buffer.
G-specific sequencing ladders were freshly prepared by incubating 2 pmol fluorescently labelled or 0.2 pmol 32P-labelled RNA in a volume of 10 µl. The buffer contained 50 mM sodium citrate (pH 5) and 7 M urea. After heating the sample to 70°C for 10 min to ensure complete denaturation of the RNA, 0.2 U (2 µl) of RNase T1 (Fermentas) were added to the samples. After a reaction time of 10 min, reactions were terminated by addition of 8 µl gel loading buffer.
The cleavage products were separated by loading 9 µl of each solution on a 13.5% PAGE gel. Gels were run for 3 h at 45 W and visualized by scanning the Cy3 label fluorescence at 532 nm. Image processing was performed using ImageJ software (31). Subtraction images were obtained by background subtraction in both scans and subsequent normalization. Images derived from the terminal label were then subtracted from the respective internal counterpart and all intensity values <0 were set to zero.
RESULTS
Replacement of a terminal 32P label in simple probing experiments
In order to test whether a terminal 32P label could be replaced by a fluorescent dye, we performed in-line probing on the 179-mer riboswitch aptamer from the lysC gene of B. subtilis, which is the second-largest known natural riboswitch motif. As the lysine riboswitch is generally preformed, only those nucleotides in the binding pocket that actively take part in the recognition of the ligand or that are in close proximity change their cleavage intensity in an in-line probing experiment. Determination of these slight changes in a long RNA is more demanding than the detection of global refolding events observed in other riboswitches.
Riboswitch RNA was generated by in vitro transcription and 5′-labelled with Atto 633 or 32P. Both RNAs were subjected to in-line probing with varying concentrations of l-lysine in the probing buffer (1 nM to 1 mM). Both labels were visualized on the same instrument (Typhoon 9400 Gel Scanner). From the resulting cleavage patterns the apparent dissociation constants were derived (Figure 1a and b).
Figure 1.

A fluorescent label can replace a 32P in riboswitch binding studies. (a) In-line probing analysis of the 5′-Atto 633 labelled lysC lysine riboswitch aptamer from B. subtilis. Reactions were performed in the absence (lane B) or in the presence of l-lysine (1 nM to 1 mM). NR, T1 and OH represent unreacted RNA, a G-specific sequencing ladder and a partial alkaline digest, respectively. Selected bands in the T1 lane are annotated with the nucleotide position. Regions 1–3 represent sites where the extent of spontaneous cleavage is modulated by the lysine concentration and were assigned either directly or by analogy to published probing patterns (32,34). (b) In-line probing analysis of the 5′-32P-labelled lysC lysine riboswitch aptamer. (c) Secondary structure representing the lysine riboswitch aptamer. Important tertiary interactions and structural elements are marked. Nucleotides depicted in blue show spontaneous cleavage under in-line probing conditions. Nucleotides depicted in red show lysine-induced changes of their spontaneous cleavage. (d) Comparison of the intensity of the cleavage bands in all three regions of lysine-induced cleavage modulation. For both labels, the intensity of the cleavage band at 1 mM l-lysine is divided by the cleavage intensity in the absence of ligand (after background correction). (e) Plot depicting the normalized fraction of RNA cleaved (after correction for loading differences using the band of strong, lysine-independent cleavage annotated with ‘correction’) in region 1 for both labels (32P in black and Atto 633 in red) versus the concentration of l-lysine.
The data obtained with both methods are in good agreement with each other and with earlier reports (32). The overall band patterns are stable and reproducible with the fluorescent approach. Three regions of attenuated cleavage can be observed with increasing lysine concentrations, as they participate in binding the metabolite. While nucleotides 84–86 (Region 3, Figure 1c) are known to form contacts to the ε-amine of the lysine side chain, nucleotides 148–149 (Region 2) hydrogen-bond to the acid functionality and the α-amine. Upon binding, the pocket obtains further stabilization, which can be seen from the reduced cleavage of nucleotides 170–174 (Region 1) (33,34).
The intensity of the cleavage bands observed in all three regions corresponds very well with the values obtained with 32P (Figure 1d). Figure 1e shows the determination of the apparent dissociation binding constant using both methods. For the fluorescent label, the Kd was determined as (1.10 ± 0.26) µM, which is in good agreement with the value determined for the radioactive label (0.98 ± 0.10) µM and with published data (1 µM) (35).
Fluorescent probing of highly modified, structured small ribozymes with two terminal labels
Next, we investigated whether one could directly observe the perturbation of structural elements of RNA that is induced by the attachment of a bulky fluorescent label. This information would help in choosing the optimal position(s) for labelling, so that the native 3D structure of the RNA is kept intact, and the RNA remains fully functional. Small local alterations cannot be detected directly by observation of unexpected FRET efficiency values, as the global fold will remain largely unchanged. In contrast, in-line probing provides structural information on the single-nucleotide level and should therefore be able to resolve small perturbations in the fine structure of an RNA.
We tested this hypothesis by probing several DAse ribozyme constructs derivatized with a 3′-biotin and labelled with a Cy3/Cy5-FRET pair in different positions, designed to unravel the role of individual structural elements in single-molecule FRET studies (Figure 2a). The DAse represents a small, compact and highly structured artificial ribozyme that catalyzes a cycloaddition reaction (36). Its 3D structure involves three helices, a nested pseudoknot (dotted lines in Figure 2a) and further complex structural elements (7,37). Although the dye positions were selected based on high-resolution crystallographic information, one cannot predict which positions are more intrusive than others. In fact, recent activity measurements on FRET-labelled DAases yielded rather surprising results (25).
Figure 2.

In-line probing analysis with two terminal labels. (a) Secondary structure representing the DAse ribozyme. Important structural features are indicated. Dashed lines represent a nested pseudoknot. U50 is put in brackets as it is present only in constructs A and C. The table shows the position of the dye labels and photocleavable NPE groups used in this study. (b) Schematic representation of an RNA labelled with fluorescent dyes on both termini. Stars represent the dyes and white gaps cleavage sites resulting from a chemical probing experiment. The three panels labelled with Cy3, Cy5 and + represent gel scans of the dyes and a superimposed image of both scans, respectively. Yellow bands represent superposition in both scans. (c) In-line probing analysis of the 5′-32P-labelled wild-type DAse ribozyme. Reactions were performed at three different Mg2+-concentrations (0, 20, 80 mM). (d) In-line probing analysis of a Cy35′-Cy5U50-labelled DAse construct A. Both dyes were scanned independently from the same gel (images separated by a double line). Selected cleavage bands are annotated on the left (for the Cy3 scan) and on the right (for the Cy5 scan) of the gel.
Most of the constructs used here are chemically modified on both termini and, thus, not easily accessible to standard (32P) labelling and probing. In these cases, the fluorescent labels already present in the structure are the only possibility to obtain structural data from in-line probing experiments. All ribozyme constructs were subjected to in-line probing at three different magnesium ion concentrations: 0 mM where the ribozyme is inactive and the tertiary structure is not properly formed, 80 mM where the ribozyme is highly active and which is the standard assay concentration, and 20 mM as an intermediate value (7).
The in-line probing pattern of each of the constructs was analysed and compared to the one derived from the unmodified 5′-32P-labelled wt ribozyme reference (Figure 2c). If the oligonucleotide is labelled on both termini, as in construct A, two probing patterns are generated simultaneously during the probing experiment. The Cy3 dye, which is attached to the 5′-end, leads to a cleavage pattern identical to that of the 5′-32P label, resolving all cleavage products truncated from the 3′-end. Their 5′-truncated counterparts can be visualized on the same PAGE gel by monitoring the Cy5-label that is attached to U50 (representing an appended 3′-terminal label). This duplexing facilitates observation of the complete RNA to be probed on a single gel without compromising with the resolution (Figure 2b).
Analysis of the DAse cleavage patterns indicates a compact and highly ordered structure for both, wild-type and construct A. In agreement with earlier Pb2+-probing studies (7), the following features can be detected using the 5′-labels (Figure 2d): rather strong cleavage in the upper bulge region (nucleotides 20–26) and in the upper tetraloop (nucleotides 33–35), while helix 3 is unsusceptible to cleavage (nucleotides 27–32, 36–39). Some (weaker) cleavage is seen in the lower bulge region (nucleotides 40–45). The 3′-label additionally reports very low cleavage for helix 1 (nucleotides 5–18) except for the tetraloop (around U11). The cleavage bands at U6, G8 and C9 are likely related to a high-affinity magnesium ion binding site in close proximity (38). In agreement with earlier data, helix 2 is the weakest of the three helices and shows significant cleavage (nucleotides 19–22, 46–49). Two earlier observed cleavage hotspots are also detected (C26, U42, see loading control, lane NR) that correspond to pyrimidine–purine junctions.
In summary, neither the overall structure of the ribozyme, nor any relevant structural detail is perturbed by the attachment of the two labels on the two termini, as the cleavage pattern of construct A is identical to that of the wild-type ribozyme. In agreement with this observation, construct A was found to have full catalytic activity, compared to the wild-type (Supplementary Table S2) (25).
In-line probing of constructs carrying one terminal and one internal label
The situation that both dyes are attached to the two termini of the oligonucleotide is not the common case for FRET constructs. Internal labels have been—at least to our knowledge—completely neglected in chemical probing experiments, mainly for two reasons: (i) site-specific internal labelling is far more laborious than terminal labelling, and (ii) the analysis of cleavage patterns derived from internal labels is more demanding. In contrast to the easy-to-interpret ladder-like patterns derived from terminal labels, internal labels will produce two ladder-like patterns that overlay on the gel and cannot be assigned to specific cleavage products without additional information (Figure 3b). Often, two cleavage products of the exact same length will occur upon cleavage at different positions. For example, a cleavage at G2 results in a 47-mer, as a cleavage at G47 does. The two products cannot be distinguished directly as they both carry the dye and have similar electrophoretic mobilities. Still, the bands do not superimpose perfectly, as they have different sequences or (like in our case), carry different modifications. Now, the probing pattern derived from the terminal label (showing only one type of truncations) can be used as internal standard to distinguish the 3′-truncated from the 5′-truncated sequences in the pattern created by the internal label. This can be done since all cleavage products that carry both labels have to be present in both scans and have to superimpose perfectly (both, in position and intensity) (Figure 3b). Therefore the image of the terminal label can be subtracted from the one obtained with the internal dye after normalization. Then, only those bands remain visible that originate from truncation products that do not carry the terminal label. The probing pattern can subsequently be analysed without bias.
Figure 3.

In-line probing analysis with one terminal and one internal label. (a) In-line probing analysis of a Cy35’-Cy5U33-labelled DAse construct B. The right image is a subtraction of the Cy3 scan from the Cy5 scan after normalization. Selected cleavage bands are annotated on the left (for the Cy3 scan) and on the right (for the subtraction image) of the gel. The position of the internal label is indicated by the dashed lines. (b) Schematic representation of the probing experiment. The panel labelled with Cy5–Cy3 represents a subtraction image with all values <0 set to zero. The yellow box indicates which cleavage products superimpose in both scans (indicated as yellow bands). The dashed box shows the cleavage products visible in the subtraction image.
To investigate this situation, we synthesized constructs B and C. While B has a 5′-terminal and an internal label, C carries a 3′-terminal and an internal label (Figure 2a). In Figure 3a, left panel, one can immediately assign the position of the internal dye in construct B by the large gap in the alkaline digest ladder. The probing patterns obtained for construct B show that much information can be derived from those parts of the gel that require image processing prior to analysis (Figure 3a). The cleavage status of all nucleotides between G1 and G14 can only be assigned after subtraction of the 3′-truncated species that carry both dyes, as outlined in Figure 3b.
The overall cleavage pattern is found to be very similar to that of the wild-type. However, B exhibits some slight differences. The most significant one is the disappearance of the cleavage band at U42 at high magnesium ion concentration, indicating a different conformation at this nucleotide, compared to the wild-type. As U42 is a key player within the hydrogen bonding network inside the catalytic pocket, it is not surprising that construct B shows reduced activity (60%, compared to wild-type), while constructs A and C are fully active (Supplementary Table S2) (25).
The absence of cleavage in the upper tetraloop (U32–G35), where the internal dye is attached, is expected to have less influence, as those nucleotides are far away from the active centre of the ribozyme.
The cleavage pattern of construct C is essentially identical with the one obtained for the wild-type ribozyme. In this case, the only additional information obtained from the second label is the cleavage band at C49 that results from the appended dangling U50 (Supplementary Figure S2).
In-line probing of constructs with two internal labels
In the third possible case, both fluorescent dyes are attached to internal positions (construct D, see Figure 2a). Here, both scans contain biased regions (Supplementary Figure S3). The products resulting from cleavage between both dyes can be resolved without bias as they carry only a single dye and will therefore appear only in one channel. They will either be resolved directly, or can be visualized by subtraction as described above (Figure 4a). For cleavage products that carry both labels, however, an unbiased annotation is not possible.
Figure 4.

In-line probing analysis with two internal labels. (a) Schematic representation of the experiment. The panels labelled with Cy5–Cy3 and Cy3–Cy5 are subtraction images with all values <0 set to zero. Yellow bands in the superimposed image indicate cleavage products present in both scans. The dashed box shows the part of the sequence that can be analysed unambiguously. The dashed line shows the border above which only cleavage products carrying both labels are present. (b) In-line probing analysis of four DAse ribozyme constructs (A–D). The images show a section of the unmodified Cy3 scan from the gels visible in Figure 2d, 3a and Supplementary Figure S3. Below each image, the relative catalytic activity, with respect to the wild-type ribozyme, is given.
For construct D, nucleotides U6–A41 (or 73% of the sequence) can be assigned, while no exact annotation is possible for all bands resulting from cleavage at G1–C5 and U42–C49 as they have similar electrophoretic mobility, carry both labels, and can thus not be dissected unequivocally by subtraction (Supplementary Figure S2). Often, however, one of the two possible interpretations is much more likely than the other, if one considers general structural knowledge about the RNA under investigation, as well as the probing patterns of related constructs. For construct D, analysis of the two scans (including the subtraction images) confirms the overall fold of the DAse in the region from U6–A41 (Supplementary Figure S3). Comparison of the biased region with the reference images of construct A–C shows significant differences (Figure 4b). The strong cleavage band in construct D (annotated with U42) is not present in any other construct. This band could be either annotated to U42 (the nucleotide directly next to the dye label) or to C5 (helix 1). Observing a single strong cleavage band in an extended helical structure with high thermodynamic stability is extremely unlikely taking into further account that the other possible cleavage site is under direct influence of the label and located in the bulge region that is known to be susceptible to cleavage. In addition, Figure 4b shows that a cleavage band for U45, visible in all reference constructs is missing in construct D. As this nucleotide is, like U42, part of the lower bulge, we conclude that the local structure in this region is significantly changed. This may explain the complete inactivity of this particular FRET construct (Supplementary Table S2) (25).
In summary, these results demonstrate that the fluorescent labels in RNA FRET constructs can report structural perturbations induced by the dyes themselves when subjected to in-line probing, although some conclusions, especially in direct proximity of the dyes, can only be drawn indirectly. While in no case the overall structure was disturbed, two constructs showed slightly altered probing patterns ascribed to structural changes inside the catalytic pocket (Figure 4b), and only those two constructs had a reduced catalytic activity.
In-line probing of photocaged, fluorescently labelled oligonucleotides
After demonstrating that fluorescent in-line probing could identify non-intrusive positions for labelling, we turned the question around and asked whether it could also help in verifying the efficient, intentional destruction of higher order structure. We designed several photocaged DAse constructs E–H (all derived from the Cy55′- Cy3U33 DA construct B) for future single-molecule studies of ribozyme folding dynamics (Figure 2a). In addition to the modifications already present in the uncaged constructs, these caged ribozymes are derivatized with one or two o-nitrophenylethyl (NPE) groups in key positions that are predicted to be essential for the correct folding—and thus for the activity—of the ribozyme (Supplementary Figure S1). The NPE groups can be cleaved upon irradiation with light to yield the unprotected ribozyme. In contrast to the situation in the preceding paragraph, the goal is now to find constructs where certain elements of secondary or tertiary structure are significantly changed, compared to the wild-type.
Constructs E–G were designed to investigate how an essential element of secondary structure, namely helix 2, could be most efficiently perturbed, while in construct H the tertiary structure is disrupted. Differences in the probing patterns of E–G as compared to B allow to gain insights into structural perturbation(s) caused by individual caging groups and can be further correlated to changes in the catalytic activity of the ribozyme. It should be noted that the presence of a caging group influences the electrophoretic mobility of the respective fragments, and the position of the caging group(s) can therefore be derived directly from the probing patterns.
As can be seen in Figure 5a, the probing pattern of construct E shows a high degree of similarity to B. In the presence of magnesium ions, only the cleavage band at nucleotide U20 (the one that carries the photocaging group) is intensified. The caging group apparently does not prevent the formation of helix 2, and the catalytic pocket seems to be largely intact. This correlates well with the significant residual activity of 30%, compared to the B (Supplementary Table S2) (39).
Figure 5.

In-line probing analysis of five DAse ribozyme constructs (B–H). All constructs are labelled with two fluorescent dyes (Cy35′–Cy5U33). Constructs E–H are modified with photocleavable NPE protecting groups in different positions. The image shows the Cy3 scan, except for the rightmost panel, which is the subtraction image (Cy5–Cy3) of construct H. Black connecting lines illustrate the influence of an attached NPE group on the electrophoretic mobility.
In construct F and the double-caged construct G, extended regions of very uniform cleavage are visible (U20–A27 and A40–C49), indicating destruction of helix 2 and the ordered bulge region (Figure 5a). The only two parts of structure that are found to be protected from cleavage (and should therefore be still intact) are helices 1 and 3. The fact that both constructs show no catalytic activity in the caged state is in agreement with this finding (39).
In construct H, the photocaging group is located at the exocyclic amino group of nucleotide C25, a functional group that forms a pseudoknot-Watson–Crick hydrogen bond with G2 at the 5′-end (dashed line in Figure 2a), and an important tertiary H-bond with U42 in the lower bulge, thereby creating a base triple that is required for activity (37). Caging should interfere with both interactions. The overall probing pattern of this construct indicates that all three helices are intact, but increased cleavage is detected on both sides of the internal bulge, suggesting a less ordered structure in this region. In addition, we observe strong cleavage bands in the G1–G4 area, suggesting that the pseudoknot has opened (Figure 5b; see Supplementary Figure S4 for more details). This construct was found to be almost completely inactive (∼2%, relative to B) (Supplementary Table S2). Activity could be fully restored upon UV-irradiation and, thus, removal of the photocaging group (28).
DISCUSSION
Fluorescence is the preferred detection signal for most of today′s studies on RNA folding, activity, and structure in vitro as well as in vivo. Although the attachment of large fluorescent dyes is a major intervention in the structure of the RNA molecule, it is often taken for granted that the structural integrity of the molecules is maintained.
In this study, we investigated two very different types of RNAs, with different size, modification status and properties. In both cases, information was obtained on the single nucleotide level. The lysine riboswitch aptamer from B. subtilis was evaluated for its binding characteristics for l-lysine. The results confirm the previously reported properties. Three regions inside the molecule could be detected that showed attenuation in the same range as observed with radioactive labels. Furthermore, the apparent Kd-value for l-lysine was found to be essentially identical to earlier reported values. Therefore, ligand binding studies on large RNA aptamers can generally be conducted using fluorescent labels.
There is a high demand for analytical techniques that allow secondary and tertiary structure analysis of highly modified RNAs. For the small, structured DAse ribozymes we could obtain information about perturbations of the native structure by the introduction of various modifications. We could detect very subtle effects of FRET dyes introduced at internal positions on the probing band pattern, while the overall fold remained essentially the same. These small changes correlate well with the catalytic activity of the ribozymes. We are not aware of any other analytical technique that allows direct analysis of the structural effects of dye labels down to the single-nucleotide level. Indirect RNA probing techniques like SHAPE (3,4) cannot be used for this purpose, as they rely on enzymatic primer elongation, which may be severely hampered by the presence of internal dye labels.
We could also experimentally validate the structural consequences of photocaging. Whether or not a caging group influences the function of an RNA can often be easily determined—e.g. by measuring the catalytic rate acceleration or binding constant. These measurements, however, do not tell which secondary or tertiary interactions have actually been disrupted by the caging group, and whether or not the design goals of the researcher have been met. Using in-line probing with fluorescent labels, we could unambiguously demonstrate the intentional disruption of the tertiary structure (pseudoknot, base triple, construct H) with intact secondary structure (all 3 helices), as well as disruption of the secondary structure (helix 2, F and G) with concomitant breakdown of the tertiary structure.
Besides using fluorophores, two other methodological novelties were introduced here into chemical probing, namely the use of two different labels in one molecule, and the utilization of internal labels. While this can—in principle—also be achieved with radioactive labels, such approaches are laborious and cumbersome, and have therefore never become popular. Whereas the existence of a second label inside the molecule to be probed will almost always provide additional structural information, there is—from a probing perspective—rarely a benefit in incorporating a label internally. However, internal labelling is the typical situation in FRET measurements, and therefore the technique described here is highly suitable for the structural analysis of FRET constructs. We could demonstrate that overlapping ladder patterns derived from internal labels can be deconvoluted by simple image subtraction.
In conclusion, fluorescent in-line probing is a promising technique for the structural investigation of RNAs of various sizes. While exhibiting the same resolution as the commonly used radioactivity-based probing, it can be much more easily applied to the highly modified RNAs typically used in biophysical studies.
SUPPLEMENTARY DATA
Supplementary Data are available at NAR Online.
FUNDING
Deutsche Forschungsgemeinschaft (grant number Ja 794-3/5); Volkswagen foundation (grant number VW-I/82549). Funding for open access charge: Institutional Budget.
Conflict of interest statement. None declared.
Supplementary Material
ACKNOWLEDGEMENTS
The authors thank Marie-Luise Winz for her help with image processing.
REFERENCES
- 1.Stern S, Moazed D, Noller HF. Structural analysis of RNA using chemical and enzymatic probing monitored by primer extension. Methods Enzymol. 1988;164:481–489. doi: 10.1016/s0076-6879(88)64064-x. [DOI] [PubMed] [Google Scholar]
- 2.Forconi M, Herschlag D. Metal ion-based RNA cleavage as a structural probe. Methods Enzymol. 2009;468:91–106. doi: 10.1016/S0076-6879(09)68005-8. [DOI] [PubMed] [Google Scholar]
- 3.Watts JM, Dang KK, Gorelick RJ, Leonard CW, Bess JW, Jr, Swanstrom R, Burch CL, Weeks KM. Architecture and secondary structure of an entire HIV-1 RNA genome. Nature. 2009;460:711–716. doi: 10.1038/nature08237. [DOI] [PMC free article] [PubMed] [Google Scholar]
- 4.Weeks KM. Advances in RNA structure analysis by chemical probing. Curr. Opin. Struct. Biol. 2010;20:295–304. doi: 10.1016/j.sbi.2010.04.001. [DOI] [PMC free article] [PubMed] [Google Scholar]
- 5.Sigel RK, Vaidya A, Pyle AM. Metal ion binding sites in a group II intron core. Nat. Struct. Biol. 2000;7:1111–1116. doi: 10.1038/81958. [DOI] [PubMed] [Google Scholar]
- 6.Brannvall M, Mikkelsen NE, Kirsebom LA. Monitoring the structure of Escherichia coli RNase P RNA in the presence of various divalent metal ions. Nucleic Acids Res. 2001;29:1426–1432. doi: 10.1093/nar/29.7.1426. [DOI] [PMC free article] [PubMed] [Google Scholar]
- 7.Keiper S, Bebenroth D, Seelig B, Westhof E, Jäschke A. Architecture of a Diels-Alderase ribozyme with a preformed catalytic pocket. Chem. Biol. 2004;11:1217–1227. doi: 10.1016/j.chembiol.2004.06.011. [DOI] [PubMed] [Google Scholar]
- 8.Adilakshmi T, Bellur DL, Woodson SA. Concurrent nucleation of 16S folding and induced fit in 30S ribosome assembly. Nature. 2008;455:1268–1272. doi: 10.1038/nature07298. [DOI] [PMC free article] [PubMed] [Google Scholar]
- 9.Winkler W, Nahvi A, Breaker RR. Thiamine derivatives bind messenger RNAs directly to regulate bacterial gene expression. Nature. 2002;419:952–956. doi: 10.1038/nature01145. [DOI] [PubMed] [Google Scholar]
- 10.Sudarsan N, Hammond MC, Block KF, Welz R, Barrick JE, Roth A, Breaker RR. Tandem riboswitch architectures exhibit complex gene control functions. Science. 2006;314:300–304. doi: 10.1126/science.1130716. [DOI] [PubMed] [Google Scholar]
- 11.Brooks KM, Hampel KJ. A rate-limiting conformational step in the catalytic pathway of the glmS ribozyme. Biochemistry. 2009;48:5669–5678. doi: 10.1021/bi900183r. [DOI] [PubMed] [Google Scholar]
- 12.Soukup GA, Breaker RR. Relationship between internucleotide linkage geometry and the stability of RNA. RNA. 1999;5:1308–1325. doi: 10.1017/s1355838299990891. [DOI] [PMC free article] [PubMed] [Google Scholar]
- 13.Mandal M, Lee M, Barrick JE, Weinberg Z, Emilsson GM, Ruzzo WL, Breaker RR. A glycine-dependent riboswitch that uses cooperative binding to control gene expression. Science. 2004;306:275–279. doi: 10.1126/science.1100829. [DOI] [PubMed] [Google Scholar]
- 14.Regulski EE, Breaker RR. In-line probing analysis of riboswitches. Methods Mol. Biol. 2008;419:53–67. doi: 10.1007/978-1-59745-033-1_4. [DOI] [PubMed] [Google Scholar]
- 15.Lemay JF, Penedo JC, Tremblay R, Lilley DM, Lafontaine DA. Folding of the adenine riboswitch. Chem. Biol. 2006;13:857–868. doi: 10.1016/j.chembiol.2006.06.010. [DOI] [PubMed] [Google Scholar]
- 16.Steiner M, Karunatilaka KS, Sigel RK, Rueda D. Single-molecule studies of group II intron ribozymes. Proc. Natl Acad. Sci. USA. 2008;105:13853–13858. doi: 10.1073/pnas.0804034105. [DOI] [PMC free article] [PubMed] [Google Scholar]
- 17.Nierth A, Kobitski AY, Nienhaus GU, Jäschke A. Anthracene-BODIPY dyads as fluorescent sensors for biocatalytic Diels-Alder reactions. J. Am. Chem. Soc. 2010;132:2646–2654. doi: 10.1021/ja9084397. [DOI] [PubMed] [Google Scholar]
- 18.Heppell B, Blouin S, Dussault AM, Mulhbacher J, Ennifar E, Penedo JC, Lafontaine DA. Molecular insights into the ligand-controlled organization of the SAM-I riboswitch. Nat. Chem. Biol. 2011;7:384–392. doi: 10.1038/nchembio.563. [DOI] [PubMed] [Google Scholar]
- 19.Haller A, Rieder U, Aigner M, Blanchard SC, Micura R. Conformational capture of the SAM-II riboswitch. Nat. Chem. Biol. 2011;7:393–400. doi: 10.1038/nchembio.562. [DOI] [PubMed] [Google Scholar]
- 20.Zhuang X, Kim H, Pereira MJ, Babcock HP, Walter NG, Chu S. Correlating structural dynamics and function in single ribozyme molecules. Science. 2002;296:1473–1476. doi: 10.1126/science.1069013. [DOI] [PubMed] [Google Scholar]
- 21.Rhodes MM, Reblova K, Sponer J, Walter NG. Trapped water molecules are essential to structural dynamics and function of a ribozyme. Proc. Natl Acad. Sci. USA. 2006;103:13380–13385. doi: 10.1073/pnas.0605090103. [DOI] [PMC free article] [PubMed] [Google Scholar]
- 22.Grünwald D, Singer RH. In vivo imaging of labelled endogenous beta-actin mRNA during nucleocytoplasmic transport. Nature. 2010;467:604–607. doi: 10.1038/nature09438. [DOI] [PMC free article] [PubMed] [Google Scholar]
- 23.Chaulk SG, MacMillan AM. Caged RNA: photo-control of a ribozyme reaction. Nucleic Acids Res. 1998;26:3173–3178. doi: 10.1093/nar/26.13.3173. [DOI] [PMC free article] [PubMed] [Google Scholar]
- 24.Wenter P, Fürtig B, Hainard A, Schwalbe H, Pitsch S. Kinetics of photoinduced RNA refolding by real-time NMR spectroscopy. Angew. Chem. Int. Ed. 2005;44:2600–2603. doi: 10.1002/anie.200462724. [DOI] [PubMed] [Google Scholar]
- 25.Nierth A, Jäschke A. Radioactive phosphorylation of alcohols to monitor biocatalytic Diels-Alder reactions. PLoS ONE. 2011;6:e21391. doi: 10.1371/journal.pone.0021391. [DOI] [PMC free article] [PubMed] [Google Scholar]
- 26.Corrie JET, Reid GP, Trentham DR, Hursthouse MB, Mazid MA. Synthesis and absolute stereochemistry of the two diastereoisomers of P3-1-(2-nitrophenyl)ethyl adenosine triphosphate (‘caged’ ATP) J. Chem. Soc., Perkin Trans. 1992;1:1015–1019. [Google Scholar]
- 27.Höbartner C, Silverman SK. Modulation of RNA tertiary folding by incorporation of caged nucleotides. Angew. Chem. Int. Ed. 2005;44:7305–7309. doi: 10.1002/anie.200502928. [DOI] [PubMed] [Google Scholar]
- 28.Nierth A, Singer M, Jäschke A. Efficient photoactivation of a Diels-Alderase ribozyme. Chem. Commun. 2010;46:7975–7977. doi: 10.1039/c0cc03162c. [DOI] [PubMed] [Google Scholar]
- 29.Hartmann RK, Bindereif A, Schön A, Westhof E. Handbook of RNA Biochemistry. Vol. 1. WILEY-VCH Verlag GmbH & Co. KGaA, Weinheim; 2005. pp. 137–139. [Google Scholar]
- 30.Thomas JR, Liu X, Hergenrother PJ. Biochemical and thermodynamic characterization of compounds that bind to RNA hairpin loops: toward an understanding of selectivity. Biochemistry. 2006;45:10928–10938. doi: 10.1021/bi0607296. [DOI] [PubMed] [Google Scholar]
- 31.Abramoff MD, Magelhaes PJ, Ram SJ. Image Processing with ImageJ. Biophotonics International. 2004;11:36–42. [Google Scholar]
- 32.Blount KF, Wang JX, Lim J, Sudarsan N, Breaker RR. Antibacterial lysine analogs that target lysine riboswitches. Nat. Chem. Biol. 2007;3:44–49. doi: 10.1038/nchembio842. [DOI] [PubMed] [Google Scholar]
- 33.Serganov A, Patel DJ. Amino acid recognition and gene regulation by riboswitches. Biochim. Biophys. Acta. 2009;1789:592–611. doi: 10.1016/j.bbagrm.2009.07.002. [DOI] [PMC free article] [PubMed] [Google Scholar]
- 34.Serganov A, Huang L, Patel DJ. Structural insights into amino acid binding and gene control by a lysine riboswitch. Nature. 2008;455:1263–1267. doi: 10.1038/nature07326. [DOI] [PMC free article] [PubMed] [Google Scholar]
- 35.Sudarsan N, Wickiser JK, Nakamura S, Ebert MS, Breaker RR. An mRNA structure in bacteria that controls gene expression by binding lysine. Genes Dev. 2003;17:2688–2697. doi: 10.1101/gad.1140003. [DOI] [PMC free article] [PubMed] [Google Scholar]
- 36.Seelig B, Jäschke A. A small catalytic RNA motif with Diels-Alderase activity. Chem. Biol. 1999;6:167–176. doi: 10.1016/S1074-5521(99)89008-5. [DOI] [PubMed] [Google Scholar]
- 37.Serganov A, Keiper S, Malinina L, Tereshko V, Skripkin E, Höbartner C, Polonskaia A, Phan AT, Wombacher R, Micura R, et al. Structural basis for Diels-Alder ribozyme-catalyzed carbon-carbon bond formation. Nat. Struct. Mol. Biol. 2005;12:218–224. doi: 10.1038/nsmb906. [DOI] [PMC free article] [PubMed] [Google Scholar]
- 38.Breslow R, Huang DL. Effects of metal ions, including Mg2+ and lanthanides, on the cleavage of ribonucleotides and RNA model compounds. Proc. Natl Acad. Sci. USA. 1991;88:4080–4083. doi: 10.1073/pnas.88.10.4080. [DOI] [PMC free article] [PubMed] [Google Scholar]
- 39.Singer M. Dissertation. Heidelberg University; 2010. Photoregulation of artificial ribozymes. [Google Scholar]
Associated Data
This section collects any data citations, data availability statements, or supplementary materials included in this article.