

Abstract
The highly conserved phosphatase calcineurin plays vital roles in numerous processes including T-cell activation, development and function of the central nervous system, and cardiac growth. It is activated by the calcium sensor calmodulin. Calmodulin binds to a regulatory domain within calcineurin, causing a conformational change that displaces an autoinhibitory domain from the active site, resulting in activation of the phosphatase. This is the same general mechanism by which calmodulin activates calmodulin-dependent protein kinases. Previously published data has hinted that the regulatory domain of calcineurin is intrinsically disordered. In this work we demonstrate that the regulatory domain is unstructured and that it folds upon binding calmodulin, ousting the autoinhibitory domain from the catalytic site. The regulatory domain is 95 residues long, with the autoinhibitory domain attached to its C-terminal end and the 24 residue calmodulin binding region towards the N-terminal end. This is unlike the calmodulin-dependent protein kinases which have calmodulin binding sites and autoinhibitory domains immediately adjacent in sequence. Our data demonstrate that not only does the calmodulin binding region fold, but that an ~25-30 residue region between it and the autoinhibitory domain also folds, resulting in over half of the regulatory domain adopting α-helical structure. This appears to be the first observation of calmodulin inducing folding of this scale outside of its binding site on a target protein.
Introduction
Calcineurin (CaN) is a serine/threonine phosphatase originally identified by Wang and Desai 1, Watterson and Vanaman 2, and Klee and Krinks 3. In response to elevated calcium levels, calmodulin (CaM) binds to CaN leading to its activation. CaN plays essential roles in T cell activation, nervous system development and function, and cardiac growth 4. As a result, dysregulation of CaN has been implicated in a number of disease states including cardiac hypertrophy 5,6, Alzheimer’s disease 7 and Down syndrome 8. CaN is also the target for the immunosuppressant drugs FK506 and cyclosporin A 9. Despite its importance, remarkably little is known regarding the mechanism of CaN’s activation by CaM.
CaN is a heterodimer consisting of an ~60kDa A chain and a 19kDa B chain 10. There are three isoforms of the CaN A chain: the α isoform which is the dominant form in neurons; the broadly-distributed β isoform; and the testis-specific γ isoform 11. The β and γ isoforms differ from the α isoform primarily through N- and C-terminal extensions respectively. The CaN A chain consists of a catalytic domain, B chain binding domain, a 95 residue regulatory domain (RD) including the CaM binding region near its N-terminal end, an autoinhibitory domain (AID), and a short C-terminal domain (CT; Figure 1a). There are two isoforms of the B chain, with isoform 1 being associated with the αA and βA chains. The B chain is homologous to CaM and is known to bind four calcium ions 12.
Figure 1.
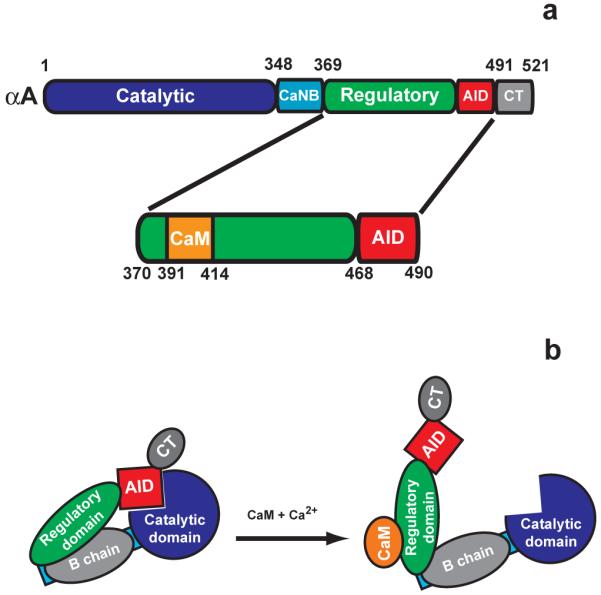
Structure and activation of human αCaN. a. Domain structure of the αCaN A chain highlighting the regulatory domain, with CaM binding region, and autoinhibitory domain. b. Model for CaN activation by CaM.
At low calcium concentrations CaN exists in an inactive state, with its AID bound in the active site cleft. Upon an increase in calcium concentration, CaM binds four calcium ions, resulting in binding to the CaN RD. CaM binding causes release of the AID and activation of the phosphatase (Figure 1b) 13. This mechanism of activation is similar to that observed for the calmodulin-dependent protein kinases, although in the kinases the calmodulin binding site is immediately adjacent in sequence to the autoinhibitory domain 14.
Published data suggest that CaN’s RD is at least partially disordered in the absence of CaM. Manalan and Klee 11 showed that trypsin readily hydrolyzed the RD, implying that it was readily accessible. Further hydrolysis experiments by Yang and Klee 13 confirmed the flexible and accessible nature of the RD. In addition, in the crystal structure of full-length αCaN the AID is seen bound in the active site of the catalytic domain, but electron density for the remainder of the RD, and for the CT, was missing 15. Following up on these observations, Dunker and co-workers noted the potentially disordered nature of the RD in 1997 16.
Recently Shen et al. 17 generated a fragment of αCaN corresponding to the RD, AID and CT that was shown, via Fourier transform infrared spectroscopy (FTIR), to be largely unstructured. Using acrylamide collisional quenching of fluorescence from the four intrinsic tryptophan residues in αCaN, these authors also generated data supporting the earlier findings of Yang and Klee 13 that the CaM binding region of CaN interacts with its B chain binding domain in the absence of calcium and CaM. Shen et al.’s fluorescence experiments also indicated that the CaM-bound RD does not interact with the remainder of αCaN 17.
The limited tryptic digestion experiments of Manalan and Klee 11 suggested that the RD of CaN undergoes a large conformational change upon CaM binding. They found that the RD was protected from trypsin hydrolysis when αCaN was pre-incubated with CaM. What is remarkable about this observation is that the CaM binding region in the RD spans just 24 residues, while the RD is 95 residues in length (Figure 2). Fifty-two residues separate the CaM binding region from the start of the AID, including four potential trypsin cleavage sites. The CaM-induced conformational change likely then involves more of the RD than just the CaM binding region, a hypothesis that is consistent with previous biochemical and biophysical work 11,13,17,18.
Figure 2.
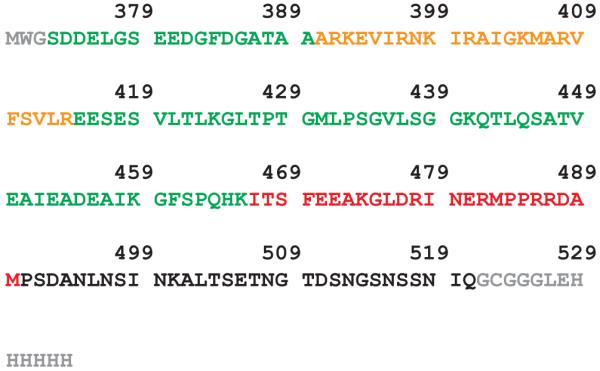
Sequence of the αCaN RD-AID-CT construct used in this work. Residues in gray were added to aid with expression and purification. The RD is denoted by green residues, with the CaM binding region highlighted in orange. The AID sequence is shown in red and the CT in black. Residue numbering is based on that for the full-length αCaNA chain.
In this work we present data from fluorescence experiments demonstrating that the RD does not interact with the remainder of the human αCaN heterodimer when CaM is bound. Using circular dichroism (CD) spectroscopy and hydrogen/deuterium-exchange mass spectrometry (HXMS) we show that a fragment corresponding to the αCaN RD through C-terminus (RD-AID-CT) is completely disordered in solution. With the exception of the AID, this region is also likely to be disordered in full length αCaN in the absence of CaM when the B chain is fully loaded with calcium. Using CD we show that the RD-AID-CT fragment gains substantial α-helix content upon CaM binding. Employing HXMS we demonstrate that the conformational change that occurs upon CaM binding is restricted to the RD and that the AID and CT are not involved. Furthermore, these data identify two regions of the RD that become structured upon the binding of CaM. The most highly protected from exchange is the CaM binding region. The second, less well-protected region is located within an ~35 residue stretch C-terminal to the CaM binding region. These data indicate that CaM induces folding of the RD on a scale that has not previously been observed for CaM binding to a target protein.
Results
The initial evidence for the αCaN RD being disordered and undergoing a conformational change upon CaM binding was a limited tryptic digestion performed by Manalan and Klee 11. We repeated this experiment (Figure S1). In the absence of CaM, the αCaNA chain is partially hydrolyzed, resulting in the appearance of an ~45kD fragment within 5 minutes. The CaNB1 chain is not hydrolyzed by trypsin in the same timeframe. If αCaN is preincubated with an excess of CaM, it is largely protected from digestion (Figure S1).
A PONDR disorder prediction 19 for αCaNA indicates that the RD-AID-CT region is disordered, with the exception of a short region at the junction between the RD and AID (Figure 3). A portion of the catalytic domain is also predicted to be disordered. This region is well-ordered in the αCaN crystal structure, in part packing against the B chain 15, a situation PONDR cannot take into account.
Figure 3.
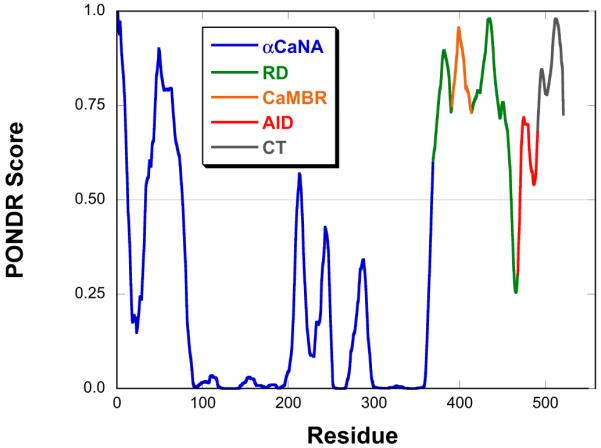
PONDR prediction 19 of αCaNA. The catalytic domain is blue, RD green, CaM binding region orange, AID red and CT dark gray.
The CaM-bound RD, AID and CT do not interact with the remainder of αCaN
In order to study interactions between CaM and an isolated fragment consisting of the RD, AID, and C-terminal domain (RD-AID-CT; Figure 2) we first needed to determine to what extent the CaM-bound αCaN RD interacts with the remainder of the phosphatase. Potential interactions were probed in two ways: fluorescence of tryptophans introduced into solvent-exposed positions on both the A and B chains of full-length αCaN and fluorescence anisotropy of a dye-labeled RD-AID-CT construct interacting with a truncated αCaN.
For the tryptophan fluorescence experiments, solvent-exposed phenylalanine and tyrosine residues in αCaN were identified and mutated individually to tryptophan. This resulted in four mutations: A:Y341W and A:F356W in the A chain, and B:F72W and B:Y106W in the B chain. Note that αCaN possesses four endogenous tryptophans. Fluorescence spectra for wild-type αCaN and each of the four mutants were collected both in the absence and presence of saturating levels of CaM (Figure 4). Although differences in fluorescence intensity were observed, the wavelength of maximal emission did not change upon CaM binding for wild-type or any of the four mutants (Table 1) indicating that none of the introduced, or endogenous, tryptophans experienced changes in solvent accessibility upon complex formation.
Figure 4.

Fluorescence emission spectra for wild type αCaN and four mutants with introduced tryptophan residues in the a. absence and b. presence of CaM.
Table 1.
Fluorescence maximum emission wavelengths (nm) in the absence and presence of CaM for wild type αCaN and the four mutants in which a single tryptophan is introduced into a solvent exposed position.
| -CaM | +CaM | |
|---|---|---|
| WT | 346.5 | 346.0 |
| A:Y341W | 341.5 | 341.0 |
| A:F356W | 345.0 | 345.0 |
| B:F72W | 349.0 | 348.0 |
| B:Y106W | 343.0 | 343.0 |
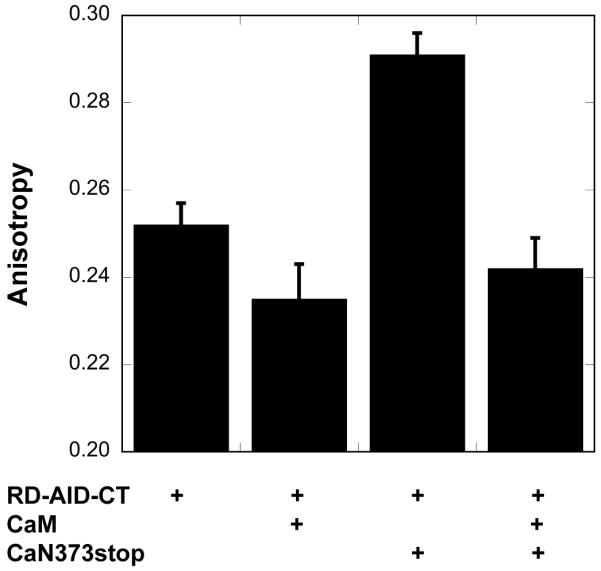
A truncated αCaN (αCaN373stop) was generated by introducing a stop codon immediately following the codon for residue 373. Residue 373 immediately follows the B chain binding domain (Figure 1a) allowing αCaN373stop to bind the B chain. The presence of the B chain, after purification of αCaN373stop, was confirmed by visualization on SDS-PAGE. Following the protocol of Zhao et al. 20, the RD-AID-CT construct was incubated with (Ni2+-NTA)2-Cy3 to generate a fluorescently labeled construct, RD-AID-CT-fl, for use in fluorescence anisotropy experiments. In the absence of CaM, RD-AID-CT-fl binds to αCaN373stop as indicated by an increase in anisotropy (Figure 5). When an excess of CaM is present, the anisotropy decreases to a similar level as that obtained for the CaM-bound RD-AID-CT-fl, suggesting the interaction between the RD-AID-CT-fl and αCaN373stop has been abolished. Notably CaM-bound RD-AID-CT-fl has a similar anisotropy as the isolated RD-AID-CT-fl (Figure 5).
Figure 5.
Fluorescence anisotropy results for a fluorescently labeled RD-AID-CT construct in the presence of a two-fold excess CaM, the truncated αCaN373stop, and both.
The RD-AID-CT undergoes a disorder to order transition upon CaM binding
The secondary structure content of the RD-AID-CT construct in the absence of CaM was examined via CD spectroscopy (Figure 6a). The spectrum obtained is characteristic of an unstructured polypeptide chain. CONTIN/LL analysis 21,22 of the spectrum suggested the presence of predominantly unstructured chain (Table 2). Heating the sample did not result in an observable unfolding (Figure 6a inset), consistent with the interpretation of an unstructured chain. HXMS data for the RD-AID-CT construct in the absence of CaM reinforced this observation (Figures 6b). When corrected for back-exchange these data indicate that essentially all backbone amide protons exchanged for deuterons within five seconds. HXMS data collected in the presence of 4M GdnDCl lend further support to the assertion that the RD-AID-CT is devoid of stable structure (Figure 6b).
Figure 6.

Experimental evidence for the disordered nature of the RD-AID-CT and its acquisition of α-helical structure upon CaM binding. a. CD spectra for the RD-AID-CT, CaM, the CaM:RD-AID-CT complex, and a complex of CaM bound to pCaN (the CaM binding domain from αCaN). b. HXMS data for the intact RD-AID-CT in the absence and presence of CaM. The data shown are from single experiments and are not corrected for back-exchange.
Table 2.
CONTIN/LL 21 analyses of CD spectra for the RD-AID-CT, CaM and CaM:RD-AID-CT complex. Results are expressed as the average number of residues (<Naverage>) in each secondary structure type and are rounded to the nearest whole number.
| <Naverage> | RD-AID-CT | CaM |
CaM + RD-AID-CT |
Net change |
|---|---|---|---|---|
| α-helix | 12 | 103 | 165 | +50 |
| β-strand | 57 | 1 | 29 | − 29 |
| turns | 33 | 16 | 47 | − 2 |
| coil | 63 | 29 | 72 | − 20 |
CaM-mediated ordering is localized to the RD
Trypsin digestion of the RD-AID-CT preincubated with CaM resulted in two fragments of ~13 kDa mass (Figure 7). MALDI-TOF mass spectrometric analysis of these two fragments revealed that both encompassed the entire RD, with one cleaved after the lysine that denotes the end of the RD (K466), and the second having been cleaved after the first lysine within the AID (K474, see Figure 2). We do not observe cleavage following any of the other nine basic residues in the RD. These data indicate that the AID and CT are both readily accessible to trypsin and are likely disordered, but that the RD is protected from hydrolysis in the CaM:RD-AID-CT complex.
Figure 7.
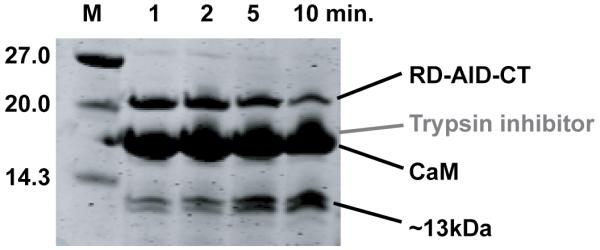
SDS-PAGE gel showing the results of a tryptic digest of the RD-AID-CT construct in the presence of a ten-fold excess of CaM.
The CD spectrum of an equimolar mixture of RD-AID-CT and CaM is indicative of a large increase in α-helix content relative to CaM alone (Figure 6a). An equimolar mixture of CaM and pCaN, a 24 residue peptide corresponding to the CaM-binding region of αCaN, also indicates an increase in α-helix content, but to a lesser extent than the RD-AID-CT:CaM complex (Figure 6a). CONTIN/LL analysis 21,22 of the CaM:RD-AID-CT spectrum suggests that ~50 residues in the RD-AID-CT become α-helical upon CaM binding (Table 2). HXMS data collected for the full-length RD-AID-CT preincubated with a two-fold excess of CaM are shown in Figure 6b. Here, the level of back-exchange (~30%) can be estimated using deuterium uptake by free RD-AID-CT as a totally deuterated sample. At short exchange times, after correction for back exchange, ~50 backbone amides are protected, in good agreement with the CD data. After two hours of exchange approximately 20 residues remain protected. These results indicate that CaM binding induces modest protection in approximately 30 residues and much stronger protection in approximately 20 residues.
Two regions of the RD fold upon CaM binding
To localize secondary structure, the deuterium-labeled RD-AID-CT construct was digested using pepsin after quenching the hydrogen-deuterium exchange reaction. Deuterium incorporation in the resulting peptides was measured by mass spectrometry following a short HPLC separation under quenched conditions 23. Patterns of exchange are shown in a HXMS heat map (Figure 8). Deuterium uptake curves for the individual peptide fragments are shown in Figure S2. All backbone amides in the RD-AID-CT construct in the absence of CaM exchange within five seconds. When preincubated with a two-fold excess of CaM, the RD-AID-CT exchange patterns are quite different. The CaM-binding region is very highly protected, with significant protection levels even after 24 hours of exposure to D2O. One other region of protection is observed: an ~35 residue region C-terminal to the CaM-binding region. Note that not all residues in this region are protected from exchange - the resolution is limited by the lack of overlapping pepsin fragments generated in this region. Both regions of protection are within the regulatory domain (RD), in very good agreement with MALDI-TOF analysis of the limited trypsin digestion data (Figure 7). Combining the CD, HXMS and proteolysis data, it would appear that a large fraction of the RD becomes ordered, largely α-helical, upon CaM binding.
Figure 8.

HXMS heat map for the RD-AID-CT in the absence and presence of a two-fold excess of CaM. Structure of the RD-AID-CT construct is shown at top for reference. The map was constructed using a minimal set of ten non-overlapping peptides for which complete duplicate data were available. See Figure S2 for complete deuterium uptake kinetics for all RD-AID-CT peptides.
Discussion
The limited tryptic digestion data of Manalan and Klee 11 suggested that the RD of αCaN was at least partially disordered in the absence of CaM, and that it became ordered upon CaM binding. Hubbard and Klee 24 used limited clostripain digestion to map out the domain structure of the αCaN A chain, this data also hinted at the disordered nature of the RD. Our limited tryptic digest data on full-length αCaN (Figure S1) is in good agreement with these earlier studies. The first crystal structures of full-length CaN were solved by Kissinger et al. 15. In these structures, the electron density for the RD and CT was missing, indicating these domains were mobile in the crystals and again hinting at disorder. Further evidence for disorder comes from a PONDR prediction 19 for the αCaN A chain (Figure 3). Our CD and HXMS data for the isolated RD-AID-CT construct (Figure 6) support the hypothesis that the RD is disordered in the absence of CaM. All backbone amide protons in the RD-AID-CT construct exchange with deuterons within five seconds indicating a lack of detectable stable secondary structure. The FTIR data of Shen et al. 17 for a similar fragment of αCaN also indicates that this region is disordered in the absence of CaM.
It was important to determine whether the binding of CaM to the RD-AID-CT construct resulted in interactions between this complex and the remainder of αCaN. Shen et al. 17 measured acrylamide quenching of the fluorescence of αCaN’s four intrinsic tryptophans. They concluded that the solvent accessibility is unchanged for the tryptophans upon CaM binding. In this work we took two approaches. In the first approach, we substituted four solvent-exposed aromatic residues with tryptophan and determined the effects of CaM binding upon their fluorescence emission. Although some changes in emission intensity were observed (Figure 4), most notably for the B:F72W mutant, the wavelength of maximum emission did not change for any of these mutants upon the binding of CaM (Table 1). These data indicate that none of the introduced tryptophans are buried when CaM binds to the RD.
In the second approach, fluorescently labeled RD-AID-CT was used in anisotropy measurements. In the absence of CaM, RD-AID-CT-fl binds to the truncated αCaN373stop (Figure 5). In the presence of an excess of CaM, the observed anisotropy is reduced to that of the CaM:RD-AID-CT-fl complex. These data indicate that binding of RD-AID-CT-fl to αCaN373stop is abolished when CaM binds to the RD. We hypothesize that the observed binding of RD-AID-CT-fl to αCaN373stop in the absence of CaM is due to the AID binding within the active site of αCaN373stop’s active site. Soderling and co-workers 25,26 have shown that a peptide corresponding to the AID can bind to and inhibit CaN, lending support to this hypothesis. All of our experiments were performed in the presence of an excess of calcium, precluding interactions between the CaM binding region and the B chain binding domain 13.
It is notable that the anisotropy measured for the CaM:RD-AID-CT-fl complex is very similar to that for the RD-AID-CT-fl construct alone (Figure 5). Anisotropy is a function of both the rotational diffusion of the molecule or complex, and the flexibility of the chain to which the fluorophore is attached 27. The (Ni2+-NTA)2-Cy3 fluorophore is bound to the His6-tag located at the C-terminus of RD-AID-CT (Figure 2). Our CD and HXMS experiments (Figures 6 and 8) indicate that when CaM binds to RD-AID-CT, the AID and CT remain disordered. Therefore, the (Ni2+-NTA)2-Cy3 fluorophore is attached to a long stretch of disordered chain whose flexibility is unaffected by CaM binding, providing an explanation for why no significant change in anisotropy is observed. In contrast, when the RD-AID-CT-fl construct interacts with CaN373stop, it likely does so via binding of the AID into the CaN active site cleft 18, leading to structuring of the AID 15 and subsequent reduction in flexibility of the chain to which the fluorophore is linked, leading to an increase in anisotropy.
Notably, when CaM binds to the RD-AID-CT construct there is a conformational change that precludes binding to αCaN373stop via the AID. This conformational change appears to be a large scale folding of the RD, with subsequent gain in α-helix content (Figure 6a and Table 2). Trypsin digestion and HXMS data suggest that the AID and CT are disordered (Figures 7 and 8). Perrino 18 demonstrated that a construct similar to our RD-AID-CT inhibits CaN activity and that inhibition is relieved by addition of CaM. A model that explains all of these data would have the C-terminal region of the RD folded in the CaM:RD complex, preventing interactions between the AID and the active site via steric hindrance.
There is remarkably good agreement between the CD estimate of ~50 residues becoming ordered (Figure 6a and Table 2) and early time points in the HXMS on the intact CaM:RD-AID-CT complex (Figure 6b). From the heat map (Figure 8) and peptide exchange uptake curves (Figure S2) generated after pepsin digestion of the exchanged RD-AID-CT it is clear there are two regions of protection within the RD. The CaM binding region is very well-protected from exchange, as might be expected given CaM binds this region with a Kd in the picomolar range 28,29. The second region of protection is C-terminal to the CaM binding region (Figure 8). This region is less well-protected, explaining the decrease in protection with time illustrated in Figure 6b. Later time points in the HXMS data on the intact CaM:RD-AID-CT complex (Figure 6b and Figure S2) could be interpreted as indicating this latter protected region has a significant fraction of its ensemble unstructured. This would be at odds with the CD data (Figure 6a and Table 2). If the region of lower protection were unfolded a significant fraction of time, ensemble-averaged CD data should give lower estimates of the number of residues in the α-helical conformation. However, as noted by Henkels and Oas 30 and Keppel et al. 31, the kinetics of hydrogen-deuterium exchange can be dominated by unprotected states with small Boltzmann weights when the inter-conversion between protected and unprotected conformers is rapid relative to the hydrogen-deuterium exchange time-scale. If this is the case for the protected region C-terminal to the CaM binding region, then there is no disagreement between the CD and HXMS data.
Perrino 18 has shown that the thirty-eight residue region of the RD immediately N-terminal to the AID plays a role in the autoinhibition of CaN. Soderling and co-workers 25 had shown earlier that deletion of the AID, but not the RD, leads to only partial activation of CaN. Full activation is achieved in the absence of CaM only when both the AID and the thirty-eight residues preceding it were deleted. This suggests there is an interaction between the chain immediately preceding the AID and the remainder of CaN, but this is likely not a stable interaction given the ease with which the RD can be proteolytically digested (Figure S1) 11,24. This second autoinhibitory region overlaps with the region of lower protection observed in the HXMS data for the CaM-bound RD-AID-CT (Figure 8). The region of limited exchange protection appears to be part of the large scale folding of the CaM-bound RD, further explaining how this folding leads to CaN activation.
Our data lead us to propose the following model for αCaN activation by CaM. In the absence of CaM, the AID is ordered and bound within the active site cleft of αCaN, while the RD and CT are largely disordered. In the absence of calcium, the CaM binding region 13 and putative second autoinhibitory region 18 may be in contact with the B chain and its binding domain. Upon an increase in calcium concentration and subsequent CaM binding, the RD folds, gaining significant α-helical structure in the CaM binding and second autoinhibitory regions. This folding event provides the driving force that pulls the AID from the active site. In the CaM-bound state the released AID and CT are largely disordered.
Coupled binding and folding, such as that described by our model, is thought to be a common feature of disordered regions in proteins 32,33. This is the mechanism by which CaM appears to activate calmodulin-dependent protein kinases 14, suggesting that coupled folding and binding might be a general mechanism by which CaM activates its target enzymes. Dunker and colleagues have recently shown that CaM binding sites are typically within disordered regions in proteins 34, lending support to this idea. The major difference between the kinases and CaN is that the CaM binding sites and AID’s in the kinases are immediately adjacent in sequence, whereas there are 52 residues between the CaM binding region and the AID in CaN (Figure 2). Our data point to a large scale folding of the CaN RD, with ~50 residues adopting α-helical structure, only 24 residues of which are in the CaM binding region. We believe this is the first observation of CaM inducing folding of this scale outside of its binding site on a target protein.
Materials and Methods
Proteins, peptide and buffer
The plasmid pETagHisCN, containing the human αCaNA (with N-terminal His6 tag) and B1 genes, together forming αCaN, was obtained from Addgene (Cambridge, MA). This was transformed into E. coli BL21 (DE3) CodonPlus RIL cells (Agilent Technologies, La Jolla, CA) for expression. αCaN was purified on a Ni-NTA column followed by a CaM-sepharose column (GE Healthcare, Piscataway, NJ). αCaN mutants were generated using the Stratagene QuikChange II Site-Directed Mutagenesis kit (Agilent Technologies, La Jolla, CA). An E. coli-codon optimized gene for the human sequence RD-AID-CT construct was synthesized by Genscript (Piscataway, NJ). This was cloned into the pET303/CT-His vector which adds a C-terminal His6 tag (Invitrogen, Carlsbad, CA) for expression in E. coli BL21 (DE3). After expression, the RD-AID-CT was purified on a Ni-NTA column followed by a CaM-sepharose column. Human CaM was expressed from the pETCaMI vector and purified on a 2-trifluoromethyl-10-aminopropyl phenothiazine-sepharose (TAPP-sepharose) column 35. The TAPP-sepharose was synthesized at the University of Kentucky, Center for Structural Biology Chemistry Core Facility (supported in part by funds from NIH National Center for Research Resources (NCRR) grant P20 RR020171). All expressed proteins had their identities confirmed via mass spectrometry. Protein concentrations were determined using the bicinchoninic acid (BCA) assay 36.
The pCaN peptide (sequence ARKEVIRNKIRAIGKMARVFSVLR) corresponding to the CaM binding region in the RD of αCaN, was purchased from Genscript (Piscataway, NJ). This was purified using reverse-phase HPLC and its identity confirmed using mass spectrometry.
All experiments were conducted using a buffer consisting of 20mM Tris, 200mM NaCl, 2mM CaCl2 at a pH of 7.5. All reagents used for this buffer were obtained from Sigma (St. Louis, MO) and were of the highest purity.
Limited proteolytic digests
Tryptic digests were performed by adding sequencing-grade trypsin (Promega, WI) to protein solutions. A ratio of 1:200 trypsin to protein was utilized. Aliquots were removed at various time-points and hydrolysis quenched by the addition of excess soybean trypsin inhibitor (Sigma-Aldrich, St. Louis, MO). Resulting digests were run out on SDS-PAGE gels and visualized using Coomassie blue staining. Bands on the gels were excised and analyzed using MALDI-TOF mass spectrometry at the University of Kentucky Center for Structural Biology Proteomics Core.
Fluorescence
Fluorescence spectra were collected on a Perkin-Elmer LS55 steady-state fluorimeter using 1cm pathlength cuvettes. Proteins were at a concentration of 1μM for all tryptophan fluorescence experiments. Samples were excited at 290nm and spectra were collected from 305nm to 430nm with excitation and emission bandwidths of 10nm.
For fluorescence anisotropy experiments Cy3 was coupled to the RD-AID-CT construct via the His6-tag on the protein. To do this, Cy3 was covalently linked to nickel(II)-nitrilotriacetic acid (Ni2+-NTA) to form (Ni2+-NTA)2-Cy3 using the protocol of Zhao et al. 20. Cy3 was obtained from GE Healthcare (Piscataway, NJ) and all other required reagents, including Nα,Nα-bis(carboxymethyl)-L-lysine hydrate for (Ni2+-NTA) synthesis, from Sigma (St. Louis, MO). (Ni2+-NTA)2-Cy3 was coupled to RD-AID-CT by mixing a two-fold of excess of the fluorophore with protein and incubating at 4°C with shaking for three hours. Uncoupled (Ni2+-NTA)2-Cy3 was separated from labeled protein, RD-AID-CT-fl, on a 10ml, 1cm diameter G-10 Sephadex column. Anisotropy measurements were made using a 1cm cuvette and samples with a Cy3 concentration of 0.5 μM (total RD-AID-CT concentration of 1.5 μM) and a two-fold excess of CaN373stop and CaM over RD-AID-CT-fl when added. Excitation was performed at a wavelength of 550nm and emission monitored at 570nm. Excitation and emission bandwidths were both set to 5nm.
Circular dichroism
Circular dichroism (CD) spectra were collected using a Jasco J-810 spectropolarimeter equipped with a Peltier heating block. Samples containing 10μM protein were placed in a 1mm pathlength cuvette, with reported spectra being the average of four scans at a scan speed of 50nm/min and a temperature of 20°C. Errors are estimated to be no more than 3%. Secondary structure content was estimated from the CD spectra using the CONTIN/LL deconvolution program 21,22. The thermal melt of the RD-AID-CT construct was conducted with a heating rate of 1°C.min.−1 and was monitored at a wavelength of 222nm.
Hydrogen/deuterium-exchange mass spectrometry (HXMS)
Materials
Buffers were prepared using tris, HCl, NaCl, NaOH obtained from Fisher Scientific (Hanover Park, IL), and CaCl2 from Sigma (St Louis, MO). HPLC solvents were prepared using Optima LC/MS grade acetonitrile and water from Fisher Scientific (Fair Lawn, NJ) and 99+% formic acid from Thermo Scientific (Rockford, IL).
Preparation of RD-AID-CT Peptic Peptides
RD-AID-CT peptic peptides were prepared by diluting 200μL RD-AID-CT stock (20.3μM) to 500μL in 0.1% formic acid. The solution was passed through the immobilized pepsin column in a 4°C refrigerator using a syringe pump at 50μL.min.−1 The first 100μL of eluent was discarded, and then the rest was collected along with a 150μL 0.1% formic acid after-wash. 100μL aliquots of digested peptide solution were frozen on liquid nitrogen and stored at −80°C. These peptides were used to prepare totally deuterated RD-AID-CT and to confirm peptide assignments.
Hydrogen/Deuterium Exchange
For intact hydrogen-deuterium exchange, 6.7μL aliquots containing RD-AID-CT at 9μM and CaM at 18μM (or an equivalent volume of buffer) were held at 4°C for one hour. Following incubation, individual aliquots were diluted 20-fold with D2O buffer (20mM Tris/200mM NaCl/10mM CaCl2, pD 7.51). Exchange proceeded for between 5 sec and 2 hours at 4°C in a thermostated block (IC20 Ecotherm Heating/Chilling Plate, Torrey Pines Scientific, La Jolla, CA). Totally deuterated RD-AID-CT was prepared by diluting the sample 20-fold with 4M GdnDCl, exchanged for two hours at room temperature. 4 M GdnDl was prepared by several rounds of dissolution/lyophilization of GdnHCl in D2O. The exchange reactions were quenched by 1:1 dilution with 200mM 4 °C sodium phosphate buffer (pH 2.6). Samples were immediately flash-frozen on liquid nitrogen and held at −80°C.
For peptide-level hydrogen-deuterium exchange, RD-AID-CT (9μM) was incubated with a two-fold molar excess of CaM (18μM) or an equal volume of H2O buffer (20mM Tris/200mM NaCl/10mM CaCl2, pH 7.51) for at least one hour at 25°C. Aliquots (5.7μL, containing 50pmol of RD-AID-CT) were diluted 20-fold with D2O buffer (20mM Tris/200mM NaCl/10 mM CaCl2, pD 7.51). Samples were labeled for between 5 seconds and 24 hours at 25°C. After labeling, the samples were quenched to a pH of 2.4 by addition of 0.1M HCl (6.8μL), frozen on liquid nitrogen, and stored on dry ice at −80°C. Undeuterated samples were prepared similarly and diluted 20-fold with H2O buffer instead of D2O buffer. Totally deuterated samples were prepared from RD-AID-CT peptic peptides, deuterated and quenched, then stored as described above. Peptide-level measurements were completed in duplicate.
LC/MS Analysis
All LC/MS analysis was carried out using a custom refrigerated LC system described previously 23. Individual samples were thawed by hand immediately prior to loading onto the LC system. Intact deuterated samples were desalted on a reversed-phase trap (Jupiter C4, Phenomenex, Torrance, CA, self-packed 1×10 mm cartridge) for 3 min using 200μL.min.−1 of 0.1% formic acid followed by elution using the following gradient: 20% B (0-3 min), 30% B (3.5 min), 45% B (6 min), 95% B (7 min), 95% B (8 min), 20% B (9 min). Here A was 0.1% formic acid and B was acetonitrile/water/formic acid (90%/10%/0.1%).
Peptide level samples, were digested online at 200μL.min.−1 with 0.1% formic acid as the carrier using pepsin (from porcine gastric mucosa, Sigma, St. Louis, MO) immobilized on POROS 20AL (Applied Biosystems, Carlsbad, CA) 37,38 packed in a 2.1×50 mm stainless steel column. The resulting peptides were trapped and desalted on a reversed-phase trap (1×10 mm self-packed with Jupiter Proteo C12 media obtained from Phenomenex, Torrance, CA) over 4 minutes. The peptides were eluted from the trap and separated using a Zorbax 300SB-C18, 1×50 mm column (Agilent Technologies, Santa Clara, CA). The elution gradient, with solvents A (0.1% formic acid) and B (90:10:0.1% acetonitrile:water:formic acid), was programed as follows: 4 min at 10% B, 10-20% B over 30 secs, 20-40% B over 5 min, 40% B for 30 secs, 40-95% B over 1.5 min, hold at 95% B for 1 min, then brought back down to 10% B over 30 s.
Masses of deuterated samples were measured using a time of flight mass analyzer with an electrospray ionization source (model 6220, Agilent Technologies, Santa Clara, CA). All mass spectra were collected in positive ESI mode, in the 2GHz Extended dynamic range with a capillary voltage of 4000V, drying gas flow of 10L.min.−1 and temperature of 325°C. The fragmentor was set to 200V for intact protein measurements and 150V for peptides. Mass spectra were acquired using Agilent MassHunter Acquisition and analyzed using Agilent MassHunter Qualitative Analysis software (Versions B.03.01 & B.04.00). The extent of deuteration (as a percentage of the exchangeable amides) was calculated with back-exchange corrections as previously described by Zhang and Smith 39. Here, the number of exchangeable amides accounts for all non-proline residues from the third residue to the C-terminus of the peptide. In cases where totally deuterated peptides were not detected (see Figure S2), the average deuterium uptake by free RD-AID-CT was used instead of the totally deuterated sample.
Confirmation of Peptide Identities
RD-AID-CT peptic peptides were injected onto the C12 trapping column by isocratic flow as described above (without passing through a pepsin column). For optimum chromatographic separation, a long gradient run was set up as follows: 10% B for 4 min, 10-45% B over 41 min, 45% B for 5 min, ramp up 45-95% B over 5 min, 95% B for 5 min, down to 10% B over 2 min. Identities were confirmed by accurate mass measurements using internal mass correction in 4GHz high resolution mode. Peptides that could not be definitively assigned on the basis of accurate mass alone (within a 10ppm mass window) were assigned on the basis of their CID fragmentation using MSE and MS/MS. Identity confirmation experiments were performed on a Synapt G2 QTOF MS with a NanoAcquity UPLC (Waters, Millford, MA) with an ESI source, at the Structural Biology Center (University of Kansas). Peptides were separated through a Zorbax 300SB-C18, 0.3×50mm, 3.5μm, 300Å analytical column (Agilent Technologies, Santa Clara, CA) at a flow rate of 10μL.min.−1 The gradient, for solvents A (99:1:0.08% water:acetonitrile:formic acid) and B (80:10:10:0.06% acetonitrile:isopropanol:water:formic acid), was set up as follows: 1-10% B over 1 min, 10-30% B over 34 min, ramped up to 80% B in 1 min and returned to 1.0% B in 1 min. Fragmentation was performed in MSE mode using low (30V) and high (50V) collision energies and in data-dependent acquisition mode using mass/charge-dependent collision energies. In MS/MS mode, individually-optimized collision energies were used. Mass spectra were analyzed for expected a/b/y ion fragments, corresponding neutral losses and immonium ions using MassLynx (V4.1) software. Ambiguous (isobaric) peptide assignments are listed in Table S1.
Supplementary Material
Acknowledgements
The authors would like to thank Professor Anthony Persechini of the University of Missouri at Kansas City for providing the pETCaMI expression vector. This work was supported by grants to T.P.C. from the N.S.F. (MCB-0843551) and the Kentucky Science and Engineering Foundation (KSEF-148-502-08-227), to F.I.R. from the University of Kansas Graduate Research Fund, and in part by funds from NIH National Center for Research Resources (NCRR) grant P20 RR020171 (PI: Professor Louis B. Hersh).
Abbreviations
- CaN
calcineurin
- CaM
calmodulin
- RD
regulatory domain
- AID
autoinhibitory domain
- CT
C-terminal domain
- FTIR
Fourier transform infrared spectroscopy
- CD
circular dichroism
- HXMS
hydrogen-deuterium exchange mass spectrometry
Footnotes
Publisher's Disclaimer: This is a PDF file of an unedited manuscript that has been accepted for publication. As a service to our customers we are providing this early version of the manuscript. The manuscript will undergo copyediting, typesetting, and review of the resulting proof before it is published in its final citable form. Please note that during the production process errorsmaybe discovered which could affect the content, and all legal disclaimers that apply to the journal pertain.
Bibliography
- 1.Wang JH, Desai R. A brain protein and its effect on the Ca2+-and protein modulator-activated cyclic nucleotide phosphodiesterase. Biochem Biophys Res Commun. 1976;72:926–932. doi: 10.1016/s0006-291x(76)80220-3. [DOI] [PubMed] [Google Scholar]
- 2.Watterson DM, Vanaman TC. Affinity chromatography purification of a cyclic nucleotide phosphodiesterase using immobilized modulator protein, a troponin C-like protein from brain. Biochem Biophys Res Commun. 1976;73:40–46. doi: 10.1016/0006-291x(76)90494-0. [DOI] [PubMed] [Google Scholar]
- 3.Klee CB, Krinks MH. Purification of cyclic 3“,5-”nucleotide phosphodiesterase inhibitory protein by affinity chromatography on activator protein coupled to Sepharose. Biochemistry. 1978;17:120–126. doi: 10.1021/bi00594a017. [DOI] [PubMed] [Google Scholar]
- 4.Rusnak F, Mertz P. Calcineurin: form and function. Physiol Rev. 2000;80:1483–1521. doi: 10.1152/physrev.2000.80.4.1483. [DOI] [PubMed] [Google Scholar]
- 5.Chakraborti S, Das S, Kar P, Ghosh B, Samanta K, Kolley S, Ghosh S, Roy S, Chakraborti T. Calcium signaling phenomena in heart diseases: a perspective. Mol Cell Biochem. 2007;298:1–40. doi: 10.1007/s11010-006-9355-8. [DOI] [PubMed] [Google Scholar]
- 6.Vega RB, Bassel-Duby R, Olson EN. Control of cardiac growth and function by calcineurin signaling. J Biol Chem. 2003;278:36981–36984. doi: 10.1074/jbc.R300023200. [DOI] [PubMed] [Google Scholar]
- 7.Ermak G, Morgan TE, Davies KJ. Chronic overexpression of the calcineurin inhibitory gene DSCR1 (Adapt78) is associated with Alzheimer’s disease. J Biol Chem. 2001;276:38787–38794. doi: 10.1074/jbc.M102829200. [DOI] [PubMed] [Google Scholar]
- 8.Hoeffer CA, Dey A, Sachan N, Wong H, Patterson RJ, Shelton JM, Richardson JA, Klann E, Rothermel BA. The Down syndrome critical region protein RCAN1 regulates long-term potentiation and memory via inhibition of phosphatase signaling. J Neurosci. 2007;27:13161–13172. doi: 10.1523/JNEUROSCI.3974-07.2007. [DOI] [PMC free article] [PubMed] [Google Scholar]
- 9.Wang P, Heitman J. The cyclophilins. Genome Biol. 2005;6:226. doi: 10.1186/gb-2005-6-7-226. [DOI] [PMC free article] [PubMed] [Google Scholar]
- 10.Klee CB, Ren H, Wang X. Regulation of the calmodulin-stimulated protein phosphatase, calcineurin. J Biol Chem. 1998;273:13367–13370. doi: 10.1074/jbc.273.22.13367. [DOI] [PubMed] [Google Scholar]
- 11.Manalan AS, Klee CB. Activation of calcineurin by limited proteolysis. Proc Natl Acad Sci USA. 1983;80:4291–4295. doi: 10.1073/pnas.80.14.4291. [DOI] [PMC free article] [PubMed] [Google Scholar]
- 12.Stemmer PM, Klee CB. Dual calcium ion regulation of calcineurin by calmodulin and calcineurin B. Biochemistry. 1994;33:6859–6866. doi: 10.1021/bi00188a015. [DOI] [PubMed] [Google Scholar]
- 13.Yang SA, Klee CB. Low affinity Ca2+-binding sites of calcineurin B mediate conformational changes in calcineurin A. Biochemistry. 2000;39:16147–16154. doi: 10.1021/bi001321q. [DOI] [PubMed] [Google Scholar]
- 14.Swulius MT, Waxham MN. Ca(2+)/calmodulin-dependent protein kinases. Cell Mol Life Sci. 2008;65:2637–2657. doi: 10.1007/s00018-008-8086-2. [DOI] [PMC free article] [PubMed] [Google Scholar]
- 15.Kissinger CR, Parge HE, Knighton DR, Lewis CT, Pelletier LA, Tempczyk A, Kalish VJ, Tucker KD, Showalter RE, Moomaw EW. Crystal structures of human calcineurin and the human FKBP12-FK506-calcineurin complex. Nature. 1995;378:641–644. doi: 10.1038/378641a0. [DOI] [PubMed] [Google Scholar]
- 16.Romero, Obradovic, Dunker K. Sequence Data Analysis for Long Disordered Regions Prediction in the Calcineurin Family. Genome informatics Workshop on Genome Informatics. 1997;8:110–124. [PubMed] [Google Scholar]
- 17.Shen X, Li H, Ou Y, Tao W, Dong A, Kong J, Ji C, Yu S. The secondary structure of calcineurin regulatory region and conformational change induced by calcium/calmodulin binding. J Biol Chem. 2008;283:11407–11413. doi: 10.1074/jbc.M708513200. [DOI] [PubMed] [Google Scholar]
- 18.Perrino BA. Regulation of calcineurin phosphatase activity by its autoinhibitory domain. Arch Biochem Biophys. 1999;372:159–165. doi: 10.1006/abbi.1999.1485. [DOI] [PubMed] [Google Scholar]
- 19.Dunker AK, Lawson JD, Brown CJ, Williams RM, Romero P, Oh JS, Oldfield CJ, Campen AM, Ratliff CM, Hipps KW, Ausio J, Nissen MS, Reeves R, Kang C, Kissinger CR, Bailey RW, Griswold MD, Chiu W, Garner EC, Obradovic Z. Intrinsically disordered protein. J Mol Graph Model. 2001;19:26–59. doi: 10.1016/s1093-3263(00)00138-8. [DOI] [PubMed] [Google Scholar]
- 20.Zhao C, Hellman LM, Zhan X, Bowman WS, Whiteheart SW, Fried MG. Hexahistidine-tag-specific optical probes for analyses of proteins and their interactions. Anal Biochem. 2010;399:237–245. doi: 10.1016/j.ab.2009.12.028. [DOI] [PMC free article] [PubMed] [Google Scholar]
- 21.Provencher SW, Glöckner J. Estimation of globular protein secondary structure from circular dichroism. Biochemistry. 1981;20:33–37. doi: 10.1021/bi00504a006. [DOI] [PubMed] [Google Scholar]
- 22.Sreerama N. Estimation of Protein Secondary Structure from Circular Dichroism Spectra: Comparison of CONTIN, SELCON, and CDSSTR Methods with an Expanded Reference Set. Anal Biochem. 2000;287:252–260. doi: 10.1006/abio.2000.4880. [DOI] [PubMed] [Google Scholar]
- 23.Keppel TR, Jacques ME, Young RW, Ratzlaff KL, Weis DD. An efficient and inexpensive refrigerated LC system for H/D exchange mass spectrometry. J Am Soc Mass Spectrom. 2011;22:1472–1476. doi: 10.1007/s13361-011-0152-6. [DOI] [PubMed] [Google Scholar]
- 24.Hubbard MJ, Klee CB. Functional domain structure of calcineurin A: mapping by limited proteolysis. Biochemistry. 1989;28:1868–1874. doi: 10.1021/bi00430a066. [DOI] [PubMed] [Google Scholar]
- 25.Perrino BA, Ng LY, Soderling TR. Calcium regulation of calcineurin phosphatase activity by its B subunit and calmodulin. Role of the autoinhibitory domain. J Biol Chem. 1995;270:340–346. doi: 10.1074/jbc.270.1.340. [DOI] [PubMed] [Google Scholar]
- 26.Hashimoto Y, Perrino BA, Soderling TR. Identification of an autoinhibitory domain in calcineurin. J Biol Chem. 1990;265:1924–1927. [PubMed] [Google Scholar]
- 27.Lakowicz JR. Principles of fluorescence spectroscopy. Springer Verlag: 2006. p. 954. [Google Scholar]
- 28.Quintana AR, Wang D, Forbes JE, Neal Waxham M. Kinetics of calmodulin binding to calcineurin. Biochem Biophys Res Commun. 2005;334:674–680. doi: 10.1016/j.bbrc.2005.06.152. [DOI] [PubMed] [Google Scholar]
- 29.O’Donnell S, Yu L, Fowler CA, Shea MA. Recognition of β-calcineurin by the domains of calmodulin: Thermodynamic and structural evidence for distinct roles. Proteins. 2011;79:765–786. doi: 10.1002/prot.22917. [DOI] [PMC free article] [PubMed] [Google Scholar]
- 30.Henkels CH, Oas TG. Ligation-state hydrogen exchange: coupled binding and folding equilibria in ribonuclease P protein. J Am Chem Soc. 2006;128:7772–7781. doi: 10.1021/ja057279+. [DOI] [PubMed] [Google Scholar]
- 31.Keppel TR, Howard BA, Weis DD. Mapping unstructured regions and synergistic folding in intrinsically disordered proteins with amide H/D exchange mass spectrometry. Biochemistry. 2011 doi: 10.1021/bi200875p. [DOI] [PubMed] [Google Scholar]
- 32.Radivojac P, Iakoucheva LM, Oldfield CJ, Obradovic Z, Uversky VN, Dunker AK. Intrinsic disorder and functional proteomics. Biophysical Journal. 2007;92:1439–1456. doi: 10.1529/biophysj.106.094045. [DOI] [PMC free article] [PubMed] [Google Scholar]
- 33.Dyson HJ, Wright PE. Coupling of folding and binding for unstructured proteins. Curr Opin Struct Biol. 2002;12:54–60. doi: 10.1016/s0959-440x(02)00289-0. [DOI] [PubMed] [Google Scholar]
- 34.Radivojac P, Vucetic S, O’connor TR, Uversky VN, Obradovic Z, Dunker AK. Calmodulin signaling: analysis and prediction of a disorder-dependent molecular recognition. Proteins. 2006;63:398–410. doi: 10.1002/prot.20873. [DOI] [PubMed] [Google Scholar]
- 35.Charbonneau H, Hice R, Hart RC, Cormier MJ. Purification of calmodulin by Ca2+-dependent affinity chromatography. Meth Enzymol. 1983;102:17–39. doi: 10.1016/s0076-6879(83)02005-4. [DOI] [PubMed] [Google Scholar]
- 36.Smith PK, Krohn RI, Hermanson GT, Mallia AK, Gartner FH, Provenzano MD, Fujimoto EK, Goeke NM, Olson BJ, Klenk DC. Measurement of protein using bicinchoninic acid. Anal Biochem. 1985;150:76–85. doi: 10.1016/0003-2697(85)90442-7. [DOI] [PubMed] [Google Scholar]
- 37.Wang L, Pan H, Smith DL. Hydrogen exchange-mass spectrometry: optimization of digestion conditions. Mol Cell Proteomics. 2002;1:132–138. doi: 10.1074/mcp.m100009-mcp200. [DOI] [PubMed] [Google Scholar]
- 38.Busby SA, Chalmers MJ, Griffin PR. Improving digestion efficiency under H/D exchange conditions with activated pepsinogen coupled columns. Int J Mass Spectrom. 2007;259:130–139. [Google Scholar]
- 39.Zhang Z, Smith DL. Determination of amide hydrogen exchange by mass spectrometry: A new tool for protein structure elucidation. Protein Sci. 1993;2:522–531. doi: 10.1002/pro.5560020404. [DOI] [PMC free article] [PubMed] [Google Scholar]
Associated Data
This section collects any data citations, data availability statements, or supplementary materials included in this article.