Abstract
A general introduction of this article is as follows: Reliable and timely health information is an essential foundation of public health action and health systems strengthening, both nationally and internationally (Aqil et al. in Health Policy Plan 24(3): 217–228, 2009; Bradshaw et al. in initial burden of disease estimates for South Africa, 2000. South African Medical Research Council, Cape Town, 2003). The need for sound information is especially urgent in the case of emergent diseases and other acute health threats, where rapid awareness, investigation and response can save lives and prevent broader national outbreaks and even global pandemics (Aqil et al. in Health Policy Plan 24(3): 217–228, 2009). The government of Kenya, through the ministry of public health and sanitation has rolled out the community health strategy as a way of improving health care at the household level. This involves community health workers collecting health status data at the household level, which is then used for dialogue at all the levels to inform decisions and actions towards improvement in health status. A lot of health interventions have involved the community health workers in reaching out to the community, hence successfully implementing these health interventions. Large scale involvement of community health workers in government initiatives and most especially to collect health data for use in the health systems has been minimal due to the assumption that the data may not be useful to the government, because its quality is uncertain. It was therefore necessary that the validity and reliability of the data collected by community health workers be determined, and whether this kind of data can be used for planning and policy formulation for the communities from which it is collected. This would go a long way to settle speculation on whether the data collected by these workers is valid and reliable for use in determining the health status, its causes and distribution, of a community. Our general objective of this article is to investigate the validity and reliability of Community Based Information, and we deal with research question “What is the reliability of data collected at the Community level by Community health workers?”. The methods which we use to find an reliable answer to this question is “Ten percent of all households visited by CHWs for data collection were recollected by a technically trained team. Test/retest method was applied to the data to establish reliability. The Kappa score, sensitivity, specificity and positive predictive values were also used to measure reliability”. Finally our findings are as follows: Latrine availability and Antenatal care presented good correspondence between the two sets of data. This was also true for exclusive breast feeding indicator. Measles immunization coverage showed less consistency than the rest of the child health indicators. At last we conclude and recommend that CHWs can accurately and reliably collect household data which can be used for health decisions and actions especially in resource poor settings where other approaches to population based data are too expensive.
Keywords: Reliability, Information, Community health workers
Introduction
Reliable and timely health information is an essential foundation of public health action and health systems strengthening, both nationally and internationally [1, 3]. Being able to plan for and address the health needs requires information about the health status of a community. This kind of information is mostly unavailable in developing countries, partly due to lack of vital registration. Information that is available is derived from hospitals, yet most illness and death occur outside the health system [8, 11].
The need for sound information is especially urgent in the case of emergent diseases and other acute health threats, where rapid awareness, investigation and response can save lives and prevent broader national outbreaks and even global pandemics [1].
Measurement of population health, its causes and distribution is fundamental to the development of evidence for health policies and for the evaluation and planning of health systems and intervention programs [12]. Valid, reliable and comparable measures of health states of individuals are critical components of the evidence base for health policy [12].
The government of Kenya, through the ministry of public health and sanitation has rolled out the community health strategy as a way of improving health care at the household level. This strategy involves community health workers collecting health status data at the household level, which is then used for dialogue at all the levels to encourage improvement in health status through informed decisions and actions by various stakeholders.
Community health workers have been known to collect health related data at the community level. They have been used to collect data for screening for Tuberculosis in many countries, achieving high rates of case detection in Bangladesh [5]. CHWs can prepare and interpret malaria Rapid Diagnostic Tests correctly and safely when supported by clear instructions and appropriate training. Findings from other studies show that a well-designed job aid and brief training can ensure high CHW performance [9]. This continues to improve in time through continuous practice. Community health workers have also been used to manage neonatal infections in rural India [2].
A lot of health interventions have involved the community health workers in reaching out to the community and successfully implementing these health interventions. Large scale involvement of community health workers in government initiatives and most especially to collect health data for use in the health systems has been minimal due to the assumption that the data may not be accurate, hence not useful by the government.
The Problem Statement
Western Kenya has consistently provided low health and development indicators despite presence of an array of interventions initiated by the NGOs and the government of Kenya [10]. These low performing indicators beg for multiple interventions and concerted efforts on all sides to ensure that a reversal is achieved. These interventions require frequent, timely, valid and accurate information on the health status of the targeted populations for them to be effective. This information is for the most part unavailable.
Population-based sample surveys, Demographic and Health Surveys (DHS), and sentinel surveillance methods, are commonly used as substitutes for more widespread, consistent health and demographic monitoring and intervention studies [7]. Nevertheless, sentinel surveillance methods, has been criticised for being expensive and time consuming, and can be applicable only in isolated populations. It is therefore necessary to determine whether other methods can be used to attain similar results, yet not as expensive in time and financial terms. With the rolling out of the community health strategy, a lot of information that can be used to determine the health status of a community can be available. Additionally, the information can be available to the local stakeholders which is not the case with sentinel surveillance data.
CHWs and other lay community workers have been known to provide health care services such as home visits, health education, referral and management of birth related problems at the household level and collect a wide range of health information [2, 6]. However, little is known as to whether this information can be relied on to measure population health, its causes and distribution. Moving from Demographic Surveillance Systems and Demographic Health Survey data to Community Based data collected by Community Health Workers to estimate burden of disease has not been looked at widely.
It is therefore necessary that the validity and reliability of the data collected by community health workers be determined, whether this kind of data can be used for planning and policy formulation for the communities from which it is collected and processed. This would go a long way to settle speculation on whether the data collected by these workers is of acceptable quality for use in determining the health status, its causes and leading to decisions on actions for its improvement.
General Objective
To investigate the reliability of Community Based Information.
Research Question
What is the reliability of data collected at the Community level by Community health workers?
Methodological Approach
Community health workers register and update household information on identified indicators twice a year. Ten percent of this data was re-collected, 1 week later, using the same tool by a team of well trained research assistants to provide the gold standard for the data collection, in order to validate the data. The team also conducted verbal autopsies in all households experiencing mortality to determine possible causes of death.
This study used the Test–Retest/stability Reliability which compares results from an initial test with repeated measures later on, the assumption being that if the instrument is reliable there will be close agreement over repeated tests if the variables being measured remain unchanged. The Kappa score, sensitivity, specificity and positive predictive values were also used to measure reliability and were arrived at as indicated on Table 1.
Table 1.
The framework for calculating the predictive value and reliability of CHW collected data
| Gold standard (Research assistants data) | Test results (CHW data) | |
|---|---|---|
| Positive (+) | Negative (−) | |
| Positive (+) | a | b |
| Negative (−) | c | d |
Sensitivity = a/a + b
Specificity = d/c + d
Predictive value = a/a + c
Findings
Child Health
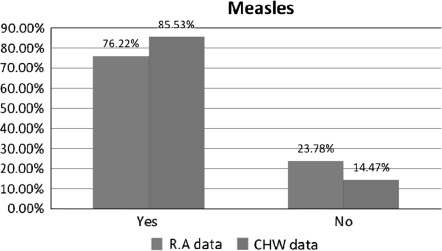
The comparison between Community health workers (CHWs) data and Research Assistants (RA) collected data on measles immunization coverage shows disparities between the two sets of data. A difference of approximately 10% was evident when the 2 sets were compared as shown in Fig. 1. Sensitivity/specificity analysis shows 49 and 51.4% respectively with a predictive value of 87.5. Pearson’s Chi significance of 0.032 and a Kappa score of −0.097.
Fig. 1.
Comparison of data collected on measles
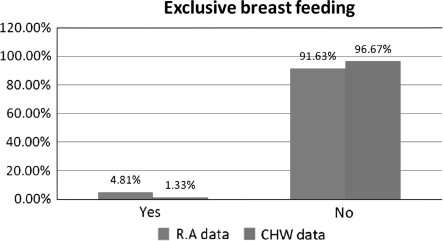
A difference of approximately 3% as illustrated in Fig. 2 was noted in the exclusive breastfeeding variable showing little difference in the two sets of data. A significance of 0.000 for the Pearson chi square test was found. Sensitivity/Specificity analysis shows 77.1 and 52.6% respectively with a predictive value of 4.8.
Fig. 2.
Comparison of data collected on exclusive breast feeding
Maternal Health
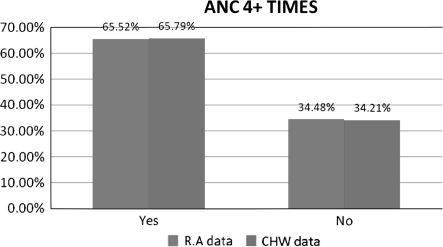
Very little difference, less than 1%, in the two sets of data as illustrated in Fig. 3 was noted for the ANC variable. Sensitivity/specificity values noted were 48.7 and 51% respectively, with a predictive value of 65.5. Kappa score of −0.005.
Fig. 3.
Comparison of data collected on ANC 4+ times
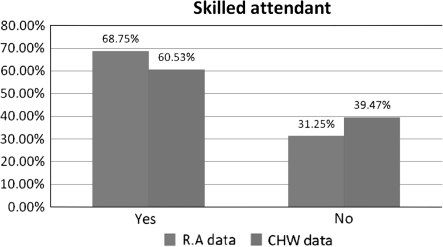
Differences in the two sets of data for the skilled attendant variable was a little over 8% as in Fig. 4 indicating significant disparities between the sets. Sensitivity/specificity values noted were 51.8 and 57.1% with a predictive value of 68.75. Kappa score of 0.075.
Fig. 4.
Comparison of data collected on skilled attendant
Environmental Health
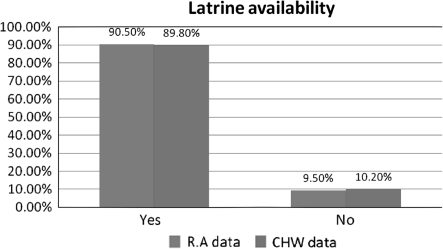
The latrine availability variable had good correspondence, which was less than 1%, indicating 99% agreement of the two data sets (See Fig. 5). Sensitivity/Specificity values were 48.9 and 52.9% respectively with a Predictive value of 90.5. Chi- square significance of 0.000 and Kappa score of 0.099.
Fig. 5.
Comparison of data collected on latrine availability
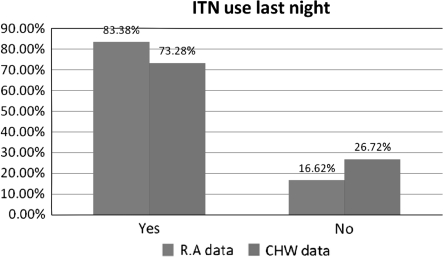
A difference of approximately 10% was noted for the ITN use variable suggesting significant disparities between the two sets of data as shown in Fig. 6. A significance of 0.000 was noted for the Person chi square test, while sensitivity/specificity values of 51.9 and 63.0% were noted respectively. Predictive value of 83.4 was found for the variable. Kappa score of 0.006.
Fig. 6.
Comparison of data collected on ITN use last night
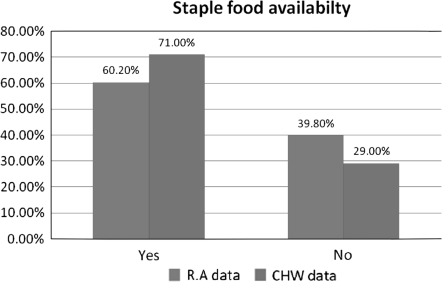
More than 10% difference was noted for the staple food variable as indicated in Fig. 7. Pearson chi square test revealed a significance of 0.036. A kappa score of −.107 was found which had a significance of 0.036. Sensitivity/specificity analysis showed 44.4 and 43.6% respectively with a predictive value of 60.2.
Fig. 7.
Comparison of data collected on staple food availability
Discussion
Under child health measles showed less than 10% discrepancy between RA and CHW collected data compared to exclusive breast feeding. The association between the two sets of observation was also stronger in exclusive breast feeding (sig = 0.00, for Pearson chi- square test) than in measles (sig = 0.032, for Pearson chi- square test). There was also little agreement between the two sets of observation as indicated by the kappa score k = 0.097. This concurs with Bang et al. in [2] who indicated that CHWs have been involved in management of child illness. In Kenya, CHWs have also often been used in measles campaigns which increase their awareness of this indicator.
The little difference in ANC did not hold for agreement giving a score of −0.005 indicating that the two observations showed less agreement than would be expected just by chance. However, it is still important to note that this variable had very good concurrence between both sets of data. This may be because the CHWs have been involved in health education of pregnant women during the ANC sessions at health facilities. While for the skilled attendant variable, inasmuch as indicating disparities at a glance, also showed less agreement (k = 0.075). It should also be noted that the discrepancy was of less than 10%.
The latrine availability variable had good correspondence, which was less than 1%. Sensitivity/Specificity values were 48.9 and 52.9 respectively with a Predictive value of 90.5. Chi- square significance of 0.000 and Kappa score of 0.099. Latrine availability is a straightforward and direct to collect data on, and it’s no surprise that it had good correspondences. This is an issue that sheds light that there are variables that we can entirely depend on non professional to collect and still get valid results but those health variables that are a bit complicated makes it very difficult for one to rely on as valid and reliable information that can be used for planning and policy formulation purposes.
A difference of approximately 10% was noted comparing data collected by CHWs and Research Assistants in the use of ITN. Using the health variable it clearly shows that there is a significant disparity between the two sets of data of 10%. With a significance of 0.000 using the Person chi square test, while sensitivity/specificity values of 51.95 and 63.0% were noted respectively. Predictive value of 83.4 was found for the variable. Kappa score of 0.006. This poses a challenge on the reliability of data collected by CHWs for planning and policy formulation purposes given that health issues are critical and sensitive, hence requires great accuracy and precision measures. Variables like ITN use may be difficult to determine too since the only way to ensure accuracy of this kind of information is through observation. Since the variable was looking for ITN use last night, the discrepancy might have come about since the nights of reference were different.
More than 10% difference was noted for the staple food variable. Fisher’s exact test showed a significance of 0.023 while Pearson chi square test revealed a significance of 0.036. A kappa score of −.107 was found which had a significance of 0.036. Sensitivity/specificity analysis showed 44.4 and 43.6% respectively with a predictive value of 60.2.
A difference of 10% noted in the comparison of two sets of data raises the question how valid is the data collected by CHWs who are non professionals. A Reliable and timely health information is an essential foundation of public health action and health systems strengthening, both nationally and internationally [1, 13]. CHWs are key in the health sector and they need to be engaged at all times even in decision making, from the data analysis and comparison there is still hope that they can be trained and it has to be ongoing until the desired results are achieved.
Conclusion and Recommendations
Community based health information collected by CHWs can be used to guide planning and action at local level given that there is 90% concurrence between the RA and CHW collected data in all the variables. However, it would be ill advised to use it to guide policy as since higher levels of reliability would be required to make such decisions. To be considered also is that accurate measures would be expected on the third or subsequent rounds of data collection as hypothesised by [4, 9].
There is need to investigate other factors that may have an influence in the accuracy of the data collected by CHWs such as education level and the number of training sessions the CHWs have undergone. This may shed light on the disparities found on some of the variables.
Open Access
This article is distributed under the terms of the Creative Commons Attribution Noncommercial License which permits any noncommercial use, distribution, and reproduction in any medium, provided the original author(s) and source are credited.
Footnotes
This research was funded by the Global Health Research Initiative through the African Health Systems Initiative.
Contributor Information
C. F. Otieno, Phone: +254-721433509, FAX: +254-721433509, Email: karynflora@yahoo.com
D. Kaseje, Phone: +254-733320141
B. M. Ochieng’, Phone: +254-733372822
M. N. Githae, Phone: +254-723-037-608
References
- 1.Aqil A, Lippeveld T, Hozumi D. PRISM framework: A paradigm shift for designing, strengthening, evaluating routine health information systems. Health Policy Plan. 2009;24(3):217–228. doi: 10.1093/heapol/czp010. [DOI] [PMC free article] [PubMed] [Google Scholar]
- 2.Bang AT, Bang RA, Baitule SB, Reddy MH, Deshmukh MD. Effect of home-based neonatal care and management of sepsis on neonatal mortality: Field trial in rural India. The Lancet. 1999;354:1955–1961. doi: 10.1016/S0140-6736(99)03046-9. [DOI] [PubMed] [Google Scholar]
- 3.Bradshaw D, Groenewald P, Laubscher R, Nannan N, Nojilana B, Norman R, Pieterse D, Schneider M. Initial burden of disease estimates for South Africa, 2000. Cape Town: South African Medical Research Council; 2003. [PubMed] [Google Scholar]
- 4.Braham RA, Finch CF. The reliability of team-based primary data collectors for the collection of exposure and protective equipment use data in community sport. British Journal of Sports Medicine. 2004;38:e15. doi: 10.1136/bjsm.2002.004002. [DOI] [PMC free article] [PubMed] [Google Scholar]
- 5.Chowdhury A, Chowdhury S, Islam M, Islam A, Vaughan J. Control of tuberculosis by community health workers in Bangladesh. The Lancet. 2009;350(9072):169–172. doi: 10.1016/S0140-6736(96)11311-8. [DOI] [PubMed] [Google Scholar]
- 6.Chowdhury, H. R., Thompson, S. C., Ali1, M., Alam, N., Yunus 5, M., Streatfield 4, P. K. (2010). A comparison of physicians and medical assistants in interpreting verbal autopsy interviews for allocating cause of neonatal death in Matlab, Bangladesh: Can medical assistants be considered an alternative to physicians? Population Health Metrics, 8, 23. [DOI] [PMC free article] [PubMed]
- 7.de Savigny, D., Kasale, H., Conrad Mbuya et Graham Reid CRDI. (2008). Fixing health systems. [DOI] [PMC free article] [PubMed]
- 8.Fottrell E, Byass P. Population survey sampling methods in a rural African setting: Measuring mortality. Population Health Metrics. 2008;6:2. doi: 10.1186/1478-7954-6-2. [DOI] [PMC free article] [PubMed] [Google Scholar]
- 9.Harvey SA, Jennings L, Chinyama M, Masaninga F, Mulholland K, Bell DR. Improving community health worker use of malaria rapid diagnostic tests in Zambia: Package instructions, job aid and job aid-plus-training. Malaria Journal. 2008;7:160. doi: 10.1186/1475-2875-7-160. [DOI] [PMC free article] [PubMed] [Google Scholar]
- 10.Kisumu District Strategic Plan 2005–2010 for Implementation of the national population policy for sustainable development. National Coordinating Agency for Population and Development.
- 11.Kyobutungi C, Ziraba AK, Ezeh A, Yé Y. The burden of disease profile of residents of Nairobi’s slums: Results from a Demographic Surveillance System. Population Health Metrics. 2008;6:1. doi: 10.1186/1478-7954-6-1. [DOI] [PMC free article] [PubMed] [Google Scholar]
- 12.Mathers, C. D., Bernard, C., Iburg, K. M., Inoue, M., Fat, D. M., Shibuya, K., Stein, C., Tomijima, N., Xu, H. (2003). Global Burden of Disease in 2002: Data sources, methods and results. World Health Organization December 2003.
- 13.WHO. (2008). Framework & standards for country health information systems (2nd ed.). www.who.int/healthmetrics/documents/hmn_framework200803.pdf.


