

Abstract
Background
Neuroblastomas (NBs) are characterized by clinical heterogeneity, from spontaneous regression to relentless progression. The pattern of NTRK family gene expression contributes to these disparate behaviors. TrkA/NTRK1 is expressed in favorable NBs that regress or differentiate, whereas TrkB/NTRK2 and its ligand BDNF are co-expressed in unfavorable NBs, representing an autocrine survival pathway. We determined the significance of NTRK family gene expression in a large, representative set of primary NBs.
Patients and Methods
We analyzed the expression of the following genes in 814 NBs using quantitative real-time RT-PCR: NTRK1, NTRK2, NTRK3, P75/NGFR, NGF, BDNF, IGFR1 and EGFR. Expression (high vs. low) was dichotomized by median expression value and compared to clinical and biological variables as well as outcome.
Results
High NTRK1 expression was strongly correlated with favorable age, stage, MYCN status, histology, ploidy, risk group and outcome (p<0.0001 for all). However, it did not add significantly to the panel of prognostic variables currently used for cooperative group trials. NTRK2 expression was associated with risk factors but not with outcome. High NGF expression was also associated with most risk factors and weakly with unfavorable outcome.
Conclusions
High expression of NTRK1 is strongly associated with favorable risk factors and outcome in a large, representative population of NB patients. It did not add significantly to the current risk prediction algorithm, but it may contribute to future expression classifiers. Indeed, prospective assessment of NTRK1 and NTRK2 expression will identify tumors that would be candidates for NTRK-targeted therapy, either alone or in combination with conventional agents.
Keywords: neuroblastoma, TrkA/NTRK1, TrkB/NTRK2, TrkC/NTRK3, P75/NGFR, NGF, BDNF, expression, prognosis
Introduction
Neuroblastoma (NB) is the most common extracranial solid tumor of childhood. This tumor arises from the sympathetic nervous system and accounts disproportionately for childhood cancer deaths [1]. NBs demonstrate clinical heterogeneity, from spontaneous regression to relentless progression. Different patterns of genetic change have been identified that are associated with these disparate clinical behaviors [2]. In addition, we and others have determined that the pattern of NTRK family gene expression likely contributes to this clinical heterogeneity [3,4].
NTRK1 and NTRK3 are highly expressed in favorable NBs
We showed that high TrkA/NTRK1 expression in primary NBs was associated with favorable clinical features and inversely associated with MYCN amplification [5]. Furthermore, we [5,6] and others [7–13] have shown that NTRK1 expression is predictive of a favorable outcome. Some NBs also express P75/NGFR, and this increases the sensitivity and specificity of NTRK receptors for their cognate ligands [14]. However the clinical importance of NGFR expression is less clear [7]. Human NTRK1 maps to 1q32-41 [15], but specific mutations or activating rearrangements are quite rare [16,17]. Low-stage NBs usually express high NTRK1 and differentiate in vitro in the presence of NGF, but undergo apoptosis in its absence [6,18]. This in vitro behavior suggests the NGF/NTRK1 pathway may be responsible for in vivo differentiation or regression of favorable NBs. We demonstrated that full-length NTRK3 is expressed in about 25% of primary NBs, and these represent a subset of NTRK1-expressing tumors [19]. These tumors are associated with lower age and stage, and they lack MYCN amplification [19,20]. None expressed NT3 mRNA, and no NTRK3 mutations have been reported to date in NBs.
NTRK2 and BDNF are highly expressed in unfavorable NBs
Full-length NTRK2 and its ligand BDNF are expressed in more aggressive NBs and expression is highly correlated with MYCN amplification (p<0.001) [21], whereas truncated NTRK2 (lacking a tyrosine kinase domain) is expressed in more differentiated tumors, such as ganglioneuroblastoma. Addition of BDNF to NTRK2-expressing NB cell lines causes enhanced cell survival in serum-free media [21]. Others found similar results in NB cells induced to express NTRK2 by retinoic acid treatment [22]. Thus, the expression of both BDNF and full-length NTRK2 probably represents an autocrine or paracrine survival pathway that is important for aggressive NBs [21–23]. This NTRK2/BDNF pathway likely contributes to this aggressive behavior by promoting invasion, metastasis, angiogenesis and drug resistance [22,24–27]. We cloned human NTRK2 and mapped it to 9q22 [28], but so far we have not found mutations or activating rearrangements in NBs.
In this study, we examined 814 representative primary NBs for NTRK family gene expression using quantitative real-time RT-PCR to determine the potential prognostic value of assessing gene expression. We also assessed the impact of NTRK1 expression on predicting outcome after adjusting for clinical and biological variables that are currently used for risk stratification in the Children’s Oncology Group (COG). Our data suggest that high NTRK1 expression is strongly associated with favorable clinical and biological features, and it is highly predictive of outcome as an individual variable. However, it did not add to the existing risk prediction algorithm, perhaps because it is so strongly correlated with all of the clinical and biological factors currently used for risk stratification.
Patients and Methods
Patients and tumor samples
For these expression studies, we selected 814 NB samples from patients treated on recent NB interventional protocols of the COG. Patients were diagnosed between 1995 and 2008 and were selected to be representative based on age, disease stage by the International Neuroblastoma Staging System (INSS) [29], and the prevalence of MYCN amplification [30–32]. All patients were consented and enrolled on COG Biology protocol ANBL00B1, and clinical information was maintained and analyzed in the COG Statistical Office (WBL, Gainesville, FL). Institutional Review Boards at the participating institutions gave approval for ANBL00B1. Tumor samples were snap frozen, and tumor RNA samples were obtained from the COG Nucleic Acid Bank. We analyzed expression using a quantitative, real-time RT-PCR (qRT-PCR) technique on customized low-density array (LDA) microfluidic cards. We used RQ values for analysis of gene expression, but DDC values gave similar results. The NTRK family genes analyzed included: NTRK1, NTRK2, NTRK3, NGFR, NGF, and BDNF, as well as the expression of EGFR and IGF1R, two other receptor tyrosine kinases (RTKs) implicated in NB pathogenesis. We normalized gene expression to GAPDH, UBC, HPRT1 and IPO8. Expression (high vs. low) for each was compared to clinical and biological variables as well as outcome.
Prognostic variables
We correlated expression of these genes with clinical and biological risk variables: patient age at diagnosis (<18 mo vs. ≥18 mo); INSS stage (1, 2, 3, 4S vs. 4) [29]; MYCN amplification status (nonamplified vs. amplified) [2,30–32]; cell ploidy (DNA index: hyperdiploid vs. diploid) [31,33,34]; Shimada histopathology (favorable versus unfavorable) [35,36]; 1p status (normal vs. aberration) [37,38]; 11q status (normal vs. aberration) [37,39]; and risk group (low/intermediate vs. high) according to COG criteria [40]. We also tested the predictive ability of NTRK family gene expression for event-free survival (EFS) and overall survival (OS) in univariate and multivariable analyses.
Quantitative assessment of gene expression
We used qRT-PCR to measure NTRK family gene mRNA expression. We reverse transcribed 1–2 μg RNA using the Applied Biosystems (AB, Foster City, CA) High Capacity cDNA Archive Kit and a standard protocol. Reactions were performed in a 20 μl total volume. Prepared cDNA was stored for 24 hours or less at 4°C, or at −20°C for long-term storage. Quantitative gene expression analysis was performed via TaqMan qRT-PCR with AB TaqMan LDA microfluidic cards. Custom-designed arrays contained 8 sample-loading ports, each with 16 detectors in triplicate, for 48 reaction chambers per port, and a total of 384 reactions per card. Twelve primer/probe sets (detectors) for genes of interest and 4 endogenous controls were included on each card (results of four other genes are not reported here). qRT-PCR was performed using the ABI PRISM 7900HT Sequence Detection System (AB). Gene expression for each sample-detector pair was measured as a fold change in amplification relative to a calibrator sample. First-pass analysis was performed using the comparative Ct method with ABI PRISM SDS 2.2.2 and RQ Manager software. Amplification efficiencies of all genes were assumed to be approximately equal to the efficiencies of the endogenous controls (within 5%).
Internal gene expression controls
Prior to assay selection, 2 endogenous control LDA cards were run with 16 representative samples to determine which endogenous control detectors to include in the study. GeNorm [41] was used to select the 3 endogenous control primer/probes with the most stable expression among the 16 samples. ABI custom arrays must include either 18S RNA or GAPDH; of the two, GAPDH was more stably expressed and was included. IPO8, UBC, and HPRT1 were the 3 additional endogenous controls selected from the 16 because they were the most stably expressed, and there was precedent for their use in the literature [41].
Statistical analyses
In addition to normalization to internal controls, we performed further analysis prior to statistical analysis, using Integromics’ RealTime StatMiner software. With this software, the most sTable II endogenous controls for the entire sample set were selected via the software’s internal GeNorm application. The geometric mean of the expression of these 2 endogenous controls was used to normalize samples, using human fetal brain total RNA converted to cDNA as a calibrator sample (ClonTech, Cat. No. 636526). NTRK family gene expression levels were dichotomized into low and high using the median expression value. Other cut points were tested, but none gave significantly better discrimination. Univariate analyses: We used Fisher’s exact test to test for associations of the expression level versus risk factors in a pairwise fashion. Risk factors included: patient age at diagnosis, INSS stage, MYCN amplification status, tumor cell ploidy, Shimada histopathology, 1p deletion, and 11q deletion.
A Wilcoxon test was used to test for the association of expression of each gene with each of the dichotomized risk factors. Due to multiple comparisons of prognostic and gene expression variables, p-values <0.001 were considered statistically significant. EFS time was calculated from the time of study enrollment until the time of the first relapse, progressive disease, secondary malignancy, or death, or until last contact. OS time was calculated until the time of death, or until last contact. We used the Kaplan-Meier method to generate survival curves for each gene expression subgroup (<median, ≥median), and curves were compared using a log rank test (p<0.005 for statistical significance). EFS and OS rates were expressed as the 5-year point estimate ± the standard error, with standard errors calculated by the method of Peto. Multivariable analyses: We used Cox proportional hazards regression to determine if NTRK expression is prognostic of EFS or OS in one model adjusting for age, stage, and MYCN, and in another model adjusting for stage, histology, and ploidy.
Results
Correlation of Gene Expression with Prognostic Variables
We analyzed the expression of NTRK family genes (NTRK1, NTRK2, NTRK3, NGFR, NGF, and BDNF), as well as the expression of EGFR and IGF1R in 814 representative NBs. Table I shows the distribution of patients by COG risk factors, which was representative of an unselected population. Table II shows the p-values from the Wilcoxon test and highlights those associations with a p-value of ≤0.001. We found the following statistically significant associations: NTRK1 expression with all of the risk factors; NTRK2 expression with age, MYCN and ploidy; NGFR expression with age and MYCN; NGF expression with age, MYCN, ploidy and risk; BDNF expression with age and ploidy; and IGF1R expression with age and ploidy; neither NTRK3 nor EGFR expression had significant association with any risk factors.
Table I.
Distribution of Patients by Risk Factors (n=814)
| Risk factors | Frequency |
|---|---|
| Age | |
| < 18 months | 383 (47%) |
| ≥ 18 months | 431 (53%) |
| INSS Stage | |
| Stage 1,2,3,4s | 495 (61%) |
| Stage 4 | 319 (39%) |
| MYCN | |
| Not Amplified | 663 (82%) |
| Amplified | 145 (18%) |
| Missing | 6 |
| Ploidy | |
| Hyperdiplid | 525 (65%) |
| Diploid | 284 (35%) |
| Missing | 5 |
| Shimada | |
| Favorable | 423 (54%) |
| Unfavorable | 356 (46%) |
| Missing | 35 |
| 1p | |
| No LOH | 357 (81%) |
| LOH | 86 (19%) |
| Missing | 371 |
| 11q | |
| No LOH | 305 (73%) |
| LOH | 112 (27%) |
| Missing | 397 |
| Risk | |
| Low/Intermediate | 484 (59%) |
| High | 330 (41%) |
Table II.
P-values from the Wilcoxon Tests of Association for Gene Expression (RQ value) with Risk Factors
| Gene LDA | Age (n=814) | Stage (n=814) | MYCN (n=808) | Ploidy (n=809) | Shimada (n=779) | 1p (n=443) | 11q (n=417) | Risk (n=814) |
|---|---|---|---|---|---|---|---|---|
| NTRK1 | <0.0001 | <0.0001 | <0.0001 | <0.0001 | <0.0001 | <0.0001 | 0.0023 | <0.0001 |
| NTRK2 | <0.0001 | 0.2180 | <0.0001 | 0.0001 | 0.1674 | 0.0019 | 0.0024 | 0.0052 |
| NTRK3 | 0.8991 | 0.0371 | 0.5574 | 0.0017 | 0.1191 | 0.0215 | 0.2818 | 0.0226 |
| NGFR | <0.0001 | 0.1026 | <0.0001 | 0.0042 | 0.0260 | 0.0023 | 0.4492 | 0.0439 |
| NGF | <0.0001 | 0.1095 | 0.0002 | <0.0001 | 0.0312 | 0.1575 | 0.0643 | 0.0001 |
| BDNF | <0.0001 | 0.9232 | 0.7514 | <0.0001 | 0.0317 | 0.6939 | 0.7320 | 0.0921 |
| EGFR | 0.0107 | 0.7749 | 0.4611 | 0.0071 | 0.0931 | 0.1542 | 0.2482 | 0.8724 |
| IGF1R | <0.0001 | 0.6077 | 0.7672 | <0.0001 | 0.0213 | 0.5095 | 0.7421 | 0.0591 |
Values less than 0.001 considered significant
Correlation of Gene Expression with Outcome
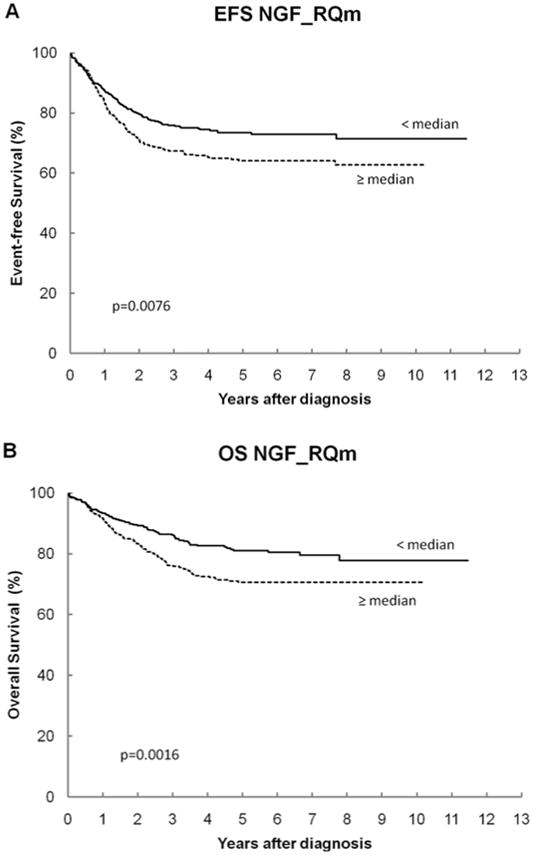
The overall cohort had 5-year EFS and OS of 69% ± 2% and 76% ± 2%, respectively, which is consistent with the combined outcome on recent low-, intermediate- and high-risk COG trials. Table III shows the log-rank p-values and the 5-year EFS and OS for all genes. For NTRK1, patients with high expression have statistically significantly better EFS and OS than those with low expression (Figures 1A and 1B). For NGF, patients with low expression have statistically significantly better OS than those with high expression (Figures 2A and 2B). None of the other NTRK family genes or other RTKs analyzed had a significant association with outcome.
Table III.
Log rank p-values and 5-year EFS and OS for Gene Expression (RQ value)*
| Gene RQ Dichotomized by the Median |
N | 5-year EFS ± SE (%) |
EFS p-value |
5-year OS ± SE (%) |
OS p-value |
|---|---|---|---|---|---|
| Overall cohort | 814 | 69 ± 2 | N/A | 76 ± 2 | N/A |
| NTRK1 | <0.0001 | <0.0001 | |||
| < median | 407 | 60 ± 3 | 66 ± 3 | ||
| ≥ median | 407 | 78 ± 3 | 86 ± 2 | ||
| NTRK2 | 0.4570 | 0.1480 | |||
| < median | 407 | 70 ± 3 | 77 ± 3 | ||
| ≥ median | 407 | 68 ± 3 | 74 ± 3 | ||
| NTRK3 | 0.5083 | 0.1773 | |||
| < median | 407 | 69 ± 3 | 78 ± 3 | ||
| ≥ median | 407 | 68 ± 3 | 74 ± 3 | ||
| NGFR | 0.1499 | 0.2239 | |||
| < median | 407 | 66 ± 3 | 74 ± 3 | ||
| ≥ median | 407 | 71 ± 3 | 78 ± 3 | ||
| NGF | 0.0076 | 0.0016 | |||
| < median | 407 | 73 ± 3 | 81 ± 3 | ||
| ≥ median | 407 | 64 ± 3 | 71 ± 3 | ||
| BDNF | 0.1822 | 0.1670 | |||
| < median | 407 | 71 ± 3 | 78 ± 3 | ||
| ≥ median | 407 | 67 ± 3 | 74 ± 3 | ||
| EGFR | 0.4600 | 0.4633 | |||
| < median | 407 | 68± 3 | 75 ± 3 | ||
| ≥ median | 407 | 70 ± 3 | 76 ± 3 | ||
| IGF1R | 0.5149 | 0.2406 | |||
| < median | 407 | 68 ± 3 | 74 ± 3 | ||
| ≥ median | 407 | 70 ± 3 | 78 ± 3 |
Values less than 0.005 considered significant
Figure 1.
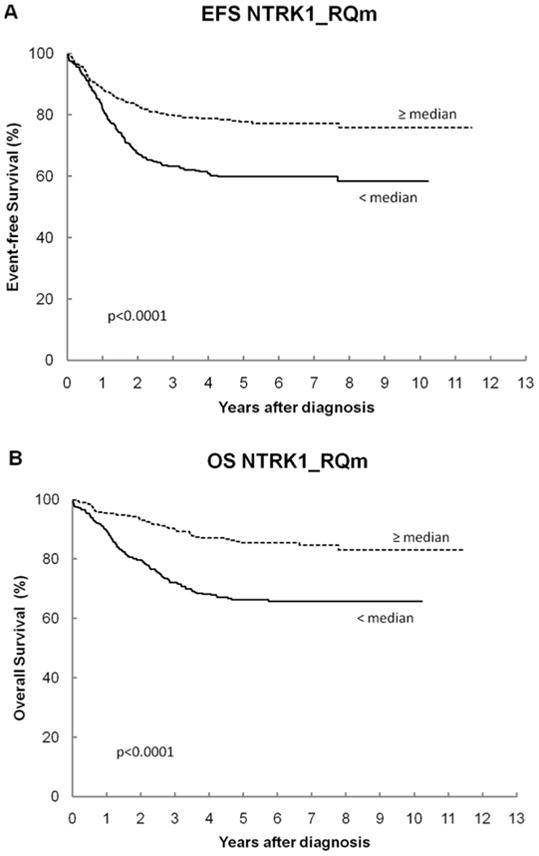
Figure 2.
Multivariable Analysis of Risk Factors with NTRK1 Expression
We also performed multivariable analysis of EFS considering the clinical variables of patient age and INSS stage, as well as biological variables of MYCN copy number (amplified or not), tumor cell ploidy (diploid or hyperdiploid) and Shimada histopathology (favorable or unfavorable) currently in use in the COG. We wanted to determine if NTRK1 expression would contribute to predicting outcome in addition to or instead of one of these variables. Although NTRK1 expression was significantly predictive of event-free survival as an independent variable, it was not significant after adjusting for age, stage and MYCN amplification (Model B; Table IV), nor was it significant after adjusting for stage, histology, and ploidy (Model C; Table IV).
Table IV.
Multivariable analyses
| Model | Significant adverse factor | n | p-value | Hazard ratio (95% confidence interval) |
|---|---|---|---|---|
| A – Unsupervised, backwards selection* | Stage 4 | 776 | <0.0001 | 3.2 (2.3, 4.4) |
| Unfavorable histology | <0.0001 | 3.1 (2.2, 4.5) | ||
| Diploidy | 0.0459 | 1.3 (1.01, 1.7) | ||
| B – Supervised comparison of NTRK1 to age, stage, and MYCN | Stage 4 | 808 | <0.0001 | 3.7 (2.7, 5.1) |
| MYCN amplified | <0.0001 | 1.8 (1.4, 2.5) | ||
| Age ≥ 18mo | 0.0008 | 1.7 (1.3, 2.4) | ||
| NTRK1 < median | 0.9017 | 1.0 (0.7, 1.3) | ||
| C – Supervised comparison of NTRK1 to stage, histology, and ploidy | Stage 4 | 776 | <0.0001 | 3.2 (2.3, 4.4) |
| Unfavorable histology | <0.0001 | 3.0 (2.1, 4.3) | ||
| Diploidy | 0.0656 | 1.3 (1.0, 1.7) | ||
| NTRK1 < median | 0.3412 | 0.9 (0.7, 1.2) |
Variables tested in Model A and found to be not statistically significant were: age, MYCN, 11q LOH, 1p LOH, NTRK1, NGF, and MYCN RQ. Forward selection produced the same result.
Discussion
NBs have heterogeneous clinical behavior that is only partially predicted by the clinical and biological variables currently used in cooperative group studies in the US, Europe and Japan. Therefore, it would be beneficial to have additional prognostic markers, particularly if they could also identify tumors that would be candidates for targeted therapy. We and others have determined that the pattern of expression of NTRK neurotrophin receptors is associated with clinical behavior. Furthermore, these receptors likely contribute to this behavior, because transfection of null NB cells with either NTRK1 or NTRK2 leads to in vitro and in vivo behaviors that mimic those seen in primary tumors that express either receptor endogenously [24,26].
There have been a number of studies focusing on the relationship between NTRK receptor expression (mainly NTRK1) and other prognostic variables as well as survival. Recently, several groups have found that high levels of NTRK1 confer a favorable prognosis, and conversely low levels of NTRK1 are associated with a more unfavorable prognosis. De Souza studied 64 NB patients and found that those with high mRNA NTRK1 expression had better overall survival regardless of their INSS risk group [42]. However, the presence of NTRK1 mRNA expression conferred a significant survival advantage only in the intermediate risk group. Hishiki studied 106 patients and found that high levels of NTRK1 correlated with favorable risk factors (young age, low stage, favorable histology and non-amplified MYCN status), whereas low NTRK1 expression indicated a prognosis [9]. Shimada studied 265 neuroblastic tumors (including NBs, ganglioneuroblastomas and ganglioneuromas) and showed that NTRK1 expression was not an independent predictor of poorer outcome when the model included other associated prognostic variables like stage, histology and MYCN status [11]. Schramm and colleagues studied 68 patients with expression profiling in an attempt to obtain a precise prediction of the clinical behavior and risk stratification [10]. In their studies, NTRK1 expression demonstrated a strong association with a specific gene expression pattern and was correlated with specific biologic subtypes. They reported that NTRK1 expression was most useful when used to stratify patients in an intermediate risk category. Two groups have looked at combining NTRK1 and/or NTRK2 with other genes thought to be important in NB to correlate gene expression and prognosis [12,13]. These two studies support the importance of the NTRK family of receptors in NB, but they studied a small number of patients (51 and 44 patients, respectively). Moreover, no prior studies have examined all three NTRK receptors (NTRK1, NTRK2 and NTRK3) as well as their cognate ligands and the low-affinity co-receptor, NGFR.
We initially examined expression of the NTRK ligands NGF, BDNF, NT3 and NT4, in addition to three NTRK receptors (222 patients). However, the overall expression of NT3 and NT4 was so low that we dropped them from subsequent studies and analysis (data not shown). Nevertheless, we have made a comprehensive assessment of the expression of NTRK family receptors and ligands in a large and representative group of 814 COG patients treated on contemporaneous protocols. For comparison, we also examined the expression of two additional RTKs (EGFR and IGF1R) that have been implicated in the biology and behavior of NBs [43–46]. However, neither showed a significant correlation with outcome in this cohort.
Our results demonstrate a highly significant association between NTRK1 expression and all clinical/biological prognostic variables, and it was strongly and independently predictive of EFS and OS (p<0.0001 for all). High NTRK1 was associated with younger age, lower stage, normal MYCN copy number, hyperdiploid tumor DNA content and favorable histopathological features, as well as favorable outcome (EFS and OS). All these associations were identified as highly significant, even after adjusting for potential misidentifications due to multiple comparisons. Although we and others have shown such associations before (see above), this is the largest study to date (5–10 fold larger than almost all prior studies), and the correlation with outcome was particularly strong. NTRK1 did not add significantly to outcome prediction after correction for age, stage and MYCN amplification in a multivariable model. This is likely due to the very strong correlation of high NTRK1 expression with younger age, lower stage and the absence of MYCN amplification. Nevertheless, assessment of NTRK1 and NTRK2 expression will identify tumors that would be candidates for NTRK-targeted therapy.
We and others have shown a clear association between NTRK2 expression (along with its cognate ligand, BDNF) and unfavorable biological characteristics, such as invasion, metastasis, angiogenesis, drug resistance and unfavorable outcome [22,24–27]. Surprisingly, although NTRK2 expression was associated with several prognostic variables (age, MYCN status, ploidy), it was not associated with unfavorable outcome in this study. The primers used were designed to detect total NTRK2 expression, so an association of full-length NTRK2 expression with outcome may have been obscured by simultaneous detection of isoforms lacking the tyrosine kinase domain.
NGF expression was associated with several prognostic variables (age, normal MYCN copy number, ploidy). Unexpectedly, high NGF expression was associated with unfavorable OS (but not EFS), using our adjusted cutoff of p<0.005. However, the overall level of NGF expression was very low, so some of these statistical associations may have occurred by chance. It is hard to explain how high NGF expression would be associated with an unfavorable outcome. NGF would promote survival of NTRK1-expressing cells. However, activation of NTRK1/TrkA causes neuronal differentiation and cessation of growth. Also, NGF does not bind to the constitutively active NTRK1-III isoform [47], so it should not activate this unfavorable isoform. NTRK3, NGFR, BDNF and IGFR were each associated with one or two prognostic variables (age, MYCN copy number and/or ploidy) but not with outcome. Although we and others have shown that the EGFR pathway may have biological relevance in selected NBs [43–46], there was no association of EGFR expression with any prognostic variable or with outcome in this study.
Assessment of NTRK1 expression may provide additional prognostic information, especially in identifying low-risk patients. Measuring expression of NTRK1 (or other genes) by quantitative RT-PCR as a prognostic variable may be challenging to apply prospectively to a large group of patients. However, NTRK1 expression had strong prognostic significance using a variety of cut points (10%, 25%, 50%, 75% or 90%), which would make broad application easier. Also, the expression NTRK1 could be combined with a small panel of other disease-related genes using the LDA array approach to produce an expression classifier, which would be more quantitative, reproducible and easy to standardize compared to an expression microarray approach. It will be important to distinguish different NTRK1 and NTRK2 isoforms, as alternate isoforms of the same receptor can have the opposite effect on NB behavior. For example, the TrkAIII isoform has been associated with constitutive activation and more aggressive behavior [3,47]. In order to assess the expression of NTRK family genes comprehensively in a very large and representative group of patients (814), our study detected only total NTRK1 expression. However, there are now at least 5 NTRK1 isoforms, and we are in the process of assessing NTRK1 isoform expression in a subset of patients to determine the potential relevance of each isoform.
Prospective assessment of NTRK1 and NTRK2 expression will also identify tumors that are likely to respond to NTRK inhibitors either alone or in combination with conventional agents. We [48,49] and others [50] have shown that coadministration of NTRK inhibitors with conventional chemotherapeutic agents greatly enhances their efficacy, presumably by removing an important autocrine/paracrine survival pathway. Therefore, identification of NTRK2 expressing tumors will permit the rational selection of high-risk patients for inclusion of NTRK inhibitors in their therapeutic regimen. Indeed, NTRK inhibitor therapy may also be useful as monotherapy or in combination to treat favorable NBs expressing NTRK1 that have bulky disease or disease impinging on vital structures (spinal cord compression, liver enlargement with respiratory compromise). Therefore prospective assessment of NTRK family genes may not only provide valuable prognostic information, but also it would assist the rational selection of patients most likely to benefit from NTRK inhibitor therapy.
Acknowledgments
This work was supported in part from the National Institutes of Health (R01-CA094194, P01-CA097323—GMB; U10 CA98413-06—WBL), the Philadelphia Foundation (GMB); the TARGET Initiative (R01 CA140198-01); the American Cancer Society Research Scholar Grant (JEM); the Richard and Nancy Wolfson Young Investigator Grant (JEM), and the Audrey E. Evans Chair in Molecular Oncology (GMB). We are grateful to the COG Neuroblastoma Biology Committee and the ANBL00B1 biology protocol for providing samples for analysis.
Abbreviations
- RT-PCR
reverse transcriptase polymerase chain reaction
- NGF
nerve growth factor
- BDNF
brain-derived neurotrophic factor
- LDA
low-density array
Footnotes
Conflict of Interest
None of the authors have any conflicting financial interests with any of the material, data, results or conclusions in this manuscript.
References
- 1.Brodeur GM, Hogarty MD, Mosse YP, et al. Neuroblastoma. In: Pizzo PA, Poplack DG, editors. Principles and Practice of Pediatric Oncology. 6. Philadelphia: Lippincott, Williams and Wilkins; 2011. pp. 886–922. [Google Scholar]
- 2.Brodeur GM. Neuroblastoma: biological insights into a clinical enigma. Nat Rev Cancer. 2003;3(3):203–216. doi: 10.1038/nrc1014. [DOI] [PubMed] [Google Scholar]
- 3.Brodeur GM, Minturn JE, Ho R, et al. Trk receptor expression and inhibition in neuroblastomas. Clin Cancer Res. 2009;15(10):3244–3250. doi: 10.1158/1078-0432.CCR-08-1815. [DOI] [PMC free article] [PubMed] [Google Scholar]
- 4.Thiele CJ, Li Z, McKee AE. On Trk--the TrkB signal transduction pathway is an increasingly important target in cancer biology. Clin Cancer Res. 2009;15(19):5962–5967. doi: 10.1158/1078-0432.CCR-08-0651. [DOI] [PMC free article] [PubMed] [Google Scholar]
- 5.Nakagawara A, Arima M, Azar CG, et al. Inverse relationship between trk expression and N-myc amplification in human neuroblastomas. Cancer Res. 1992;52(5):1364–1368. [PubMed] [Google Scholar]
- 6.Nakagawara A, Arima-Nakagawara M, Scavarda NJ, et al. Association between high levels of expression of the TRK gene and favorable outcome in human neuroblastoma. N Engl J Med. 1993;328(12):847–854. doi: 10.1056/NEJM199303253281205. [DOI] [PubMed] [Google Scholar]
- 7.Kogner P, Barbany G, Dominici C, et al. Coexpression of messenger RNA for TRK protooncogene and low affinity nerve growth factor receptor in neuroblastoma with favorable prognosis. Cancer Research. 1993;53(9):2044–2050. [PubMed] [Google Scholar]
- 8.Suzuki T, Bogenmann E, Shimada H, et al. Lack of high-affinity nerve growth factor receptors in aggressive neuroblastomas. J Natl Cancer Inst. 1993;85(5):377–384. doi: 10.1093/jnci/85.5.377. [DOI] [PubMed] [Google Scholar]
- 9.Hishiki T, Saito T, Terui K, et al. Reevaluation of trkA expression as a biological marker of neuroblastoma by high-sensitivity expression analysis--a study of 106 primary neuroblastomas treated in a single institute. J Pediatr Surg. 2010;45(12):2293–2298. doi: 10.1016/j.jpedsurg.2010.08.021. [DOI] [PubMed] [Google Scholar]
- 10.Schramm A, Vandesompele J, Schulte JH, et al. Translating expression profiling into a clinically feasible test to predict neuroblastoma outcome. Clin Cancer Res. 2007;13(5):1459–1465. doi: 10.1158/1078-0432.CCR-06-2032. [DOI] [PubMed] [Google Scholar]
- 11.Shimada H, Nakagawa A, Peters J, et al. TrkA expression in peripheral neuroblastic tumors: prognostic significance and biological relevance. Cancer. 2004;101(8):1873–1881. doi: 10.1002/cncr.20557. [DOI] [PubMed] [Google Scholar]
- 12.Tajiri T, Higashi M, Souzaki R, et al. Classification of neuroblastomas based on an analysis of the expression of genes related to prognosis. J Pediatr Surg. 2007;42(12):2046–2049. doi: 10.1016/j.jpedsurg.2007.08.024. [DOI] [PubMed] [Google Scholar]
- 13.Zhang J, Zheng Y, Wang Y, et al. The studies on the correlation for gene expression of tyrosine-kinase receptors and vascular endothelial growth factor in human neuroblastomas. J Pediatr Hematol Oncol. 2010;32(3):180–184. doi: 10.1097/MPH.0b013e3181c46bab. [DOI] [PubMed] [Google Scholar]
- 14.Ho R, Minturn JE, Simpson AM, et al. The effect of P75 on Trk receptors in neuroblastomas. Cancer Lett. 2011;305(1):76–85. doi: 10.1016/j.canlet.2011.02.029. [DOI] [PMC free article] [PubMed] [Google Scholar]
- 15.Miozzo M, Pierotti MA, Sozzi G, et al. Human TRK proto-oncogene maps to chromosome 1q32-q41. Oncogene. 1990;5(9):1411–1414. [PubMed] [Google Scholar]
- 16.Scaruffi P, Cusano R, Dagnino M, et al. Detection of DNA polymorphisms and point mutations of high-affinity nerve growth factor receptor (TrkA) in human neuroblastoma. Int J Oncol. 1999;14(5):935–938. doi: 10.3892/ijo.14.5.935. [DOI] [PubMed] [Google Scholar]
- 17.Lipska BS, Drozynska E, Scaruffi P, et al. c. 1810C>T polymorphism of NTRK1 gene is associated with reduced survival in neuroblastoma patients BMC. Cancer. 2009;9:436. doi: 10.1186/1471-2407-9-436. [DOI] [PMC free article] [PubMed] [Google Scholar]
- 18.Nakagawara A, Brodeur GM. Role of neurotrophins and their receptors in human neuroblastomas: a primary culture study. Eur J Cancer. 1997;33(12):2050–2053. doi: 10.1016/s0959-8049(97)00280-3. [DOI] [PubMed] [Google Scholar]
- 19.Yamashiro DJ, Nakagawara A, Ikegaki N, et al. Expression of TrkC in favorable human neuroblastomas. Oncogene. 1996;12(1):37–41. [PubMed] [Google Scholar]
- 20.Ryden M, Sehgal R, Dominici C, et al. Expression of mRNA for the neurotrophin receptor trkC in neuroblastomas with favourable tumour stage and good prognosis. Br J Cancer. 1996;74(5):773–779. doi: 10.1038/bjc.1996.435. [DOI] [PMC free article] [PubMed] [Google Scholar]
- 21.Nakagawara A, Azar CG, Scavarda NJ, et al. Expression and function of TRK-B and BDNF in human neuroblastomas. Mol Cell Biol. 1994;14(1):759–767. doi: 10.1128/mcb.14.1.759. [DOI] [PMC free article] [PubMed] [Google Scholar]
- 22.Matsumoto K, Wada RK, Yamashiro JM, et al. Expression of brain-derived neurotrophic factor and p145TrkB affects survival, differentiation, and invasiveness of human neuroblastoma cells. Cancer Research. 1995;55(8):1798–1806. [PubMed] [Google Scholar]
- 23.Acheson A, Conover JC, Fandl JP, et al. A BDNF autocrine loop in adult sensory neurons prevents cell death [see comments] Nature. 1995;374(6521):450–453. doi: 10.1038/374450a0. [DOI] [PubMed] [Google Scholar]
- 24.Ho R, Eggert A, Hishiki T, et al. Resistance to chemotherapy mediated by TrkB in neuroblastomas. Cancer Res. 2002;62(22):6462–6466. [PubMed] [Google Scholar]
- 25.Jaboin J, Kim CJ, Kaplan DR, et al. Brain-derived neurotrophic factor activation of TrkB protects neuroblastoma cells from chemotherapy-induced apoptosis via phosphatidylinositol 3′-kinase pathway. Cancer Res. 2002;62(22):6756–6763. [PubMed] [Google Scholar]
- 26.Eggert A, Grotzer MA, Ikegaki N, et al. Expression of the neurotrophin receptor TrkA down-regulates expression and function of angiogenic stimulators in SH-SY5Y neuroblastoma cells. Cancer Res. 2002;62(6):1802–1808. [PubMed] [Google Scholar]
- 27.Middlemas DS, Kihl BK, Zhou J, et al. Brain-derived neurotrophic factor promotes survival and chemoprotection of human neuroblastoma cells. J Biol Chem. 1999;274(23):16451–16460. doi: 10.1074/jbc.274.23.16451. [DOI] [PubMed] [Google Scholar]
- 28.Nakagawara A, Liu XG, Ikegaki N, et al. Cloning and chromosomal localization of the human TRK-B tyrosine kinase receptor gene (NTRK2) Genomics. 1995;25(2):538–546. doi: 10.1016/0888-7543(95)80055-q. [DOI] [PubMed] [Google Scholar]
- 29.Brodeur GM, Pritchard J, Berthold F, et al. Revisions of the international criteria for neuroblastoma diagnosis, staging, and response to treatment. J Clin Oncol. 1993;11(8):1466–1477. doi: 10.1200/JCO.1993.11.8.1466. [DOI] [PubMed] [Google Scholar]
- 30.Brodeur GM, Seeger RC, Schwab M, et al. Amplification of N-myc in untreated human neuroblastomas correlates with advanced disease stage. Science. 1984;224(4653):1121–1124. doi: 10.1126/science.6719137. [DOI] [PubMed] [Google Scholar]
- 31.Look AT, Hayes FA, Shuster JJ, et al. Clinical relevance of tumor cell ploidy and N-myc gene amplification in childhood neuroblastoma: a Pediatric Oncology Group study. Journal of Clinical Oncology. 1991;9(4):581–591. doi: 10.1200/JCO.1991.9.4.581. [DOI] [PubMed] [Google Scholar]
- 32.Seeger RC, Brodeur GM, Sather H, et al. Association of multiple copies of the N-myc oncogene with rapid progression of neuroblastomas. N Engl J Med. 1985;313(18):1111–1116. doi: 10.1056/NEJM198510313131802. [DOI] [PubMed] [Google Scholar]
- 33.George RE, London WB, Cohn SL, et al. Hyperdiploidy plus nonamplified MYCN confers a favorable prognosis in children 12 to 18 months old with disseminated neuroblastoma: a Pediatric Oncology Group study. J Clin Oncol. 2005;23(27):6466–6473. doi: 10.1200/JCO.2005.05.582. [DOI] [PubMed] [Google Scholar]
- 34.Look AT, Hayes FA, Nitschke R, et al. Cellular DNA content as a predictor of response to chemotherapy in infants with unresectable neuroblastoma. N Engl J Med. 1984;311(4):231–235. doi: 10.1056/NEJM198407263110405. [DOI] [PubMed] [Google Scholar]
- 35.Shimada H, Ambros IM, Dehner LP, et al. The International Neuroblastoma Pathology Classification (the Shimada system) Cancer. 1999;86(2):364–372. [PubMed] [Google Scholar]
- 36.Shimada H, Chatten J, Newton WA, Jr, et al. Histopathologic prognostic factors in neuroblastic tumors: definition of subtypes of ganglioneuroblastoma and an age-linked classification of neuroblastomas. J Natl Cancer Inst. 1984;73(2):405–416. doi: 10.1093/jnci/73.2.405. [DOI] [PubMed] [Google Scholar]
- 37.Attiyeh EF, London WB, Mosse YP, et al. Chromosome 1p and 11q deletions and outcome in neuroblastoma. N Engl J Med. 2005;353(21):2243–2253. doi: 10.1056/NEJMoa052399. [DOI] [PubMed] [Google Scholar]
- 38.Maris JM, Weiss MJ, Guo C, et al. Loss of heterozygosity at 1p36 independently predicts for disease progression but not decreased overall survival probability in neuroblastoma patients: a Children’s Cancer Group study. Journal of Clinical Oncology. 2000;18(9):1888–1899. doi: 10.1200/JCO.2000.18.9.1888. [DOI] [PubMed] [Google Scholar]
- 39.Guo C, White PS, Weiss MJ, et al. Allelic deletion at 11q23 is common in MYCN single copy neuroblastomas. Oncogene. 1999;18(35):4948–4957. doi: 10.1038/sj.onc.1202887. [DOI] [PubMed] [Google Scholar]
- 40.Wang Q, Diskin S, Rappaport E, et al. Integrative genomics identifies distinct molecular classes of neuroblastoma and shows that multiple genes are targeted by regional alterations in DNA copy number. Cancer Res. 2006;66(12):6050–6062. doi: 10.1158/0008-5472.CAN-05-4618. [DOI] [PubMed] [Google Scholar]
- 41.Hoerndli FJ, Toigo M, Schild A, et al. Reference genes identified in SH-SY5Y cells using custom-made gene arrays with validation by quantitative polymerase chain reaction. Anal Biochem. 2004;335(1):30–41. doi: 10.1016/j.ab.2004.08.028. [DOI] [PubMed] [Google Scholar]
- 42.de Souza DR, Sanabani SS, de Souza AC, et al. Prognostic impact of MYCN, DDX1, TrkA, and TrkC gene transcripts expression in neuroblastoma. Pediatr Blood Cancer. 2011;56(5):749–756. doi: 10.1002/pbc.22823. [DOI] [PubMed] [Google Scholar]
- 43.Ho R, Minturn JE, Hishiki T, et al. Proliferation of human neuroblastomas mediated by the epidermal growth factor receptor. Cancer Res. 2005;65(21):9868–9875. doi: 10.1158/0008-5472.CAN-04-2426. [DOI] [PubMed] [Google Scholar]
- 44.Meyers MB, Shen WP, Spengler BA, et al. Increased epidermal growth factor receptor in multidrug-resistant human neuroblastoma cells. J Cell Biochem. 1988;38(2):87–97. doi: 10.1002/jcb.240380203. [DOI] [PubMed] [Google Scholar]
- 45.Kim CJ, Matsuo T, Lee KH, et al. Up-regulation of insulin-like growth factor-II expression is a feature of TrkA but not TrkB activation in SH-SY5Y neuroblastoma cells. Am J Pathol. 1999;155(5):1661–1670. doi: 10.1016/S0002-9440(10)65481-8. [DOI] [PMC free article] [PubMed] [Google Scholar]
- 46.Kiess W, Koepf G, Christiansen H, et al. Human neuroblastoma cells use either insulin-like growth factor-I or insulin-like growth factor-II in an autocrine pathway via the IGF-I receptor: variability of IGF, IGF binding protein (IGFBP) and IGF receptor gene expression and IGF and IGFBP secretion in human neuroblastoma cells in relation to cellular proliferation. Regul Pept. 1997;72(1):19–29. doi: 10.1016/s0167-0115(97)01026-4. [DOI] [PubMed] [Google Scholar]
- 47.Tacconelli A, Farina AR, Cappabianca L, et al. TrkA alternative splicing: a regulated tumor-promoting switch in human neuroblastoma. Cancer Cell. 2004;6(4):347–360. doi: 10.1016/j.ccr.2004.09.011. [DOI] [PubMed] [Google Scholar]
- 48.Evans AE, Kisselbach KD, Yamashiro DJ, et al. Antitumor activity of CEP-751 (KT-6587) on human neuroblastoma and medulloblastoma xenografts. Clinical Cancer Research. 1999;5(11):3594–3602. [PubMed] [Google Scholar]
- 49.Iyer R, Evans AE, Qi X, et al. Lestaurtinib enhances the antitumor efficacy of chemotherapy in murine xenograft models of neuroblastoma. Clin Cancer Res. 2010;16(5):1478–1485. doi: 10.1158/1078-0432.CCR-09-1531. [DOI] [PMC free article] [PubMed] [Google Scholar]
- 50.Zage PE, Graham TC, Zeng L, et al. The selective Trk inhibitor AZ623 inhibits brain-derived neurotrophic factor-mediated neuroblastoma cell proliferation and signaling and is synergistic with topotecan. Cancer. 2011;117(6):1321–1391. doi: 10.1002/cncr.25674. [DOI] [PubMed] [Google Scholar]