Abstract
Sales for a drug may be correlated with the prevalence of a condition treated by the drug. We found that state data revealed a strong spatial association and national data a strong temporal association between Clostridium difficile and oral vancomycin prescription sales, suggesting a new “signal” for detecting disease activity.
Background
Investigators have proposed using over-the-counter drug sales or prescribing data for disease surveillance, based on the hypothesis that sales data are strongly correlated with the prevalence of some underlying condition.1–4 In some respects, the relationship between oral vancomycin use and Clostridium difficile infection (CDI) promises to be an ideal application of utilizing prescription data for surveillance purposes: oral vancomycin is used almost exclusively to treat CDI. Thus, the purpose of this study was to determine whether oral vancomycin sales are a useful marker for Clostridium difficile activity and to investigate whether historical changes in the epidemiology of CDI were associated with changes in oral vancomycin prescribing.
Methods
The statistical analysis for this project consists of 2 parts: spatial and temporal. For the spatial analysis, we first obtained the number of CDI cases in 2006 for each of the 88 counties in Ohio;5 during the 2006 calendar year, the state of Ohio performed active surveillance for CDI.6 Next, we obtained oral vancomycin sales for each county over the same time period from IMS Health’s Xponent database. To investigate whether there is an association between the prevalence of CDI and oral vancomycin use after controlling for potential spatial correlations between adjacent counties, we used a generalized linear mixed model (GLMM) to characterize the relationship between the number of CDI cases in a county and the county-level use of oral vancomycin. We used the negative binomial distribution to model the random component (CDI cases), along with a log link function to relate the random and systematic components. We incorporated an offset variable in the systematic component, defined as the log of the county population size, to adjust for county population differences.
For our temporal analysis of the association between CDI and oral vancomycin sales, we extracted the monthly number of CDI cases from January 1999 to September 2007 from the Nationwide Inpatient Sample.7 We first identified all hospitalizations from 1999 to 2007 with a primary or secondary diagnosis of CDI. For ascertaining cases, we used the International Classification of Diseases, 9th Revision, Clinical Modification (ICD-9-CM) code 008.45 (intestinal infection due to C. difficile). We then aggregated all CDI cases by month to produce a national sample of CDI cases over time. CDI cases were assigned to a calendar month based on their admission date. To adjust for yearly changes in the sample, we applied the weights provided by the Agency for Healthcare Research and Quality (http://www.hcup-us.ahrq.gov/db/nation/nis/nistrends.jsp). For the same time period, we extracted the monthly sales of oral vancomycin from IMS Health’s Xponent database. Prescription data were derived from transaction records at retail pharmacies and were aggregated to the national level.
A cross-correlation function was computed for the CDI and oral vancomycin time series after both series were prewhitened. Prewhitening is used to avoid spurious cross correlations between 2 series due to the effects of common temporal patterns. For example, CDI and oral vancomycin may appear to be correlated simply because they both follow similar seasonal cycles. The prewhitening process removes the temporal patterns from either (or both) of the series by applying a common filter. Any correlation that persists after applying the filter is due to the factors above and beyond shared temporal behaviors.
Prior to prewhitening, we first differenced both the CDI and oral vancomycin series to remove the upward trends: that is, for each observation, we subtracted the observation one unit of time previously. The resulting series represent the incremental changes in the original series between adjacent time points. The 2 differenced series were then prewhitened based on an autoregressive (AR) model fitted to the differenced CDI series. We used Akaike’s Information Criterion to determine the appropriate order of the AR model.
We used the cross-correlation function to guide the construction of a prediction model for the differenced oral vancomycin series. Because vancomycin use may lag behind CDI cases (ie, because of treatment delays), our forecasting model uses oral vancomycin as the dependent series rather than CDI. Specifically, we formulated a time series regression model in which CDI serves as the explanatory series, and the errors are modeled using the seasonal autoregressive moving-average framework.
SAS, version 9.2 (SAS Institute), and R, version 2.7.1 (R Foundation for Statistical Computing), were used for all statistical analyses. The GLMM was conducted using the SAS procedure GLIMMIX, and the time series analysis was implemented through the TSA package in R.
Results
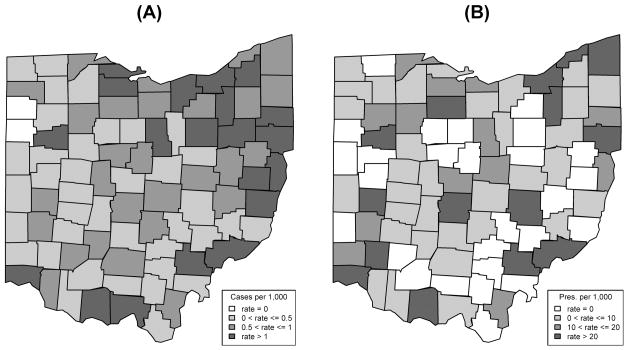
Figure 1A represents the county-level CDI rate in Ohio, with the numerator representing the number of CDI cases and the denominator representing the county population. Figure 1B displays the county-level rate of oral vancomycin use with the number of oral vancomycin prescriptions in the numerator and the county population size in the denominator. The simple Pearson correlation coefficient between oral vancomycin prescriptions and the number of CDI cases for the 88 counties in Ohio was 0.9255. Adjusting for population differences and potential spatial correlations between counties using our GLMM, we found a statistically significant and positive association between the number of oral vancomycin prescriptions and the number of CDI cases (P = .0202), indicating a higher number of oral vancomycin prescriptions in counties with more CDI.
Figure 1.
A, County-level rates of Clostridium difficile infection in Ohio for 2006. B, County-level rates of oral vancomycin use in Ohio for 2006.
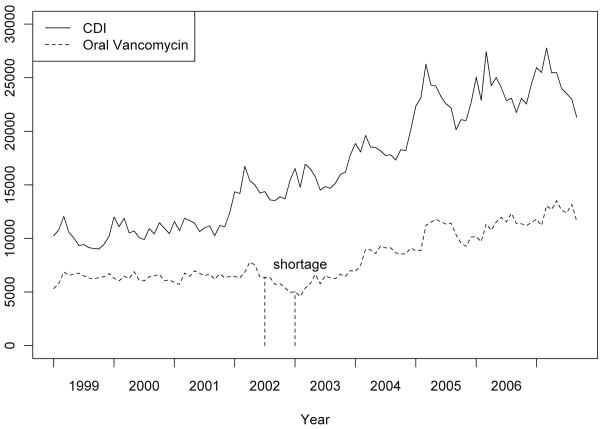
Figure 2 shows the monthly CDI and oral vancomycin series from January 1999 to September 2007. Both series remain relatively stationary between 1999 and 2001, with upward trends starting around 2002. The upward trend in the CDI series begins in early 2002, with a similar upward trend observed in the oral vancomycin series in late 2002. Thus, Figure 2 provides descriptive evidence that the increase in CDI drives the increase in oral vancomycin sales. Note that we may have observed an earlier upward trend in the oral vancomycin series; however, there was a production-based shortage of oral vancomycin. Based on both production data and IMS Health’s sales data, a shortage of 125-mg capsules began in July 2002 and ended in February 2003 (production started to improve in January 2003), and a shortage of 250-mg capsules began in July 2002 and ended in January 2003 (production started to improve in December 2002).
Figure 2.
Monthly Clostridium difficile infection (CDI) cases and oral vancomycin use series from January 1999 to September 2007. The solid line represents the monthly number of CDI patients from the Nationwide Inpatient Sample, and the dashed line represents the monthly sales of oral vancomycin from IMS Health’s Xponent database. Note that there is a production shortage for oral vancomycin between July 2002 and January 2003.
Our forecasting model for predicting oral vancomycin use included a seasonal autoregressive component (with a seasonal period of 12 months) and concurrent CDI activity. For the concurrent differenced CDI series, the regression coefficient estimate is positive and highly statistically significant (P < .0001), indicating that the increase in CDI cases is associated with a simultaneous increase in oral vancomycin use. The residuals for the final model passed diagnostic checks for white noise.
Discussion
Based on strong statistical relationships between oral vancomycin use and C. difficile activity, we propose a novel and relatively inexpensive form of surveillance for a disease of increasing public health importance. We demonstrated both a spatial and a temporal association between CDI and oral vancomycin prescription sales. Given the limitations of current CDI surveillance efforts, our results suggest a new “signal” for detecting changes in CDI epidemiology.
There are several limitations to our study. First, our study is ecological; we do not use individual-level data to confirm that each prescription identifies a case. While it would be ideal to know whether each prescription filled was received by an individual with CDI, such data is difficult to obtain and validate even with individual medical chart reviews. However, the single ICD-9-CM code for CDI surveillance has demonstrated both a high sensitivity and specificity.8 Second, oral vancomycin is not the only drug used to treat CDI. Indeed, metronidazole is a commonly recommended initial treatment for CDI. As a result, we are detecting only a fraction of overall CDI treatments by focusing on oral vancomycin sales. Third, our vancomycin sales data are limited to outpatient prescribing only, and our CDI data is limited to inpatient data (for our time series analysis). Fourth, some experts suggest that oral vancomycin should be reserved for more severe cases or recurrent cases.9 Thus, by measuring the use of oral vancomycin, we may be primarily detecting an increase in severe cases. Fifth, intravenous vancomycin can be delivered orally to treat CDI, and our sales data do not include these prescriptions. Finally, new medications to treat CDIs and/or changes in pricing may make oral vancomycin use more or less common, perhaps changing its correlation with disease activity.
Despite these limitations, oral vancomycin seems to be a reasonable proxy for C. difficile disease activity and therefore a promising supplement to existing and future C. difficile surveillance efforts. Although other sources of surveillance for C. difficile are emerging, the coverage of some of these data is limited. In contrast, sales data are available at the zip code level and are available across states and counties. Thus, changes in prescribing should be viewed as a possible signal for a change in practice and/or possibly a change in the epidemiology (ie, incidence or severity) of C. difficile.
Acknowledgments
We thank ViroPharma for providing vancomycin capsules sales data that were used for some of the analysis in this study.
Financial support. This work was in part supported by the Robert Wood Johnson Foundation Pioneer Portfolio, through the Extending the Cure Project. Support for this research was also provided by a National Institutes of Health Career Investigator Award (research grant K01 AI75089) to P.M.P.
Footnotes
Potential conflicts of interest. All authors report no conflicts of interest relevant to this article.
References
- 1.Proctor ME, Blair KA, Davis JP. Surveillance data for waterborne illness detection: an assessment following a massive waterborne outbreak of Cryptosporidium infection. Epidemiol Infect. 1998;120:43–54. doi: 10.1017/s0950268897008327. [DOI] [PMC free article] [PubMed] [Google Scholar]
- 2.Das D, Metzger K, Heffernan R, Balter S, Weiss D, Mostashari F. Monitoring over-the-counter medication sales for early detection of disease outbreaks—New York City. MMWR Morb Mortal Wkly Rep. 2005;54(suppl):41–46. [PubMed] [Google Scholar]
- 3.Vergu E, Grais RF, Sarter H, et al. Medication sales and syndromic surveillance, France. Emerg Infect Dis. 2006;12:416–421. doi: 10.3201/eid1203.050573. [DOI] [PMC free article] [PubMed] [Google Scholar]
- 4.Edge VL, Pollari F, Lim G, et al. Syndromic surveillance of gastrointestinal illness using pharmacy over-the-counter sales: a retrospective study of waterborne outbreaks in Saskatchewan and Ontario. Can J Public Health. 2004;95:446–450. doi: 10.1007/BF03403991. [DOI] [PMC free article] [PubMed] [Google Scholar]
- 5.Ohio Department of Health. Final report for rates of Clostridium difficile for Ohio hospitals and nursing homes. Columbus, OH: Ohio Department of Health; January 1–December 31, 2006. [Accessed February 1, 2008.]. http://www.odh.ohio.gov/alerts/cdiff1.aspx. [Google Scholar]
- 6.Campbell RJ, Giljahn L, Machesky K, et al. Clostridium difficile infection in Ohio hospitals and nursing homes during 2006. Infect Control Hosp Epidemiol. 2009;30:526–533. doi: 10.1086/597507. [DOI] [PubMed] [Google Scholar]
- 7.Agency for Healthcare Research and Quality. Nationwide inpatient sample (NIS) healthcare cost and utilization project. Washington, DC: Agency for Healthcare Research and Quality; [Accessed February 19, 2010]. http://www.hcup-us.ahrq.gov/nisoverview.jsp. [Google Scholar]
- 8.Dubberke ER, Reske KA, McDonald LC, Fraser VJ. ICD-9 codes and surveillance for Clostridium difficile–associated disease. Emerg Infect Dis. 2006;12:1576–1579. doi: 10.3201/eid1210.060016. [DOI] [PMC free article] [PubMed] [Google Scholar]
- 9.Zar FA, Bakkanagari SR, Moorthi KM, Davis MB. A comparison of vancomycin and metronidazole for the treatment of Clostridium difficile–associated diarrhea, stratified by disease severity. Clin Infect Dis. 2007;45:302–307. doi: 10.1086/519265. [DOI] [PubMed] [Google Scholar]


