Abstract
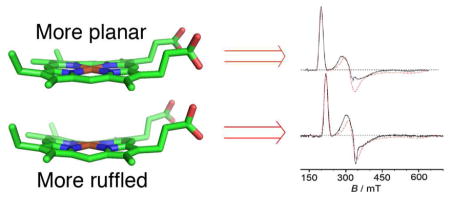
Electron paramagnetic resonance (EPR) spectra of variants of Hydrogenobacter thermophilus cytochrome c552 (Ht c-552) and Pseudomonas aeruginosa cytochrome c551 (Pa c-551) are analyzed to determine the effect of heme ruffling on ligand-field parameters. Mutations introduced at positions 13 and 22 in Ht c-552 were previously demonstrated to influence hydrogen bonding in the proximal heme pocket and to tune reduction potential (Em) over a range of 80 mV [Michel, L. V.; Ye, T.; Bowman, S. E. J.; Levin, B. D.; Hahn, M. A.; Russell, B. S.; Elliott, S. J.; Bren, K. L., Biochemistry 2007, 46, 11753–11760]. These mutations are shown here to also increase heme ruffling as Em decreases. The primary effect on electronic structure of increasing heme ruffling is found to be a decrease in the axial ligand-field term Δ/λ, which is proposed to arise from an increase in the energy of the dxy orbital. Mutations at position 7, previously demonstrated to influence heme ruffling in Pa c-551 and Ht c-552, are utilized to test this correlation between molecular and electronic structure. In conclusion, the structure of the proximal heme pocket of cytochromes c is shown to play a role in determining heme conformation and electronic structure.
Introduction
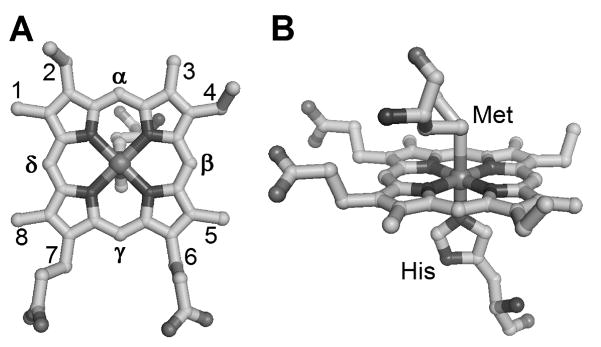
Iron protoporphyrin IX (heme) is a cofactor found in proteins that carry out electron Heme transfer, oxygen transport and storage, sensing, and a wide range of metabolic processes. Heme c is a widely distributed form of heme characterized by covalent attachment to two Cys in a Cys-X-X-Cys-His (CXXCH) motif in which His is an axial ligand to the iron of the heme.1 His/Met is a common ligand set for heme c and is seen in soluble cytochromes c, photosynthetic reaction centers, mitochondrial cytochromes c1, diheme cytochrome c peroxidases, and several dehydrogenases and cytochrome cd1 nitrite reductases.1, 2 Analysis of structures of hemes c with His/Met axial ligation reveals that the His imidazole ring is generally oriented along the porphyrin α-γ meso axis (Figure 1A).3 The axial Met side chain, in contrast, can adopt a number of orientations relative to the heme plane.4, 5 In some cases, Met fluxionality, a phenomenon that involves rapid interconversion between the R and S configurations at the Met δS, is observed.6, 7 Although heme proteins with His/Met axial ligation have been studied extensively using a variety of spectroscopic methods, detailed relationships between active-site structure, g values, and associated ligand-field components determined by spectroscopic methods such as EPR, Mössbauer, MCD, and NMR remain elusive for this important class of proteins.8–10
Figure 1.
Active-site structure of Pseudomonas aeruginosa cytochrome c551 (PDB: 351C11) showing (A) Fisher numbering system and axial His orientation and (B) Met and His axial ligands
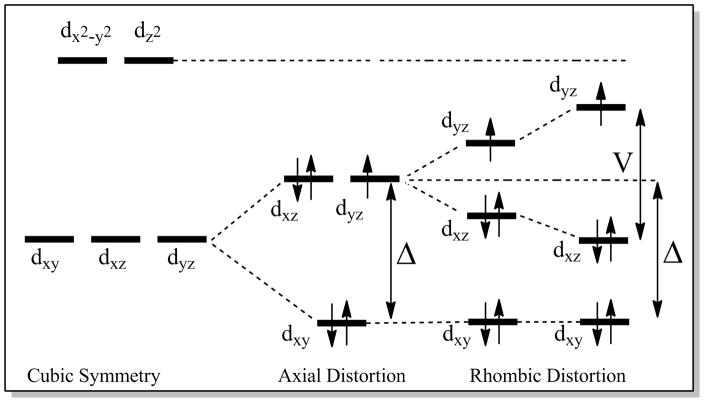
In contrast with heme with His/Met axial ligation, for heme with His/His axial ligation, relationships between heme active-site structure, g values, and NMR hyperfine shifts are well defined.12–14 In particular, it has been established that the angle between the two axial His imidazole planes plays a major role in determining the g-tensor and ligand-field parameters. If the two axial His planes are oriented perpendicular or nearly so to each other, a large gmax value (gmax > 3.3) and an axial EPR spectrum results, whereas a relatively small angle between the axial ligand planes yields a lower gmax value and a rhombic spectrum.12 The spin-orbit coupling constant (λ) and the experimentally observed g values can be used to estimate the rhombic (V) and axial (Δ) ligand-field terms,15 and thus the relative energies of the iron(III) d-orbitals (Figure 2); the ratio V/Δ is used as an indicator of the system’s rhombicity. The axial His imidazole plane orientations also correlate with the NMR hyperfine shifts of heme substituents, and thus for proteins with His/His axial ligation, interrelationships among properties of NMR spectra, EPR spectra, and active-site structure are well established.
Figure 2.
Energy diagram of the d-orbitals for the low-spin ferric heme c (S = 1/2) with (dxy)2(dxz)2(dyz)1 orbital occupancy. The axial (Δ) and rhombic (V) ligand-field parameters are shown.
Progress toward understanding how EPR parameters reflect properties of heme with His/Met axial ligation was made in a study of a series of cytochrome c variants in which linear relationships were identified between the average heme methyl chemical shift (<δ>) determined from NMR and both gmax and V/Δ determined from EPR. A structural basis for the observed changes was not established, but it was proposed to be associated with heme conformation, axial ligand strength and orientation, or a combination of these factors.9 In the present study, to better define the relationship between molecular and electronic structure of heme c with His/Met axial ligands, we report an analysis of EPR data on a series of mutants of small, soluble bacterial cytochromes c. The proteins targeted, Hydrogenobacter thermophilus cytochrome c552 (Ht c-552), and Pseudomonas aeruginosa cytochrome c551 (Pa c-551), constitute a homologous pair with 57% sequence identity. Mutations in these proteins have been made at positions 7, 13, and 22, which are located near the CXXCH heme attachment site (residues 12–16; Figure 3). Mutation of residue 7 has been shown to influence heme ruffling in both proteins,11, 16, 17 and mutations of residues 13 and 22 have been shown to affect the His-Fe(III) interaction and are proposed to influence heme ruffling.18, 19
Figure 3.
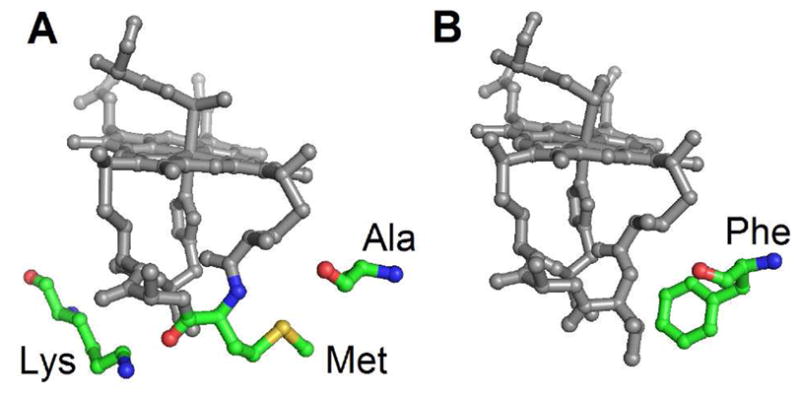
Mutation sites in this study. A) Ala7, Met13, and Lys22, shown in Ht c-552 (PDB: 1YNR20) B) Phe7, shown in Pa c-551 (PBD: 351C11). Residue 13 and 22 mutants of Ht c-552, and residue 7 mutants of both proteins, are analyzed herein.
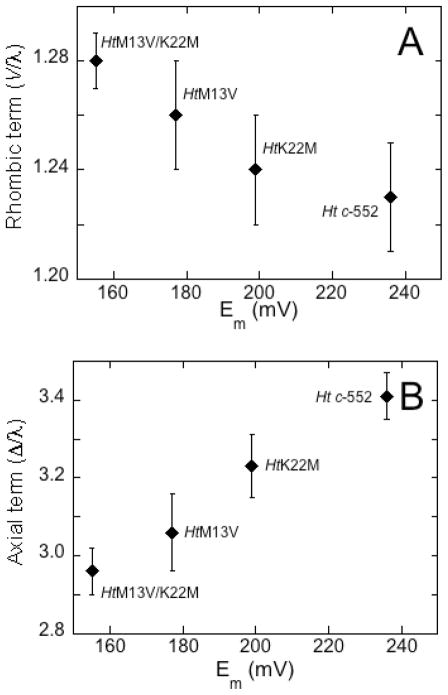
Ruffling is typically the dominant mode of out-of-plane distortion for heme c,21 and can be envisioned as twisting along the Fe-N(pyrrole) bonds in alternate directions (Figure 4).22 The X-ray crystal structure of the Phe7Ala mutant of Pa c-551 (PaF7A)17 indicates an increase in the out-of-plane displacement along the ruffling coordinate of 0.4 Å measured using normal coordinate structural decomposition analysis16, 22 of the X-ray crystal structures of Pa c-55111 and PaF7A.17 The basis for the change in ruffling may be the shortening of the hydrogen bond between the residue 7 backbone carbonyl oxygen and Cys12 amide NH in PaF7A relative to wild-type.16, 17 Conversely, NMR analysis has revealed that the A7F mutation in Ht c-552 decreases heme ruffling by ~0.1 Å.16 The M13V and K22M mutations in Ht c-552 have been demonstrated to increase His-Fe(III) bond strength, and have been proposed although not proven to influence heme ruffling.18, 19 These variants span an 80-mV range of Em, corresponding to an increase in His-Fe(III) bond strength as Em decreases (Ht c-552: 236 ± 2 mV, HtK22M: 199 ± 1: HtM13V: 177 ± 1 mV; HtM13V/K22M: 155 ± 2 mV).18 Position 7, 13, and 22 variants of Ht c-552 and position 7 variants of Pa c-551 are used here for a detailed investigation of the effects of His-Fe(III) bonding and heme ruffling on the electronic structure of heme proteins with His-Met axial ligation as revealed by EPR spectroscopy.
Figure 4.
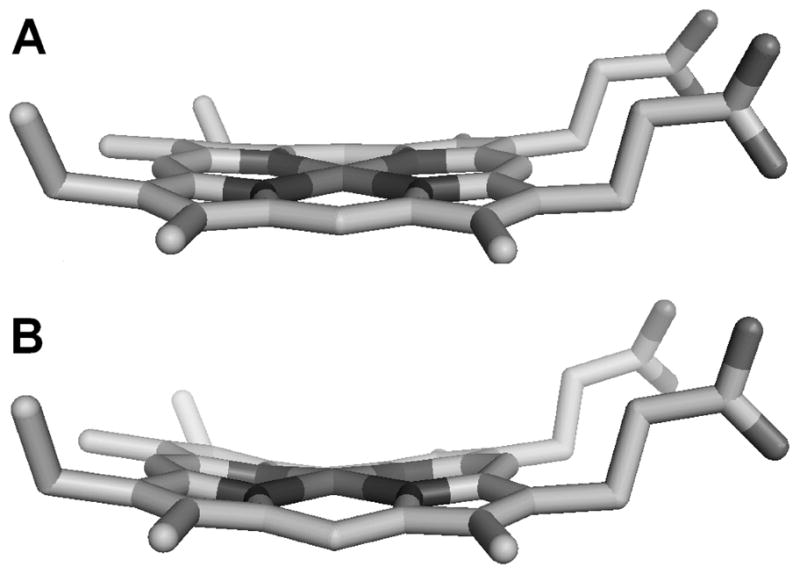
Structure of the heme from A) Pa c-551 (PBD: 351C),11 0.49 Å ruffling, and B) PaF7A (PBD: 2EXV),20 0.86 Å ruffling. Normal coordinate structure decomposition22 was used to evaluate amount of ruffling which is expressed as the amount of displacement of nuclei along the ruffling coordinate.
Experimental Section
Protein Expression and Purification
Expression of Ht c-552,23 HtM13V, HtK22M, HtM13V/K22M,18 and HtA7F16 was in E. coli BL21(DE3)Star (Invitrogen) containing pEC86 for overexpression of the E. coli cytochrome c maturation genes24 and the appropriate cytochrome c expression plasmid harboring the cytochrome structural gene with a signal sequence. The expression plasmids for Ht c-552 and variants are based on pET17b (Ampr) (Novagen) and utilize a modified N-terminal signal sequence from Thiobacillus versutus cytochrome c550 to direct secretion of the apoprotein to periplasm for maturation.25 Purification was as described.18 Expression of Pa c-551 and PaF7A also was in E. coli BL21(DE3)Star and used a pET17b-based plasmid containing the Pa c-551 gene along with its native signal sequence20, 26 in addition to pEC86. The QuikChange II site-directed mutagenesis kit (Stratagene) was used to prepare the F7A variant of Pa c-551. Purification of Pa c-551 and PaF7A was as described27 and yielded 15–20 mg protein/L of medium.
EPR Spectroscopy
EPR measurements on cytochrome c variants (protein concentration 200–300 μM, 50 mM HEPES, pH 7.5) were carried out in a dual-band X-cavity on a Bruker Elexsys 500E spectrometer characterized by a cavity quality factor (Q) > 4000 and equipped with a He–flow cryostat (ESR 900, Oxford Instruments). Spectra were recorded at a temperature of 9.0 ± 1.0 K and a microwave frequency of 9.663(8) GHz. To avoid saturation effects, the microwave power was calibrated for each protein sample and all EPR spectra reported here were obtained with a microwave power well below P1/2. Microwave powers used were: Ht c-552: 1.0 mW, HtK22M: 6.4 mW, HtM13V: 3.2 mW, HtMI3V/K22M: 0.63 mW, Pa c-551: 1.0 mW, PaF7A: 3.6 mW. Spectra were collected with a modulation amplitude of 0.7 mT, modulation frequency of 100 KHz, gain of 57 dB, sweep time of 168–335 sec, and time constant of 82–164 msec. For each sample, 2–6 scans were accumulated and averaged. EPR spectra were baseline corrected by subtraction of a scan of the cavity and the EPR tube containing buffer (keeping the same filling volume) recorded under identical conditions. The EPR simulation platform XSophe (ver. 1.1.3) and XeprView (ver. 1.2b.33) software were provided by Bruker.28
Determination of Ligand-Field Parameters
The ligand–field correlation analysis employed in this work follows the formalism introduced by Griffith29, 30 and developed by Taylor.15 Axial (Δ/λ) and rhombic (V/λ) ligand-field terms (Figure 2) were determined from the experimental g values according to the following equations:
| (1) |
| (2) |
Use of these equations requires that the normalization condition holds:15, 31
| (3) |
The spectra of the cytochrome c variants studied in this work fulfill the conditions expressed by Eq. 3. The calculated orbital coefficient values (a, b, c) and details of the procedure employed for estimation of errors in the ligand-field terms are provided in the Supporting Information.
Results
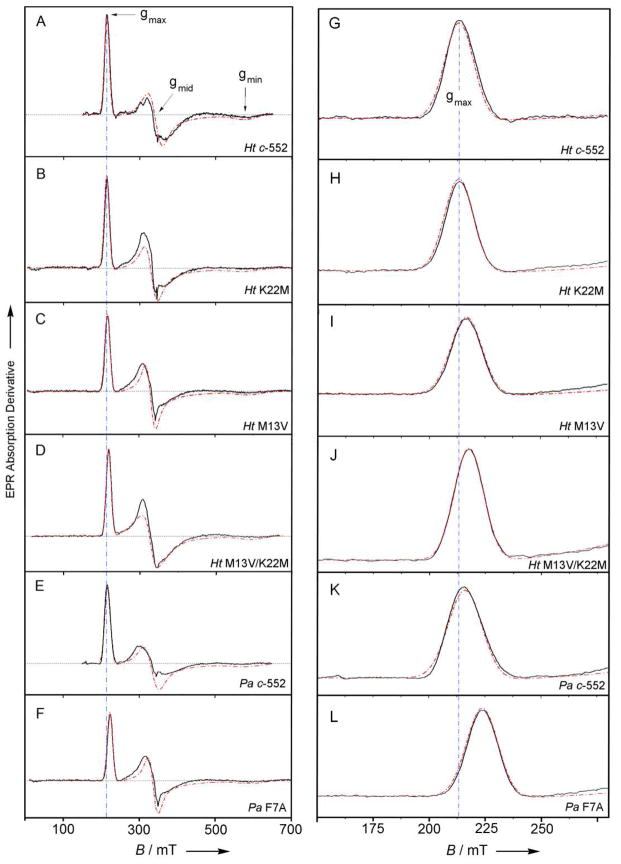
The experimentally determined g-tensor components and the derived ligand-field terms for the proteins in this study are presented in Table 1. The EPR spectra of all of the protein variants exhibit resonance signals consistent with low-spin (S = ½) ferric heme with a (dxy)2 (dxz, dyz)3 electronic configuration and moderate rhombic distortion (Figure 5, Figure S2, Table 1). For the Ht c-552 position 13 and 22 variants, a linear relationship between V/λ and Δ/λ values and Em (Figure 6) is observed. The position 13 and 22 variants of Ht c-552 show a linear increase in the rhombic term V/λ and decrease in the axial term Δ/λ as Em decreases; both factors contribute to the increase of rhombicity (V/Δ) over the series. However, the variation in V/λ values is relatively small, thus changes in Δ/λ dominate the d-orbital distribution. HtA7F, in contrast, shows minimal change in its EPR spectrum relative to wild-type.16 PaF7A exhibits a slightly higher rhombicity in comparison with Pa c-551, but with a larger change in Δ/λ than in V/λ (Table 1).
Table 1.
The g- and ligand-field (V, Δ) values derived from low-temperature X-band EPR experiments. The symbol ξ indicates the spin-orbit coupling constant (~ 400 cm−1).
| gmax | gmid | gmin | rhombic term V/λ | axial term Δ/λ | rhombicity V/Δ | |
|---|---|---|---|---|---|---|
| Ht c-552 | 3.23 | 2.04 | 1.19 | 1.23 ± 0.02 | 3.41 ± 0.06 | 0.36 ± 0.01 |
| HtK22M | 3.23 | 2.08 | 1.19 | 1.24 ± 0.02 | 3.23 ± 0.08 | 0.38 ± 0.01 |
| HtM13V | 3.19 | 2.09 | 1.17 | 1.26 ± 0.02 | 3.06 ± 0.10 | 0.41 ± 0.01 |
| HtM13V/K22M | 3.17 | 2.11 | 1.17 | 1.28 ± 0.01 | 2.96 ± 0.06 | 0.43 ± 0.01 |
| Ht c-552 | 3.20b | 2.08b | 1.20b | 1.3 ± 0.1b | 3.2 ± 0.2b | 0.39 ± 0.07b |
| HtA7F | 3.17b | 2.10b | 1.24b | 1.3 ± 0.1b | 3.3 ± 0.2b | 0.41 ± 0.07b |
| Pa c-551 | 3.20b | 2.06b | 1.23b | 1.28 ± 0.02b | 3.45 ± 0.03b | 0.37 ± 0.01b |
| PaF7A | 3.15 | 2.09 | 1.15 | 1.26 ± 0.02 | 2.94 ± 0.05 | 0.43 ± 0.01 |
Figure 5.
X-band EPR spectra of variants of Ht c-552 and Pa c-551: (A,G) Ht c-552, (B,H) HtK22M, (C,I) HtM13V, (D,J) HtMI3V/K22M, (E,K) Pa c-551, (F,L) PaF7A. Sample concentration was 200–300 μM protein in 50 mM HEPES, pH 7.5. Measurements were performed at a temperature of 9.0 ± 1.0 K. The dashed red lines represent simulated EPR envelopes. The dashed blue line is a guide to the eye and indicates the gmax value for Ht-c552. Panels G-L are expansions of the gmax line.
Figure 6.
Correlation between midpoint potentials and A) V/λ, B) Δ/λ, for Ht c-552 and its position 13 and 22 variants.
Discussion
The axial His-Fe(III) bond strength is proposed to be related to the amount of anionic (histidinate) character of the axial His which influences the reduction potential of peroxidases32 and cytochromes.19 For a given His orientation, histidinate character also is related to the strength of the hydrogen bond between the axial His δ1 NH and its hydrogen bond acceptor, which in cytochromes c is a proline carbonyl. Because a stronger bond from His to Fe(III) stabilizes the higher oxidation state, reduction potential will decrease with increasing His-Fe(III) bond strength. Accordingly, the position 13 and 22 mutants of Ht c-552 have been shown to have a stronger His-Fe(III) bond as Em is lowered. Note that these mutations have been shown to have a minimal effect on the properties of the Fe(II) state of Ht c-552.19 The His-Fe(III) and Met-Fe(III) interactions have significant σ-bonding character involving the Fe dz2 orbital. The predicted effect of enhanced σ-bonding between axial ligands and the iron is to increase the energy of the dz2 orbital, as illustrated in Figure 7A. The Fe dxz and dyz orbitals exhibit π-interactions with the Met δS lone pair, the porphyrin π-system, and the His π orbitals. Enhancing π interactions with the Fe dxz and dyz orbitals will raise their energies as shown in Figure 7B. Preferential destabilization of either the dxz or dyz orbital as Fe(III)-ligand π-bonding depends on the orientations of the axial ligands relative to the heme x, y plane.
Figure 7.
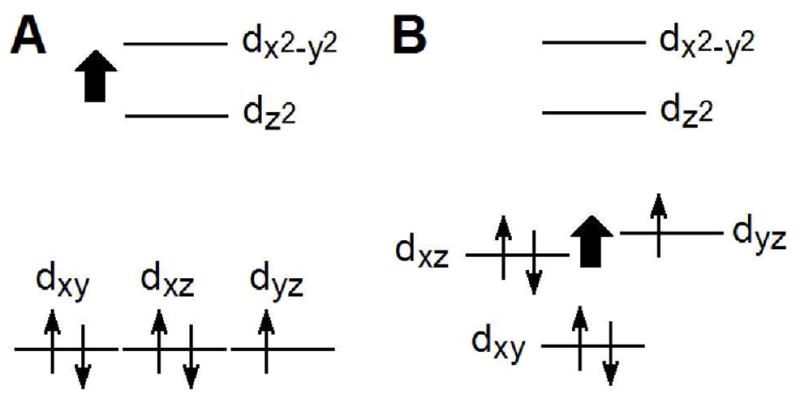
Effects of enhanced A) σ donation and B) π donation to iron on the relative energies of the Fe(III) d orbitals.
His-Fe(III) Bonding
Analysis of the EPR spectra of the position 13 and 22 variants reveals that the rhombic term V/λ, reflecting the difference in energy between the dxz and dyz orbitals, shows a small increase across the series: Ht c-552 < HtK22M < HtM13V < HtM13V/K22M (i.e., from higher to lower Em), whereas Δ/λ decreases. Can these changes be attributed to the effects of increasing His-Fe(III) bond strength that was previously established?19 The axial His is nearly aligned with the α,γ-meso carbons of the heme (Figure 1A).11, 17 Changes in the Fe(III)-His bond strength observed across this series thus are expected to affect the dxz and dyz energies similarly. The small amount of change in V/λ with increasing His-Fe(III) bond strength is consistent with the His being nearly, but not precisely, aligned with the α,γ-meso carbons (Figure 1A), because increasing the bond strength will result in more overlap between the π-system of the His with both the dxz and dyz orbitals, raising both energies to a similar extent. As a result, an increase in the axial His-Fe(III) interaction in this system is predicted to increase the axial term Δ/λ but exert little change on the rhombic term V/λ. However, we observe a decrease in the axial term with increasing His-Fe(III) bond strength. To explain this trend, we next consider the effects of variation of heme ruffling on electronic structure.
Heme Ruffling
The Pa c-551/PaF7A and the Ht c-552/HtA7F wild-type/mutant pairs are valuable for examining the effect of heme ruffling on ligand-field parameters as they exhibit changes in ruffling that have been established previously.16 EPR results for the Ht c-552/HtA7F pair and for Pa c-551 were reported elsewhere9, 16 and the EPR spectrum for PaF7A is reported here. Comparison of EPR results for Pa c-551 and PaF7A shows that the rhombic term V/λ does not change upon mutation whereas the axial term Δ/λ decreases significantly for the more ruffled F7A mutant. In Taylor’s model for the (dxy)2(dxz,dyz)3 configuration, Δ/λ = ½ (Exz + Eyz) − Exy, hence a decrease in Δ/λ reflects either 1) a decrease in the dxz,dyz orbital energies (Exz and Eyz) relative to Exy or 2) an increase in Exy relative to Exz and Eyz; a combination of these effects also is possible. In Taylor’s treatment, the S = 1/2 wavefunctions (|+>, |−>) are described as a weighted admixture of the dxy, dxz, and dyz orbitals with orbital coefficients a, b and c:
By utilizing the normalization condition Σ(a)2 + (b)2 + (c)2 = 1.00 ± 0.01 we can determine the coefficients for the dxy, dxz, and dyz components of the three-orbitals-one-hole wavefunctions. The result for Pa c-551 is that the spin functions contain ~86% dyz, 12% dxz and 2% dxy while in PaF7A they contain ~85% dyz, 12% dxz and 3% dxy. Thus the contributions of both the dyz and dxy orbitals are altered by mutation, although the dxy has the larger relative change.
The influence of heme conformation on the d orbital energies is mediated by interactions between the filled 3e(p) porphyrinate orbital and the dxz and dyz (d(π)) metal orbitals, and, if the macrocycle is ruffled, by interactions between the filled 3a2u(π) porphyrinate orbital and the dxy orbital (Figure 8). Those interactions depend on the relative energies of the d(π) metal and e(π) macrocycle frontier orbitals. Thus, the smaller axial term (Δ/λ) may indicate either 1) a weakening of the 3e(π)-d(π) interaction in PaF7A with respect to Pa c-551 to lower Eyz, or 2) an enhanced interaction between 3a2u(π) and dxy to raise Exy; a combination of these factors also is possible. From CW-EPR data alone we cannot determine which of these is the major contributor. In a recent DFT study, however, an increase in heme ruffling in low-spin heme with His/Met axial ligation was predicted to increase the energies of all three t2g-derived orbitals, although the effect was much more pronounced for dxy. The DFT predictions were validated by NMR spectroscopy performed on Ht c-552 and on Ht-A7F; the results demonstrated that the mutation decreases heme ruffling.16
Figure 8.
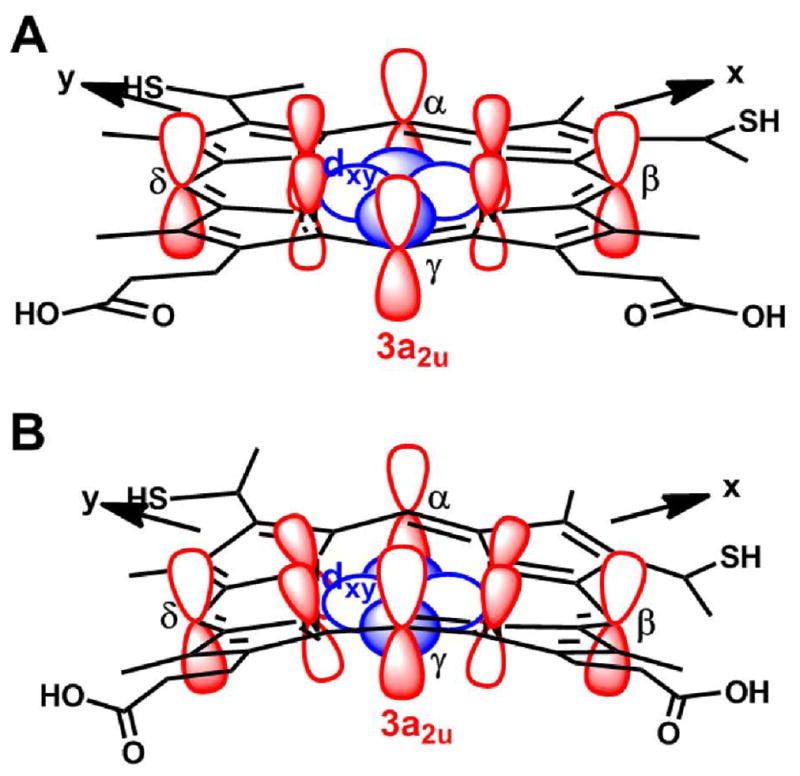
Illustration of the 3a2u orbital and the dxy orbital in A) planar heme (interaction not allowed), and B) ruffled heme (interaction allowed).
In contrast with the Pa c-551/PaF7A pair, HtA7F displays no significant difference in ligand-field terms from Ht c-552. EPR data are consistent with a small increase in Δ/λ for HtA7F, however, the change is within the margin of error. The small change in Δ/λ for HtA7F relative to wild-type may be attributed to the very small change in ruffling seen between these proteins (~0.1 Å, determined by NMR)16 relative to the Pa c-551/PaF7A pair (~0.4 Å, measured from crystal structures).11, 17 Thus, EPR may be sensitive to moderate or large heme ruffling differences between hemes with His/Met axial ligation although it may not reflect small heme ruffling changes that are detectable by NMR.16
As noted above, Δ/λ decreases across the series Ht c-552 > HtK22M > HtM13V > HtM13V/K22M as Em decreases, although an increase in the axial His-Fe(III) bond strength is predicted to result in an increase in the axial term Δ/λ. This result thus supports the hypothesis that heme ruffling increases across this series of variants with decreasing Em, resulting in a higher energy for dxy and a lower Δ/λ. The average value of the heme methyl chemical shifts shows an established trend with a change in ruffling, and the average heme methyl 1H chemical shift decreases across the series of position 13 and 22 Ht c-552 mutants as Em decreases, consistent with an increase in heme ruffling.16, 19, 33 The average heme methyl chemical shift also is sensitive to axial ligand donor properties. As the axial His becomes a better donor (more histidinate character), the average heme methyl shift moves upfield as a result of a decrease in porphyrin-to-Fe(π) spin delocalization as the His-to-Fe(III) σ-interaction increases.34 Thus both an increase in heme ruffling and in His-donor properties may be causes of the observed trend in heme methyl chemical shifts. However, as enhanced His-Fe(III) bonding is predicted to increase Δ/λ, we conclude that the differences observed in the EPR spectra among the variants arise primarily from differences in ruffling.
Structural Basis for Ruffling and Functional Implications
A clue to the structural basis for the trend in heme ruffling in the position 13 and 22 mutants may be found in the previously-reported effects of these mutations on the CXXCH pentapeptide. The M13V and K22M mutations were previously proposed to enhance packing on the proximal (axial His) side of the heme. Accordingly, these mutations were found to increase the rigidity of the proximal heme pocket. The backbone HN protons of Cys15 and His16 hydrogen bond with the Cys12 carbonyl oxygen (Figure 9), and the persistence of these interactions has been probed by hydrogen-deuterium exchange NMR.18 In HtM13V, HtK22M, and HtM13V/K22M, the backbone HN protons of Cys15 and His16 show increased protection from exchange with solvent, with amount of protection generally increasing as Em decreases.18 This result is interpreted to indicate a more locally stable or rigid CXXCH peptide backbone in the lower-potential mutants with enhanced polypeptide packing near the axial His. Studies of microperoxidase heme peptides derived from horse cytochrome c have previously demonstrated that strengthening hydrogen bonding within the CXXCH segment enhances heme ruffling.35 Thus, we propose that enhanced hydrogen bonding within the CXXCH pentapeptide backbone contributes to increasing heme ruffling in these mutants.
Figure 9.
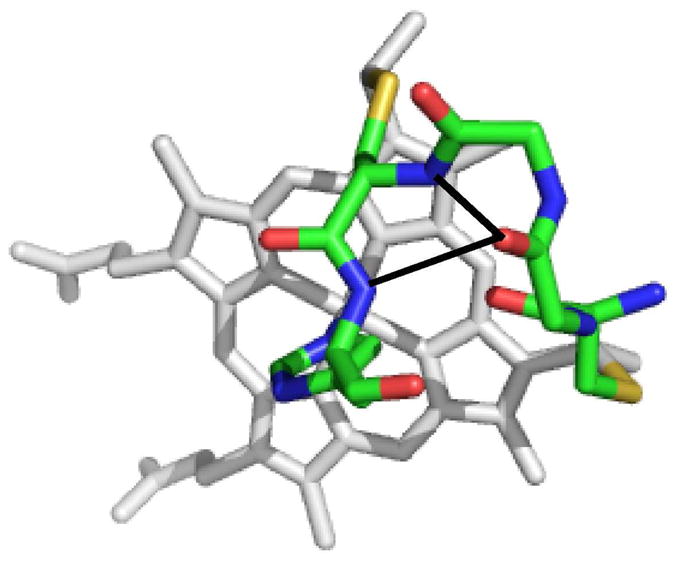
Structure of the heme and the residues 12–16 in Ht c-552 (PDB: 1YNR).20 The hydrogen-bonding interactions from Cys12(CO) to Cys15(HN) and His16 (HN) proposed to play a role in modulating CXXCH rigidity and heme ruffling are shown with black lines. The side chains of residues 13 and 14 are omitted for clarity.
Across the series of position 13 and 22 mutants, moving from higher to lower Em, we propose that both heme ruffling and His-Fe(III) bond strength are enhanced. Might axial bond strength and heme ruffling be linked to each other? The effect of heme ruffling on axial bond strength has been explored in a study of ligand-binding affinities of ferric myoglobins reconstituted with heme derivatives showing different amounts of ruffling. Heme distortion is proposed to increase the Fe(III)-His bond strength in that work.36 In contrast, DFT calculations on a Met-His-coordinated heme predict a negligible effect of heme ruffling on Fe(III)-His bond length with a bond length change of less than 0.001 Å upon a change of ruffling of 0.7 Å (see supporting information of ref. 16). However, it is possible that protein structure-related factors affecting heme ruffling also directly affect the Fe(III)-His bond strength, or that changes in ruffling and bond strength are otherwise related to each other. In contrast with the analyses of Fe(III)-His bonding, a study of dioxygen binding to the highly distorted ferrous heme in Methanosarcina acetivorans protoglobin indicates that out-of-plane distortions decrease dioxygen affinity, whereas in-plane distortions may increase or decrease affinity.37 Consistent with the conclusions on protoglobin, a study of the effect of heme ruffling on ligand-binding to Thermoanaerobacter tencongenesis heme nitric oxide/oxygen binding domain suggests that flattening of the heme increases the proximal bond strength of the Fe(II)-O2 complex.38 How ruffling affects axial ligand interactions remains a question for further research, but likely depends on heme oxidation state, electronic structure, and the nature of the ligand(s).
In a previous study, changes in heme ruffling were proposed to influence whether highly axial low-spin (HALS)-type (high gmax) or rhombic EPR spectra of Met-His coordinated cytochromes c were observed.9 The analysis here indicates a limited effect of heme ruffling on gmax. A gmax value difference of only 0.05 is observed between Pa c-551 and PaF7A despite the 0.4-Å change in the heme ruffling; the difference between the gmax values of wild-type Ht c-552 and HtM13V/K22M, the variant with the greatest difference in Em from wild-type, is only 0.06. Thus, changes exerted on EPR spectra by heme ruffling in these systems can not be the sole basis for the large range of gmax values exhibited by cytochromes.10 However, it is notable that Bacillus pasteurii cytochrome c553 has a low amount of ruffling for a cytochrome c (0.36 Å)39 and a large gmax signal (3.36).8
There has been considerable interest in the question of the functional relevance of covalent heme attachment in cytochromes c.1, 40, 41 One proposal is that covalent attachment provides means by which redox potential may be tuned, as hemes c display a wider range of potentials in nature than hemes b, which bind the polypeptide through coordinate bonds and noncovalent interactions.1, 42 The observation that mutations in and near the CXXCH motif influence heme ruffling and His-Fe(III) bonding, supports the hypothesis that covalent attachment, the identity of the variable residues within this motif, and interactions with this motif influence heme conformation, and thus heme c redox potential.
Supplementary Material
Synopsis.
Analysis of EPR spectra of cytochrome c variants in which proximal heme pocket residues are mutated reveals a relationship between g values and heme ruffling. The primary effect of increasing heme ruffling is found to be a decrease in the axial ligand-field term Δ/λ, proposed to arise from an increase in the energy of the dxy orbital. Thus, proximal heme pocket structure affects heme conformation and electronic structure.
Acknowledgments
This work was supported by The National Institutes of Health (NIH) of the United States of America Grant GM63170 (K.L.B.), the Research Council of Norway Grant 177661/V30 (K.K.A.). GZ thanks the support from the PEOPLE Marie Curie actions Intra European Fellowship within the 7th European Community Framework Program (PIEF-GA-2009-235237).
Footnotes
Supporting Information Available: Detailed description of the determination of ligand-field parameters from g-values and their errors, error distribution in the g-tensor and calculated ligand-field parameters (5 Tables), an illustration of the error analysis procedure and an expansion of the high-field region of EPR spectra of the protein variants with fits (2 Figures). This material is available free of charge via the Internet at http://pubs.acs.org.
References
- 1.Bowman SEJ, Bren KL. Nat Prod Rep. 2008;25:1118–1130. doi: 10.1039/b717196j. [DOI] [PMC free article] [PubMed] [Google Scholar]
- 2.Reedy CJ, Elvekrog MM, Gibney BR. Nucleic Acids Res. 2008;36:D307–D313. doi: 10.1093/nar/gkm814. [DOI] [PMC free article] [PubMed] [Google Scholar]
- 3.Fufezan C, Zhang J, Gunner MR. Proteins. 2008;73:690–704. doi: 10.1002/prot.22097. [DOI] [PMC free article] [PubMed] [Google Scholar]
- 4.Senn H, Keller RM, Wüthrich K. Biochem Biophys Res Commun. 1980;92:1362–1369. doi: 10.1016/0006-291x(80)90436-2. [DOI] [PubMed] [Google Scholar]
- 5.Moore GR, Pettigrew GW. Cytochromes c; Evolutionary, Structural, and Physicochemical Aspects. Springer-Verlag; Berlin: 1990. [Google Scholar]
- 6.Zhong L, Wen X, Rabinowitz TM, Russell BS, Karan EF, Bren KL. Proc Natl Acad Sci USA. 2004;101:8637–8642. doi: 10.1073/pnas.0402033101. [DOI] [PMC free article] [PubMed] [Google Scholar]
- 7.Bren KL, Kellogg JA, Kaur R, Wen X. Inorg Chem. 2004;43:7934–7944. doi: 10.1021/ic048925t. [DOI] [PubMed] [Google Scholar]
- 8.Zoppellaro G, Teschner T, Harbitz E, Schuenemann V, Karlsen S, Arciero DM, Ciurli S, Trautwein AX, Hooper AB, Andersson KK. ChemPhysChem. 2006;7:1258–1267. doi: 10.1002/cphc.200500693. [DOI] [PubMed] [Google Scholar]
- 9.Zoppellaro G, Harbitz E, Kaur R, Ensign AA, Bren KL, Andersson KK. J Am Chem Soc. 2008;130:15348–15360. doi: 10.1021/ja8033312. [DOI] [PMC free article] [PubMed] [Google Scholar]
- 10.Zoppellaro G, Bren KL, Ensign AA, Harbitz E, Kaur R, Hersleth HP, Ryde U, Hederstedt L, Andersson KK. Biopolymers. 2009;91:1064–1082. doi: 10.1002/bip.21267. [DOI] [PMC free article] [PubMed] [Google Scholar]
- 11.Matsuura Y, Takano T, Dickerson RE. J Mol Biol. 1982;156:389–409. doi: 10.1016/0022-2836(82)90335-7. [DOI] [PubMed] [Google Scholar]
- 12.Walker FA. Chem Rev. 2004;104:589–615. doi: 10.1021/cr020634j. [DOI] [PubMed] [Google Scholar]
- 13.Bertini I, Luchinat C, Parigi G, Walker FA. J Biol Inorg Chem. 1999;4:515–519. doi: 10.1007/s007750050337. [DOI] [PubMed] [Google Scholar]
- 14.Shokhirev NV, Walker FA. J Biol Inorg Chem. 1998;3:581–594. [Google Scholar]
- 15.Taylor CPS. Biochim Biophys Acta. 1977;491:137–149. doi: 10.1016/0005-2795(77)90049-6. [DOI] [PubMed] [Google Scholar]
- 16.Liptak MD, Wen X, Bren KL. J Am Chem Soc. 2010;132:9753–9763. doi: 10.1021/ja102098p. [DOI] [PMC free article] [PubMed] [Google Scholar]
- 17.Borgia A, Bonivento D, Travaglini-Allocatelli C, Di Matteo A, Brunori M. J Biol Chem. 2006;281:9331–9336. doi: 10.1074/jbc.M512127200. [DOI] [PubMed] [Google Scholar]
- 18.Michel LV, Ye T, Bowman SEJ, Levin BD, Hahn MA, Russell BS, Elliott SJ, Bren KL. Biochemistry. 2007;46:11753–11760. doi: 10.1021/bi701177j. [DOI] [PMC free article] [PubMed] [Google Scholar]
- 19.Bowman SEJ, Bren KL. Inorg Chem. 2010;49:7890–7897. doi: 10.1021/ic100899k. [DOI] [PMC free article] [PubMed] [Google Scholar]
- 20.Travaglini-Allocatelli C, Gianni S, Dubey VK, Borgia A, Di Matteo A, Bonivento D, Cutruzzolà F, Bren KL, Brunori M. J Biol Chem. 2005;280:25729–25734. doi: 10.1074/jbc.M502628200. [DOI] [PubMed] [Google Scholar]
- 21.Hobbs JD, Shelnutt JA. J Protein Chem. 1995;14:19–25. doi: 10.1007/BF01902840. [DOI] [PubMed] [Google Scholar]
- 22.Jentzen W, Song XZ, Shelnutt JA. J Phys Chem B. 1997;101:1684–1699. [Google Scholar]
- 23.Karan EF, Russell BS, Bren KL. J Biol Inorg Chem. 2002;7:260–272. doi: 10.1007/s007750100292. [DOI] [PubMed] [Google Scholar]
- 24.Arslan E, Schulz H, Zufferey R, Kunzler P, Thöny-Meyer L. Biochem Biophys Res Commun. 1998;251:744–747. doi: 10.1006/bbrc.1998.9549. [DOI] [PubMed] [Google Scholar]
- 25.Fee JA, Chen Y, Todaro TR, Bren KL, Patel KM, Hill MG, Gomez-Moran E, Loehr TM, Ai JY, Thony-Meyer L, Williams PA, Stura E, Sridhar V, McRee DE. Protein Sci. 2000;9:2074–2084. doi: 10.1110/ps.9.11.2074. [DOI] [PMC free article] [PubMed] [Google Scholar]
- 26.Wen X, Bren KL. Inorg Chem. 2005;44:8587–8593. doi: 10.1021/ic050976i. [DOI] [PubMed] [Google Scholar]
- 27.Russell BS, Zhong L, Bigotti MG, Cutruzzolà F, Bren KL. J Biol Inorg Chem. 2003;8:156–166. doi: 10.1007/s00775-002-0401-z. [DOI] [PubMed] [Google Scholar]
- 28.Hanson GR, Gates KE, Noble JC, Griffin M, Mitchell A, Benson S. J Inorg Biochem. 2004;98:903–916. doi: 10.1016/j.jinorgbio.2004.02.003. [DOI] [PubMed] [Google Scholar]
- 29.Griffith JS. Nature. 1957;180:30–31. doi: 10.1038/180030a0. [DOI] [PubMed] [Google Scholar]
- 30.Griffith JS. Mol Phys. 1971;21:135–139. [Google Scholar]
- 31.Castner TJ., Jr Phys Rev. 1959;115:1506–1515. [Google Scholar]
- 32.Poulos TL. J Biol Inorg Chem. 1996;1:356–359. [Google Scholar]
- 33.Shokhireva TK, Shokhirev NV, Berry RE, Zhang HJ, Walker FA. J Biol Inorg Chem. 2008;13:941–959. doi: 10.1007/s00775-008-0381-8. [DOI] [PubMed] [Google Scholar]
- 34.Chacko VP, Lamar GN. J Am Chem Soc. 1982;104:7002–7007. [Google Scholar]
- 35.Ma JG, Vanderkooi JM, Zhang J, Jia SL, Shelnutt JA. Biochemistry. 1999;38:2787–2795. doi: 10.1021/bi982332a. [DOI] [PubMed] [Google Scholar]
- 36.Neya S, Suzuki M, Hoshino T, Ode H, Imai K, Komatsu T, Ikezaki A, Nakamura M, Furutani Y, Kandori H. Biochemistry. 2010;49:5642–5650. doi: 10.1021/bi1003553. [DOI] [PubMed] [Google Scholar]
- 37.Bikiel DE, Forti F, Boechi L, Nardini M, Javier Luque F, Martí MA, Estrin DA. J Phys Chem B. 2010;114:8536–8543. doi: 10.1021/jp102135p. [DOI] [PubMed] [Google Scholar]
- 38.Olea C, Boon EM, Pellicena P, Kuriyan J, Marletta MA. ACS Chem Biol. 2008;3:703–710. doi: 10.1021/cb800185h. [DOI] [PMC free article] [PubMed] [Google Scholar]
- 39.Benini S, Gonzalez A, Rypniewski WR, Wilson KS, Van Beeumen JJ, Ciurli S. Biochemistry. 2000;39:13115–13126. doi: 10.1021/bi000402j. [DOI] [PubMed] [Google Scholar]
- 40.Stevens JM, Daltrop O, Allen JWA, Ferguson SJ. Acc Chem Res. 2004;37:999–1007. doi: 10.1021/ar030266l. [DOI] [PubMed] [Google Scholar]
- 41.Allen JWA, Barker PD, Daltrop O, Stevens JM, Tomlinson EJ, Sinha N, Sambongi Y, Ferguson SJ. Dalton T. 2005:3410–3418. doi: 10.1039/b508139b. [DOI] [PubMed] [Google Scholar]
- 42.Zheng Z, Gunner MR. Proteins. 2009;75:719–734. doi: 10.1002/prot.22282. [DOI] [PMC free article] [PubMed] [Google Scholar]
Associated Data
This section collects any data citations, data availability statements, or supplementary materials included in this article.


