Abstract
A dual modality computed mammotomography (CmT) and single photon emission computed tomography (SPECT) system for dedicated 3D breast imaging is in development. Using heavy K-edge filtration, the CmT component narrows the energy spectrum of the cone-shaped x-ray beam incident on the patient’s pendant, uncompressed breast. This quasi-monochromatic beam is expected to improve discrimination of tissue with similar attenuation coefficients while restraining absorbed dose to below that of dual view mammography. Previous simulation studies showed the optimal energy that maximizes dose efficiency for a 50/50% adipose/glandular breast is between 30 and 40 keV. This study experimentally validates these results using pre-breast and post-breast spectral measurements made under tungsten tube voltages between 40 and 100 kVp using filter materials with K-edge values ranging from 15 to 70 keV. Different filter material thicknesses are used, approximately equivalent to the 200th and 500th attenuating value layer (VL) thickness. Cerium (K = 40.4 keV) filtered post-breast spectra for 8–18 cm breasts are measured for a range of breast compositions. Figures of merit include mean beam energy, spectral full-width at tenth-maximum, beam hardening and dose for the range of breast sizes. Measurements corroborate simulation results, indicating that for a given dose, a 200th VL of cerium filtration may have optimal performance in the dedicated mammotomography paradigm.
1. Introduction
A compact, versatile, cone-beam computed mammotomography (CmT) system dedicated to breast imaging is in development and has been described elsewhere (Bradshaw et al 2003, McKinley et al 2004a, Tornai et al 2005a). This CmT system will ultimately be integrated with a single photon emission computed tomography (SPECT) system on a single, manoeuvrable gantry to produce a dual-modality dedicated breast imaging system that provides fine resolution structural and functional information to be used in the detection of breast cancer. Previous simulation-based studies examined the feasibility, benefits and potential operating parameters of a novel CmT beam filtration scheme using the K-edge of the filter material to produce a near monochromatic x-ray spectrum (McKinley et al 2004a, 2004b). To allow for CmT imaging of the breast at dose levels equivalent to those of standard dual-view mammography, the mean energy of the incident x-ray beam should be optimized. Prior studies, simulating a pure monochromatic x-ray beam imaging an uncompressed 15 cm breast of 50–50% adipose–glandular compositionwith a 5 cmembedded lesion, indicated that dose efficiency is optimized when using a beam with a mean energy between 30 and 40 keV (McKinley 2006). Our simulation study corroborates an earlier one (Chen and Ning 2002). The purpose of this paper is to validate results of those earlier simulation studies, compare measured spectra for several different filter materials, some common and other more novel materials for x-ray imaging, and additionally demonstrate the practicability of implementing the heavy K-edge filtration scheme in our system.
While reducing absolute dose delivered to the patient and maximizing dose efficiency, the value of a quasi-monochromatic beam for 3D breast imaging lies in its anticipated ability to separate tissues with closely matching attenuation coefficients, thus allowing for improved discrimination between low-contrast objects (1–2% difference) such as cancerous tissue and surrounding normal breast tissue (Hammerstein et al 1979). In addition, separation of such small intrinsic contrast differences with the spectrally narrow beam also enables the possibility for absolute tissue attenuation coefficient quantification, hence non-invasive in vivo tissue characterization. Patients, for whom 2D x-ray mammography has proven to be inconclusive, such as those with large and mammographically dense breasts, may thus receive earlier and improved detection of tumours that might otherwise progress untreated.
Other methods of producing quasi-monochromatic x-ray beams exist, for example using synchrotron light sources or Bragg diffraction (Chapman et al 1997, Gambaccini et al 1999, Li et al 2003). Synchrotron light sources have so far proven to be too expensive and impractical for routine medical imaging applications. Devices implementing Bragg diffraction techniques produce only a fan beam of x-rays that introduce other complexities in the design of a CmT system including the necessity to move the object relative to the beam. This increases both patient scan times and the likelihood of image artefacts due to mechanical and patient motion. In contrast to those techniques, in this paper we describe a practicable filtration system to produce quasi-monochromatic x-rays in a full 3D cone beam useful in themammotomography paradigm.
2. Experimental methods
2.1. Spectral measurement equipment
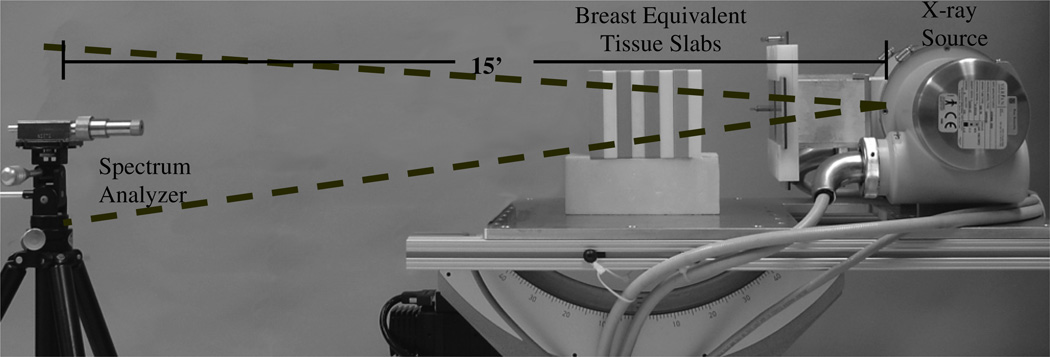
Transmission source x-rays were generated using a Rad-94 rotating tungsten (Cp = 138 J kg−1 °C) x-ray source (Varian Medical Systems, Salt Lake City, UT) as shown in figure 1, with nominal Al intrinsic filtration. An x-ray generator, model CPX160 (Electromed Inc., Montreal, PQ), provides the voltage required by the x-ray source. The maximum power output is 60 kW for a tube potential range of 40–150 kVp and a current range of 10–800 mA. The design of the CmT imaging system has a compact source-to-image (SID) distance of 55 cm, and the pendant breast of the patient is centred at the source-to-object distance (SOD) of 35 cm from the x-ray tube focal spot (Tornai et al 2005a).
Figure 1.
Experimental setup showing the x-ray source and partially collimated cone beam passing through slabs of breast equivalent tissue (resting on styrofoam) towards the spectrum analyser. Note that the actual separation between the x-ray source focal spot and detector windowis approximately 15 ft in order to reduce flux. For several measurements, the breast slabs were removed. Note that the image is not to scale.
The CsI(Tl) Paxscan 2520 (VarianMedical Systems, Salt Lake City, UT) imaging detector normally used for CmT was removed from the x-ray beam path. The spectrum analyser is a XR-100T-CdTe high performance x-ray and gamma-ray detector (Amptek Inc., Bedford, MA) with a 3 × 3 × 1 mm3 cadmium telluride (CdTe) detector mounted on a thermoelectric cooler, possessing a typical noise resolution of <1.2 keV full-width at half-maximum (FWHM) and a detection efficiency at energies between 15 and 70 keV of just <100%. This uniform low-energy absorption efficiency of CdTe differs somewhat from that of CsI, due to the decreased efficiency just below the Cs (kedge = 35.98 keV) and I (kedge = 33.17 keV) K-edge energies. The efficiency between 30 and 36 keV ranges from 85 to 90%, improving with lower energies. Furthermore, there is a >95% absorption efficiency for CsI between 36 and 55 keV, which more than adequately spans the energy range of interest for the quasi-monochromatic beams.
Calibration was carried out using an 125I source with observable 27, 31 and 35 keV peaks. The x-ray flux incident to the detector can be modified by placing collimated tungsten apertures of various diameters (25–2000 µm) in front of the thin beryllium detector window. This ensures that the observed count rate for a given x-ray pulse lay well below the maximum rate (20 kcps) of the detector. To additionally reduce the flux incident on the detector face and thus avoid saturating the acquisition electronics, the detector was placed approximately 15 ft away from the x-ray focal spot. This separation had the additional effect of minimizing the detection of scattered x-rays. Other means to reduce incident flux are being investigated (Maeda et al 2005).
Aligning the detector with the x-ray tube anode was accomplished visually using a pinhole laser inserted into the detector collimator housing, adjusting the direction until the laser shone directly onto the anode. Additional adjustments were made to ensure the detector face lay along the central ray of the incident x-ray beam, as slight misalignments can lead to reduced detection of source flux. To account for geometric misalignments, hence loss in observed flux, the integral measured spectra are normalized to the simulated exposure of the tube (described in the following subsection) for the purpose of analysis. Studies with a RadCal exposure meter (model 1515, RadCal Corp., Monrovia, CA) have previously confirmed that the measured exposure at isocentre is equivalent to simulation derived exposure values. Any discrepancy between the exposure determined from the integral measured spectrum at 15 ft and the exposure measured at isocentre is partially due to the ~15% beam attenuation in air (at an assumed beam energy of 35 keV, µ air = 3.02 × 10⁻¹ cm2 g−1 and ρ air = 1.21 × 10⁻³ g cm−3 (National Institute of Standards and Technology)), given the large separation distance between source and spectrum analyser.
2.2. Simulation code
X-ray spectra were simulated using xSpect, a simulation code developed at Henry Ford Health Systems (Detroit, MI) and based on a semi-empirical x-ray generation model. This has been described in detail elsewhere (McKinley et al 2004b). Scatter-free spectra were simulated from a tungsten target having nominal intrinsic oil and aluminium filtrationwith tube potentials ranging from 40 to 100 kVp in 20 kV increments and detected with an ideal 100% efficient detector. Also simulated were filtered x-ray beam spectra produced using filters of various materials and attenuation value layer (VL) thicknesses shown in table 1, and described in the following subsection.
Table 1.
Filter materials and actual thicknesses used to acquire pre-breast spectra.
| Elemental filter |
Z | Purity (%) |
Density (g cm−3) |
K-edge energy (keV) |
~200th VL (mm) |
Actual attenuation value layer at 60 kVp |
~500th VL (mm) |
Actual attenuation value layer at 60 kVp |
|---|---|---|---|---|---|---|---|---|
| Aluminiuma | 13 | 97.9 | 2.70 | 1.56 | 23.96 | 192 | 30.62 | 454 |
| Copperb | 29 | 99.9 | 8.92 | 8.98 | 1.02 | 227 | 1.30 | 447 |
| Silverb | 47 | 99.998 | 10.49 | 25.51 | 0.30 | 134 | 0.40 | 437 |
| Ceriumc | 58 | 99.9 | 6.89 | 40.44 | 0.71 | 196 | 0.91 | 536 |
| Neodyniumc | 60 | 99.9 | 6.80 | 43.57 | 0.70 | 185 | 0.93 | 515 |
| Europiumc | 63 | 99.9 | 5.24 | 48.52 | 1.00 | 222 | 1.25 | 476 |
| Tungstenb | 74 | 99.95 | 19.25 | 69.53 | 0.20 | 200 | 0.25 | 384 |
6061 aluminium.
Alfa Aesar, Ward Hill, MA.
Santoku America Inc., Tolleson, AZ.
While there are several outputs from an xSpect simulation including the incident and (scatter-free) transmitted energy spectra, exposure and noise, absorbed dosewas not an explicit xSpect output parameter. Thus, absorbed dose was calculated for a 50/50% adipose/glandular breast composition based on previously derived Monte Carlo based dose conversion tables for our specific CmT geometry (Boone 2002). Dose tables were generated for 50/50% breast composition for breast sizes ranging from 10 to 18 cm (including a 0.5 cm thick skin layer), with dose coefficients in units of µGy/106 photons mm−2 in 1 keV increments.
These coefficients are therefore normalized to a fixed number of photons and can be used together with xSpect derived and measured (see the next section) spectral data (in units of photons or detected counts mm−2 keV−1) to calculate glandular dose. Glandular dose is derived based on the assumption that glandular tissue dose is the most important consideration in assessing ionizing radiation risk to the patient.
2.3. Pre-breast spectral acquisitions: filter measurements
Pre-breast spectra were acquired using the seven different filter materials detailed in table 1 according to the setup in figure 1, without the breast slabs along the beam path. Aluminium and copper are filter materials commonly used for beam filtration in commercial x-ray systems and have relatively low K-edges compared to the other tested filter materials. Silver has a K-edge that is near that of molybdenum and rhodium, two materials most commonly used in standard x-ray mammography. Cerium has a K-edge at an energy previously shown to have advantageous characteristics for dedicated breast CmT (McKinley et al 2004a, 2004b); two other rare earth metals with similar K-edge energies, europium and neodynium are included as practical alternatives to cerium. Tungsten, another common filter material, with a K-edge higher than that of cerium, is also included for the purposes of comparison, similar to aluminium and copper.
The individual filter thicknesses correspond approximately to the 200th and 500th attenuation value layer (VL) of filter material. These attenuating value layer thicknesses are energy dependent and the specific thicknesses were determined using xSpect with a tube operating voltage of 60 kVp. This tube voltage was chosen since it lies in a relatively smooth region of the attenuation coefficient curves of all of the above materials, away from any K-edge discontinuities that might otherwise bias the resultant material thicknesses. Practical limitations in obtaining exact metal thicknessesmean that the values in table 1 approximate the stated attenuation value layer at 60 kVp. Actual attenuation values for these filter materials are also indicated and are calculated based on simulation outputs of a tungsten tube with intrinsic filtration. The particular filter value layers implemented were chosen by considering tube heating effects, where a 500th VL represents the upper limit of filter material thickness for this system under expected clinical operating conditions for full breast tomography using >200 sequential exposures per imaged breast. The 200th VL filter, or thinner, then represents one possible filter thickness for practical daily clinical use. For example, in another experiment using a 100th VL Ce filter (0.0508 cm thickness at 60 kVp), and 2.5 mA s per projection for full CmT imaging of breast phantoms, the measured exposure rate at the 35 cm isocentre was 3.5 mR per projection, resulting in a cumulative dose to a 15 cm diameter, 50–50% adipose-glandular breast of 3.7 mGy (McKinley 2006).
Four separate x-ray tube operating voltages, from 40 to 100 kVp, in 20 kV increments were investigated. These operating voltages span a range that includes the low voltage more typical of current x-raymammography, to a higher tube voltage that could provide higher mean beam energies and higher overall flux. To standardize flux, a constant x-ray source exposure of 0.4 mA s was used for these pre-breast spectral studies. At each voltage setting and for each filter material and thickness, the collimated x-ray source was exposed multiple times until approximately 100 detected events were present in the peak of the detected spectrum. Comparisons between different filter materials were then possible by normalizing the number of exposures and the aperture diameter in front of the spectrum analyser. Comparisons to the simulated spectra were made by normalizing the integral spectral areas. Absorbed dose for breast sizes ranging from 10 to 18 cm were calculated using tables of dose specifically generated for our imaging geometry and based on a previously reported methodology (Boone et al 2004). Measured and simulated spectra were again normalized as described above. Trends in absorbed dose as a function of filter material were then determined.
2.4. Post-breast spectral measurements: effect of breast thickness and composition
The effect on the filtered x-ray spectrum after it passes through breast materials of varying densities and thicknesses was also measured. It is this beam that impinges on the flat-panel imaging detector, so determining and hence optimizing the characteristics of this post-breast beam are paramount to ensuring the best possible image. Based on the overall results of the first section of this study, cerium was chosen as the filter material to further test.
Stacks of breast tissue equivalent plates, each 2.0 cm thick (CIRS Inc., Norfolk, VA) having either 100% glandular or 100% adipose composition (ICRU-44 specifications) were centred at the system isocentre (35 cm from the focal spot) to represent uncompressed breasts of various thicknesses and densities in the beam path. Figure 1 shows a 16 cm 50–50% glandular–adipose breast equivalent tissue setup with the centre of the breast placed at the isocentre of the CmT system. The total number of equivalent breast material slabs was varied to create breast tissue of thickness ranging from 8 to 18 cm. These two breast diameters bound the majority of breast sizes seen clinically, and results for breast diameters outside this range could be extrapolated from those investigated here. Composition of breast material along the beam path was also varied to span the range of possible breast tissue densities, from 100% glandular to 50–50% and 100% adipose tissue.
Cerium filters of thickness approximately equivalent to a 200th and 500th VL along with an unfiltered beam were used with this setup. Tube operating voltages spanned 40 to 80 kVp in 20 kV increments. In order to get higher count rates through the breast, larger x-ray exposures, ranging from 1.6 to 10 mA s, were used compared with the earlier filter measurements. In this section, the detector was exposed to 100 pulses of the x-ray source in order to normalize the spectra.
2.5. Quantitative analysis
Common figures of merit (FOMs) for both pre- and post-breast spectra used previously (McKinley et al 2004b) are mean beam energy and full-width at tenth-maximum (FWTM). Mean beam energy is calculated using the first moment, or weighted mean of the spectral distribution of the x-ray beam. The FWTM is used to indicate the degree of monochromaticity of the x-ray beam incident on the breast in the FOV of the x-ray system. Although FWHM is the traditionally cited metric for spectral resolution, this may neglect the presence of other features (e.g. a low intensity, yet broad energy distribution) that could otherwise bias the spectral broadening. For example, while a traditional mammography spectrum may have sharp (i.e. narrow FWHM) characteristic x-rays, the integral intensity of these characteristic x-rays is usually lower than the integral intensity of any broader underlying bremsstrahlung spectrum from the same tube. Thus, a higher overall degree of monochromaticity could be expected with a spectrum having a lower FWTM metric.
Additionally, the FOM calculated in the second section of the study was an index of beam hardening, calculated as the ratio of weighted mean energies of the pre-breast and post-breast x-ray beams. Although image processing techniques can minimize the effects of beam hardening (e.g. seen as cupping in CT images), these artefacts still reduce intrinsic image quality. While an alternative approach is to model the energy spectrum during the reconstruction process (De Man et al 2001), our overall approach to CT is to use a quasi-monochromatic beam for minimal beam hardening with the added benefit of potentially reduced dose to the object. Finally, for a 16 cm breast of varying material densities a comparison was made between effective attenuation coefficient values calculated using experimental pre-breast mean beam energies in conjunction with material composition values obtained from NIST data and the measured attenuation coefficients calculated using Beer’s law. Multiple spectral acquisitions were obtained and mean attenuation value coefficients calculated after normalizing pre-breast and post-breast spectra to the same tube exposure, spectral detector aperture and number of x-ray pulses used to acquire the spectra. The average per cent standard deviation across all attenuation coefficients of the individual spectral acquisitions was used as a measure of error in the calculations.
3. Results and discussion
3.1. Pre-breast spectra
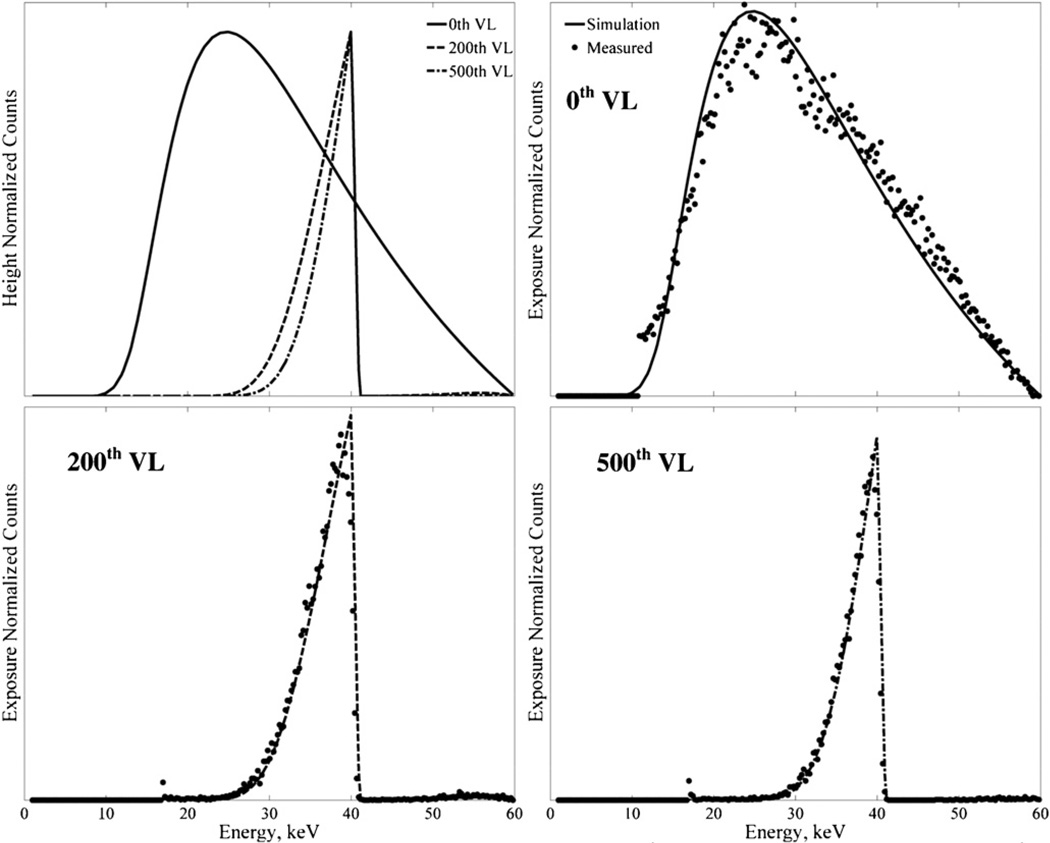
Figure 2 shows a variety of simulated and measured spectra for a 60 kVp x-ray beam without any filter (0th VL) and with an equivalent 200th and 500th VL cerium filtered beam. The plots illustrate the dramatic change in spectral quality when ultra-thick K-edge filtering is used. The most obvious visual characteristic is the increasing monochromaticity of the filtered beam compared to the more polychromatic, unfiltered beam most clearly seen in the superimposed simulation curves. The effect of the ultra thick filter is to eliminate lower energy photons, with the higher energy photons eliminated by the K-edge absorption. Consequently the mean filtered beam energy is concentrated around the K-edge of the filter material.
Figure 2.
Plots of simulated and measured spectra at 60 kVp for 0th VL (unfiltered beam), 200th VL and 500th VL filtered spectra showing increased monochromaticity as the filtration increases.
In the current study, both 200th and 500th VL filtered beams were investigated. While acquiring spectra, however, it was determined that tube heating potentially biases the decision against routine use of the 500th VL filter for multiple CmT acquisitions. Henceforth, the emphasis in presented results will be on the 200th VL filter.
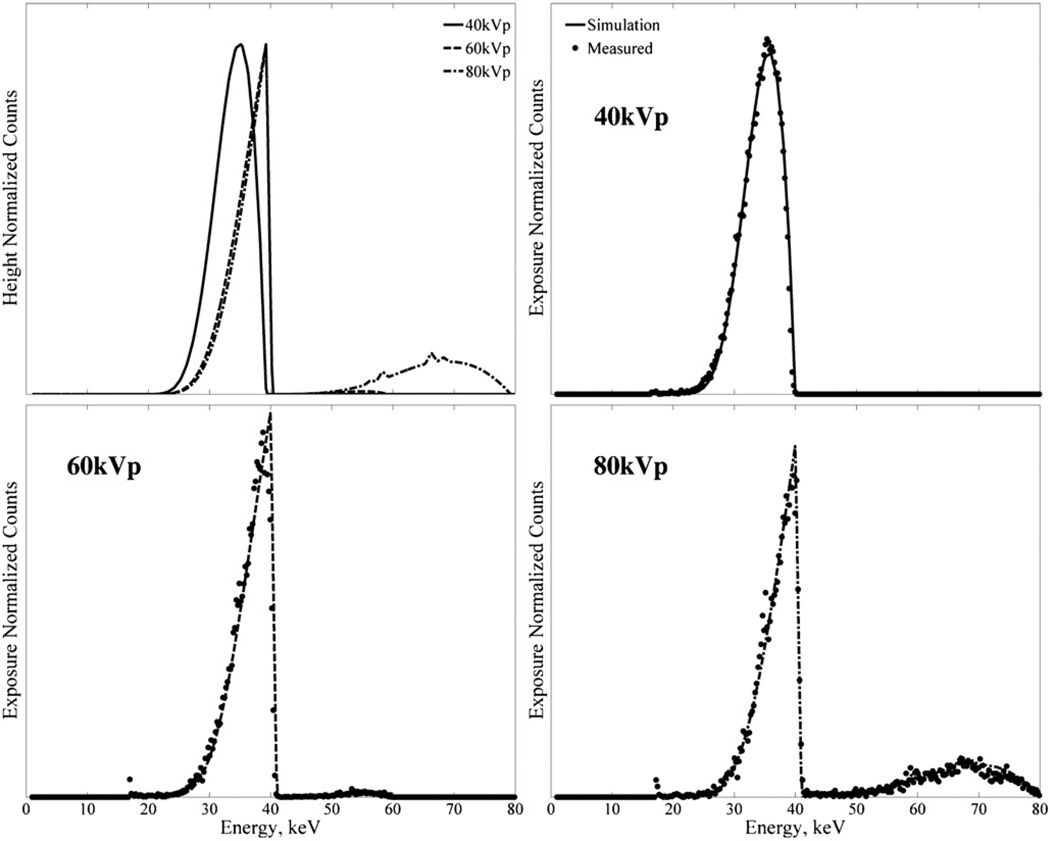
Figure 3 illustrates the simulated and experimental results of using a 200th VL cerium filter on the raw x-ray beam at three tube operating voltages: 40, 60 and 80 kVp. Agreement of experimental and simulated data is good. Comparing the filtered beams at 60 and 80 kVp, the excess high-energy photons at the higher operating voltage gives a bimodal quality to the spectrum that degrades the monochromatic nature of the x-ray beam.
Figure 3.
Plots of simulated and measured 200th VL Ce filtered spectra for 40, 60 and 80 kVp spectra showing changes in spectral quality as the tube voltage increases.
While for computed tomography a higher voltage on an unfiltered beam may be preferable for minimizing dose to the patient, these resulting high-energy photons may reduce object contrast. With the use of heavy K-edge filtration, too high a tube operating voltage (i.e. 80 kVp) leads to a clearly bimodal spectrum which may similarly lower object contrast similar to an unfiltered beam. Therefore, to preserve a narrow energy band, an operating tube voltage of 60 kVp may be preferred.
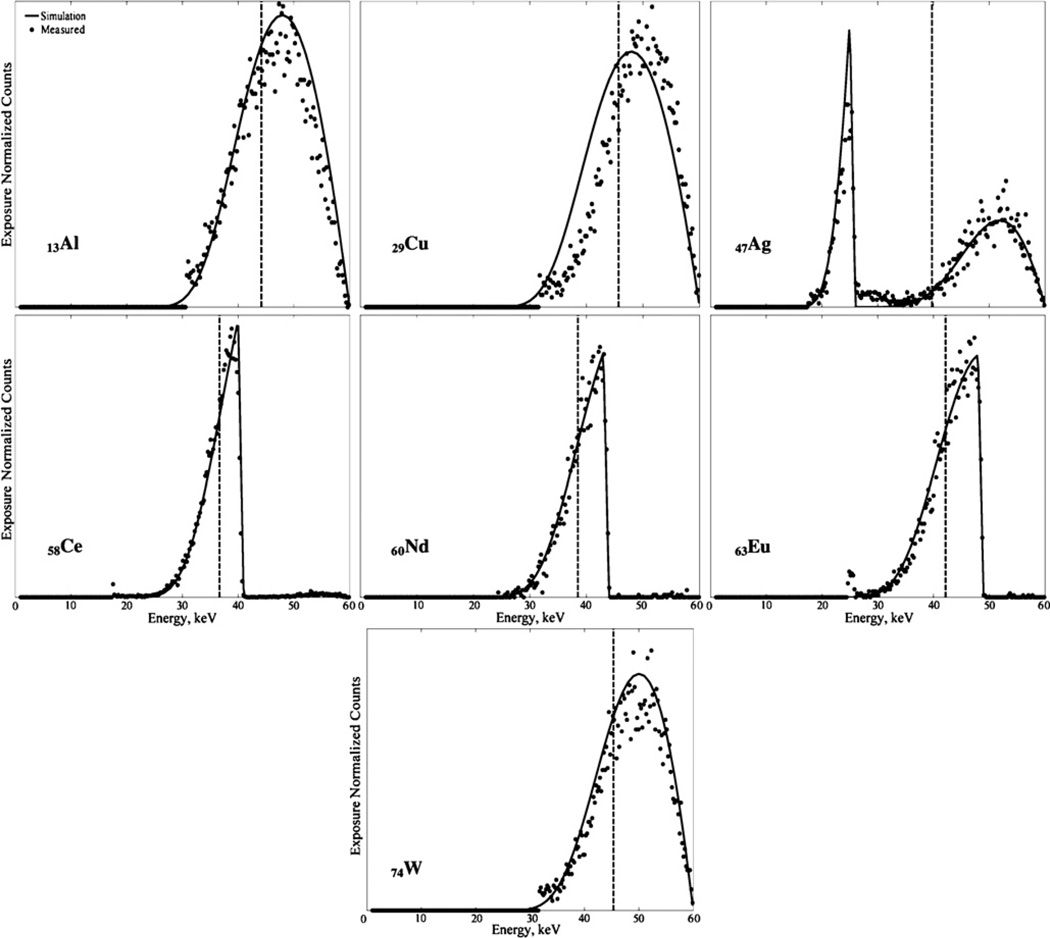
Figure 4 is a comparison plot of pre-breast spectra acquired using all seven filters in the study at a tube voltage of 60 kVp and a filter thickness approximately equivalent to 200th VL (table 1). A sharp cutoff is evident in detected photons at energies higher than the K-edges of the respective lanthanide filters, leading to more quasi-monochromatic spectra when compared to the filter materials with both lower and higher K-edge energies. Through a series of measurements, we have concluded that the lower energy events observed in some of the spectra are most likely due to electronic noise.
Figure 4.
Exposure normalized pre-breast measured spectra with various filters superimposed with simulated spectra. Spectra are acquired at 60 kVp and 200th VL. The weighted mean beam energy for each filter is illustrated with a vertical dashed line.
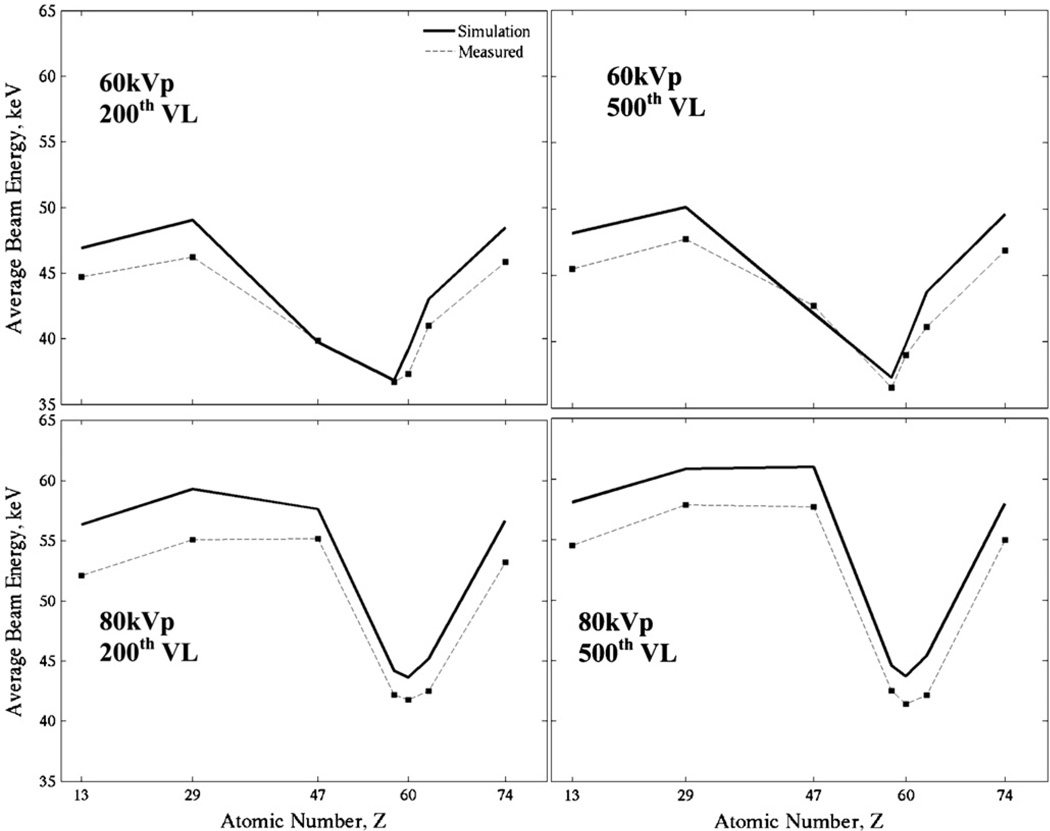
A comparison of simulated and measured average pre-breast beam energy as a function of atomic number of the filter material is shown in figure 5 for combinations of a 200th and 500th VL filtered beam at 60 and 80 kVp. At 60 kVp, the measured mean beam energy for the cerium filter with either a 200th or 500th VL is ~36.5 keV, which lies directly in the range of beam energies for optimum dose efficiency described in the introduction. Since optimum dose efficiency is affected by breast and lesion size (more so than by breast composition), other lanthanide metals such as europium and neodynium may also be appropriate for dedicated breast CmT as alternatives to cerium for larger breasted women.
Figure 5.
Simulated (solid lines) and measured (broken line with data points) weighted average beam energy for pre-breast filters at given atomic numbers for various listed conditions.
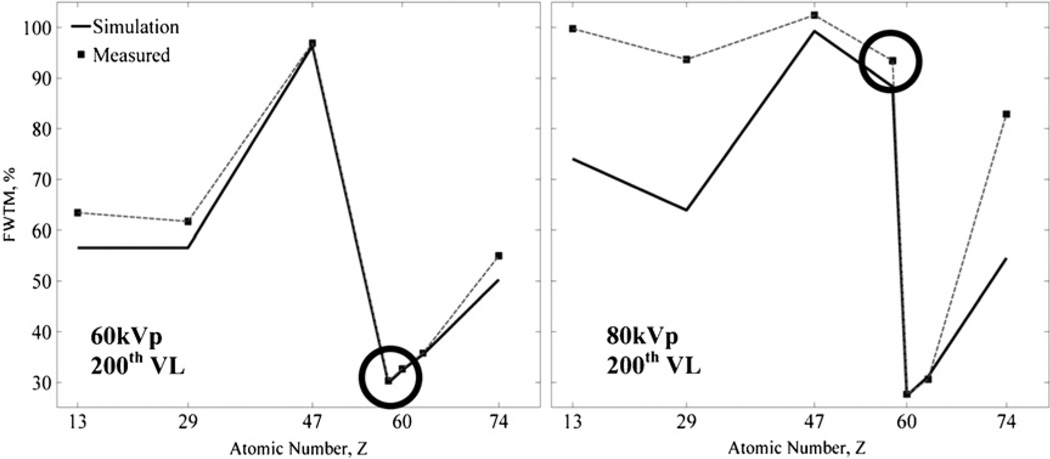
A comparison of FWTM results for each of the measured and simulated pre-breast filter materials are plotted in figure 6 for a 200th VL attenuation layer and tube voltages of 60 and 80 kVp. Agreement between measured and simulated data is observed for most filter materials. Error is greatest where the effect of low-energy noise is most pronounced (as seen in figure 4) on the weighted mean of the data.
Figure 6.
Measured and simulated FWTM values plotted as a function of atomic number of the filter materials. Cerium (circled), Z = 58, exhibits the minimum FWTM of this set of metals at 60 kVp but, due to the bimodal spectral shape shown in figure 3, has much greater spectral broadening at 80 kVp.
At 60 kVp, the highest degree of monochromaticity, i.e. lowest FWTM, is seen for the cerium filter where the effect of the K-edge is to essentially eliminate photons beyond approximately 40 keV. At the higher tube voltage of 80 kVp, the effect of the cerium K-edge is reduced and allows some higher energy photons to break through, as seen in the 80 kVp spectrum illustrated in figure 3, thus broadening the cerium spectrum. It may be that neodynium, possessing a slightly higher K-edge than cerium, may be a better choice of filter material for larger than average breast sizes.
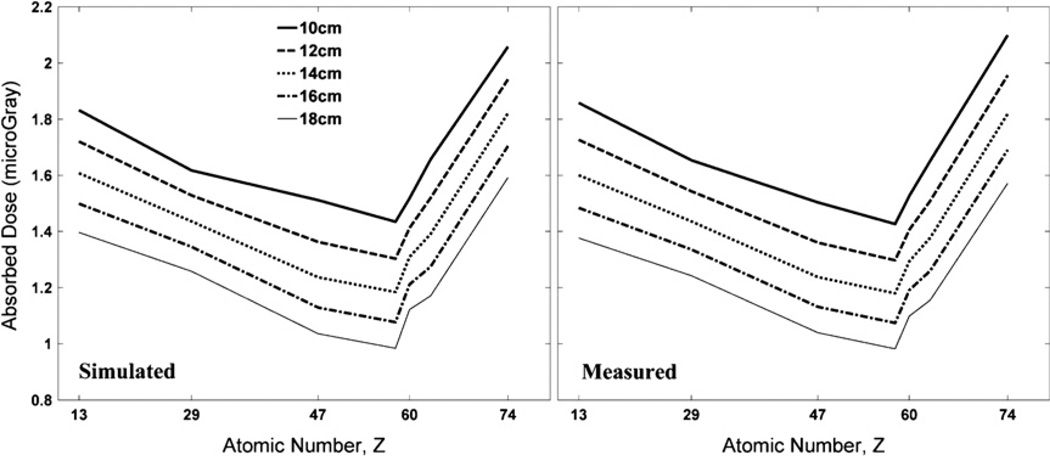
A plot of absorbed dose (in µGy) for a range of breast thicknesses from 10 cm to 18 cm is shown in figure 7 for all filters used in the first section of this study; the breast composition is 50–50% adipose–glandular. The plots are from data with a tube voltage of 60 kVp at a filter thickness equivalent to a 200th VL. Cerium is shown to have the lowest absorbed dose for breasts of all thicknesses under these particular operating conditions.
Figure 7.
Plots of dose calculated from exposure normalized simulated and measured energy spectra for filters operating at 60 kVp and 200th VL for a range of breast sizes from 10 to 18 cm with a 50–50% adipose–glandular breast tissue composition. Trends illustrate a minimum in absorbed dose for heavy K-edge filtration with cerium.
3.2. Post-breast results
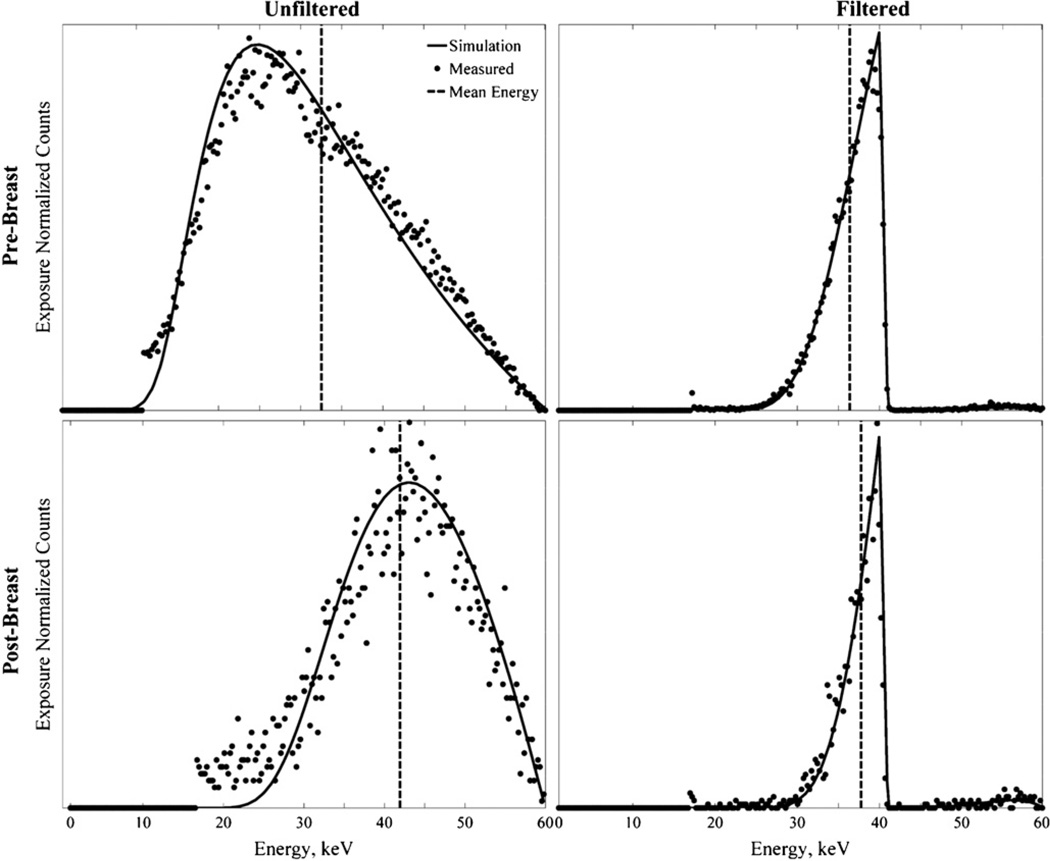
Figure 8 shows exposure normalized unfiltered and 200th VL filtered pre- and post- breast measured spectra at 60 kVp along with xSpect-generated spectra for a 16 cm breast of 100% glandular composition. Though the unfiltered spectra are generally noisy due to the broad spectrum and exposure normalization, overall agreement is good between measured and simulated data. Note the dramatic change in average energy, indicated by straight lines on the plots, of the post-breast beam for the unfiltered beam as opposed to the relatively minor change for the heavily filtered beam.
Figure 8.
Simulated and measured spectra for pre-breast (top row) and post-breast (bottom row) unfiltered (left column) and 200th VL Ce filtered (right column) beam through a 16 cm thick breast of 100% glandular composition. Vertical dashed line indicates the weighted mean beam energy.
The shift in mean beam energy of the post-breast spectrum for the unfiltered beam illustrates a high degree of beam hardening (figure 8). Table 2 lists minimum degrees of measured beam hardening across all breast compositions and thicknesses and filter value layer thicknesses using a 60 kVp operating voltage. In general, beam hardening is seen to increase with increasing thickness of breast tissue and also with increasing glandular composition. The equation used to calculate beam hardening was ((mean energy post – mean energy pre)/mean energy pre) × 100%.
Table 2.
Measured beam hardening (%) at 60 kVp across all experimental Ce filter setups.
| Beam attenuation value layer |
|||||||||
|---|---|---|---|---|---|---|---|---|---|
| Unfiltered Glandular tissue (%) |
200th VL Glandular tissue (%) |
500th VL Glandular tissue (%) |
|||||||
| Breast thickness (cm) |
0 | 50 | 100 | 0 | 50 | 100 | 0 | 50 | 100 |
| 8 | 19.1 | 17.5 | 14.2 | 3.00 | 1.34 | 3.99 | 0.98 | 1.41 | 1.25 |
| 12 | 17.0 | 20.0 | 22.7 | 1.78 | 2.35 | 2.68 | 0.74 | 1.11 | 1.42 |
| 16 | 19.6 | 23.0 | 25.8 | 2.25 | 2.78 | 3.71 | 0.86 | 1.12 | 1.82 |
| 18 | 20.1 | 24.4 | 26.1 | 2.18 | 2.70 | 4.44 | 0.78 | 1.09 | 1.95 |
A low value of beam hardening emphasizes the improvement in mononchromaticity, when a filtered, quasi-monochromatic beam is used in a dedicated breast CmT imaging system. Results are best for the thickest filter, but the proportional improvement between the 200th and 500th VL filter is dwarfed by the improvement between the unfiltered and the 200th VL filtered beam.
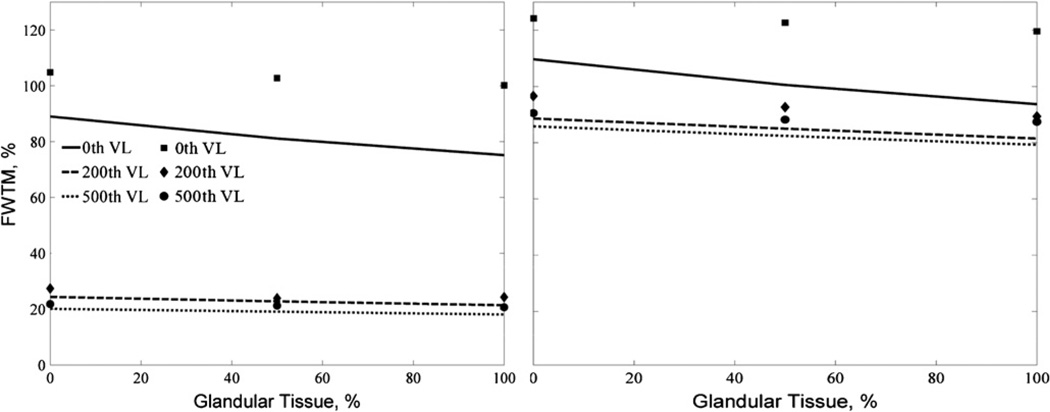
Finally, spectral width, as measured by the FWTM, of post-breast spectra for a 16 cm thick breast across all breast densities at a tube voltage of 60 and 80 kVp are shown in figure 9.
Figure 9.
Simulated (lines) and measured (data points) FWTM at 60 and 80 kVp for 16 cm breasts of varying density for 0th VL (unfiltered beam), 200th VL and 500th VL cerium filtration.
At 60 kVp, there is a threefold reduction in spectral width for a 200th VL beam as compared to the unfiltered beam, indicating much greater monochromaticity in the beam now incident on the imaging detector.
Improvement in FWTM figures for 80 kVp is not as pronounced, reinforcing the suggestion that higher voltages may not be ideal for routine tube operation. The difference between measured and simulated values is most pronounced for the unfiltered beam, where noise in the measured beam spectra is highest. Though measured results in the 80 kVp case follow simulated results less closely than those at 60 kVp, the trend in results is the same.
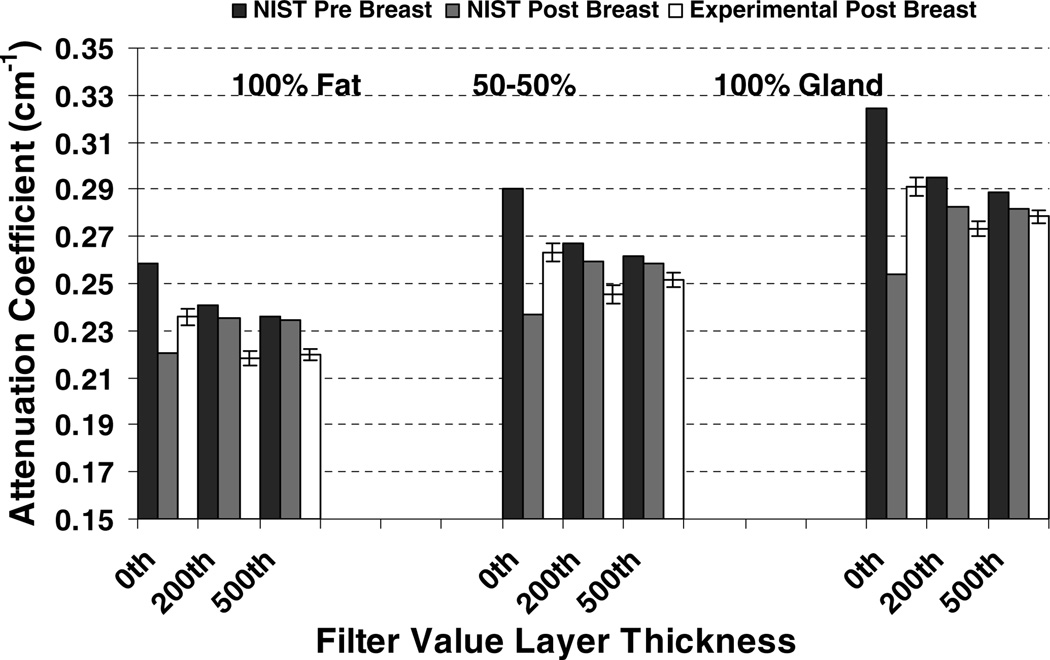
Figure 10 is a comparison plot of the average attenuation coefficient through various 16 cm thick breast compositions. The comparison is between coefficients measured experimentally using multiple acquired spectra versus those calculated using experimentally obtained pre-breast mean beam energies along with breast material composition values obtained from NIST data. The average standard deviation across all attenuation coefficients as a percentage of the mean attenuation coefficient calculated from multiple experimental spectra is used as an estimation of experimental error. The trend in attenuation coefficient values for each breast material composition is to be expected with increasing attenuation as we increase the percentage glandular tissue in the breast. The trend in attenuation coefficients derived using NIST data and pre-breast mean beam energies is consistent with a large change in pre-breast mean beam energy between an unfiltered, or 0th VL beam, and a filtered beam. The specific change in mean beam energy between 200th VL and 500th VL beam is very small. The discrepancy in the 0th VL between the measurement and the NIST calculated value is likely due to the fact that the NIST value is calculated at a single mean beam energy, whereas the measured value is modulated by the distributed energy spectrum.
Figure 10.
Comparison plot of experimentally measured attenuation coefficient versus attenuation coefficients derived using NIST material data and pre- and post-breast measured beam energies. Breast thickness is 16 cm and x-ray tube operating voltage is 60 kVp for varying Ce-filter conditions. Breast composition and filter value layer thickness is indicated on the plot. Trends in attenuation coefficients are as expected and agreement between NIST and measured data is generally good. Note that the scale ranges from 0.15 cm−1 to 0.35 cm−1.
4. Conclusion
In this study, quasi-monochromatic x-ray cone beam spectra generated using ultra-thick K-edge filtration were experimentally measured and compared to simulated scatter-free spectra under otherwise equivalent conditions. Earlier studies for computed mammotomography (CmT) led us to conclude cerium as a near-ideal filter, and based on our measurement metrics, the results of the current study further corroborate these conclusions. Pre-breast and post-breast spectra were acquired using various filter materials and under various operating conditions that mimic those seen clinically for 8–18 cm thicknesses of uncompressed breast equivalent material. Agreement exists between measured and simulated data, suggesting that our non-traditional heavily filtered x-ray spectra are practicable for use in dedicated breast tomography and that we can use these simulations when optimizing our imaging tasks. Indeed, these types of quasi-monochromatic beams, under different optimization conditions, might also be useful for other dedicated x-ray imaging approaches, such as breast tomosynthesis and small animal imaging. Comparisons of spectral FOMs generally showed significant improvement for ultra-thick filtered beams over spectra generated solely with intrinsic beam filtration. Using a rotating tungsten anode tube with high heat capacity, it has been possible to implement such an ultra-thick filtration scheme in our lab without undue distress on the prototype CmT system (Tornai et al 2005a, 2005b, McKinley et al 2004a, McKinley 2006). One of the major advantages of using the filtration scheme is the reduction in absorbed dose to the breast of the patient in CmT. Other experimental studies have shown improvements in dose and exposure efficiency for the quasi-monochromatic cone-beam paradigm implemented here (Tornai et al 2005b), and trends in absorbed dose highlighted in this study further corroborate those results. Further ongoing investigations are examining the possibility, with the aid of this quasi-monochromatic beam and other system features, of reducing cumulative dose to the breast for fully 3D computed mammotomography down to a fraction of that absorbed during dual-view mammography (McKinley 2006).
References
- Boone JM, Shah N, Nelson TR. A comprehensive analysis of DgNCT coefficients for pendant-geometry cone-beam breast computed tomography. Med. Phys. 2004;31:226–235. doi: 10.1118/1.1636571. [DOI] [PubMed] [Google Scholar]
- Bradshaw ML, McKinley RL, Samei E, Archer CN, Tornai MP. Initial x-ray design considerations for application specific emission and transmission tomography (ASETT) of the breast. J. Nucl. Med. 2003;44:287. [Google Scholar]
- Chapman D, Thomlinson W, Johnston RE, Washburn D, Pisano E, Gmur N, Zhong Z, Menk R, Arfelli F, Sayers D. Diffraction enhanced x-ray imaging. Phys. Med. Biol. 1997;42:2015–2025. doi: 10.1088/0031-9155/42/11/001. [DOI] [PubMed] [Google Scholar]
- Chen B, Ning R. Cone-beam volume CT mammographic imaging: feasibility study. Med. Phys. 2002;29:755–770. doi: 10.1118/1.1461843. [DOI] [PubMed] [Google Scholar]
- De Man B, Nuyts J, Dupont P, Marchal G, Suetens P. An iterative maximum-likelihood polychromatic algorithm for CT. IEEE Trans. Med. Imaging. 2001;20:999–1008. doi: 10.1109/42.959297. [DOI] [PubMed] [Google Scholar]
- Gambaccini M, Tuffanelli A, Taibi A, Fantini A, Del Guerra A. A Bragg diffraction quasimonochromatic source for mammography using mosaic crystal. Proc. SPIE. 1999;3770:174–184. [Google Scholar]
- Hammerstein GR, Miller DW, White DR, Masterson ME, Woodard HQ, Laughlin JS. Absorbed radiation dose in mammography. Radiology. 1979;130:485–491. doi: 10.1148/130.2.485. [DOI] [PubMed] [Google Scholar]
- Li J, Zhong Z, Lidtke R, Kuettner KE, Peterfy C, Aliyeva E, Muehleman C. Radiography of soft tissue of the foot and ankle with diffraction enhanced imaging. J. Anat. 2003;202:463–470. doi: 10.1046/j.1469-7580.2003.00175.x. [DOI] [PMC free article] [PubMed] [Google Scholar]
- Maeda K, Matsumoto M, Taniguchi A. Compton-scattering measurement of diagnostic x-ray spectrum using a high-resolution schottky CdTe detector. Med. Phys. 2005;32:1542–1547. doi: 10.1118/1.1921647. [DOI] [PubMed] [Google Scholar]
- McKinley RL. PhD Thesis. Duke University; 2006. Development and characterization of a dedicated computed mammotomography system. [Google Scholar]
- McKinley RL, Tornai MP. Preliminary investigation of dose for a dedicated mammotomography system. Proc. SPIE: Physics of Medical Imaging. 2006;6142:60–70. [Google Scholar]
- McKinley RL, Tornai MP, Samei E, Bradshaw ML. Development of an optimal x-ray beam for dual-mode emission and transmission mammotomography. Nucl. Instrum. Methods Phys. Res. 2004a;A 527:102–109. [Google Scholar]
- McKinley RL, Tornai MP, Samei E, Bradshaw ML. Simulation study of a quasi-monochromatic beam for x-ray computed tomography. Med. Phys. 2004b;31:800–813. doi: 10.1118/1.1668371. [DOI] [PubMed] [Google Scholar]
- National Institute of Standard and Technology. X-ray Mass Attenuation Coefficient of Air (Dry, Near Sea Level. http://physics.nist.gov/PhysRefData/XrayMassCoef/ComTab/air.html.
- Tornai MP, McKinley RL, Brzymialkiewicz CN, Madhav P, Cutler SJ, Crotty DJ, Bowsher JE, Samei E, Floyd CE. Design and development of a fully-3D dedicated x-ray computed mammotomography system. Proc. SPIE: Physics of Medical Imaging. 2005a;5745:189–197. [Google Scholar]
- Tornai MP, McKinley RL, Samei E, Floyd CE, Bradshaw ML. Proc. 7th Int. Workshop Digit. Mammography. Kalamazoo, MI: Dovetail Publishing; 2005b. Effects of uncompressed breast composition and thickness on image quality using a quasi-monochromatic beam for x-ray computed mammotomography; pp. 46–55. [Google Scholar]


