

Abstract
In this study we compared the response of the Pig-a gene mutation assay to that of the lacZ transgenic rodent mutation assay, and demonstrated that multiple endpoints can be measured in a 28-day repeat dose study. Muta™Mouse were dosed daily for 28 days with benzo[a]pyrene (BaP; 0, 25, 50 and 75 mg/kg body weight/day) by oral gavage. Micronucleus (MN) frequency was determined in reticulocytes (RETs) 48 hr following the last dose. 72 h following the last dose, mice were euthanized, and tissues (glandular stomach, small intestine, bone marrow and liver) were collected for lacZ mutation and DNA adduct analysis, and blood was evaluated for Pig-a mutants. BaP-derived DNA adducts were detected in all tissues examined and significant dose-dependent increases in mutant Pig-a phenotypes (i.e., RETCD24- and RBC CD24-) and lacZ mutants were observed. We estimate that mutagenic efficiency (i.e., rate of conversion of adducts into mutations) was much lower for Pig-a compared to lacZ, and speculate that this difference is likely explained by differences in repair capacity between the gene targets, and differences in the cell populations sampled for Pig-a versus lacZ. The BaP doubling doses for both gene targets, however, were comparable, suggesting that similar mechanisms are involved in the accumulation of gene mutations. Significant dose-related increases in % MN were also observed; however, the doubling dose was considerably higher for this endpoint. The similarity in dose response kinetics of Pig-a and lacZ provides further evidence for the mutational origin of glycosylphosphatidylinositol (GPI)-anchor deficiencies detected in the Pig-a assay. Environ. Mol. Mutagen. 2011. © 2011 Wiley-Liss, Inc.
Keywords: phosphatidylinositol glycan complementation group A, genotoxicity, reduction, mutagenic efficiency, dose response kinetics
INTRODUCTION
Data for the induction of gene mutations in vivo form an increasingly important component of hazard and risk assessment. One widely used and well-validated system for assessment of gene mutations in vivo is the transgenic rodent (TGR) mutation assay system (for review see [Lambert et al.,2005; OECD,2009]). Commonly used versions of the TGR assays include the lacZ bacteriophage mouse or Muta™Mouse [Gossen et al.,1989; Vijg and Douglas1996], the lacI or BigBlue™ rodents (rat and mouse), the lacZ plasmid mouse, and the gpt-delta mouse [Lambert et al.,2005]. The regulatory importance of these assays has been recognized by the Organization for Economic Cooperation and Development (OECD) and an OECD Test Guideline (no. 488) was approved in 2011 [OECD,2011].
Another promising assay for in vivo gene mutation testing is the recently developed Pig-a mutation assay. The Pig-a assay has multispecies capability and, when fully validated, may constitute an effective tool for in vivo mutation research and hazard assessment [Bryce et al.,2008; Phonethepswath et al.,2008; Dobrovolsky et al.,2010]. The Pig-a assay is based on detection of glycosylphosphatidylinositol (GPI) anchored proteins on the cell surface of circulating blood cells (reticulocytes or RETs) and red blood cells (RBCs). The Pig-a (phosphatidylinositol glycan complementation group A) gene product is involved in the first step of GPI anchor biosynthesis, and since it is the only X-linked gene involved in the GPI anchor synthesis pathway, it is generally accepted that a single mutation at the Pig-a locus can prevent the anchoring of GPI anchored proteins (i.e., CD24 in mouse, or CD59 in rat). Mutant RBCs or RETs therefore lack cell surface expression of these proteins (RBCCD24− or RETCD24−), and this phenotype can readily be detected by flow cytometry. For a detailed description of the assay, the reader is referred to [Phonethepswath et al.,2008]. Several research groups have been working towards the validation of this assay (for example see [Miura et al.,2008; Phonethepswath et al.,2010; Kimoto et al.,2011]) and it is the focus of this Special Issue; however, much work still remains to be completed before the assay can be routinely used for regulatory genetic toxicity testing.
This study contributes to the validation of the Pig-a endpoint by comparing its responsiveness to that of the well established lacZ TGR mutation assay for the well-known mutagenic carcinogen benzo[a]pyrene (BaP). The results of this study provide useful information on how induction of mutant Pig-a phenotypes compares to that of a well established and validated mutation target, (i.e., lacZ), in the same animals.
An important feature of this study is the integration of multiple genotoxicity endpoints in a single experiment. This facilitates reduction of the number of animals used for testing, as recommended by the European Centre for the Validation of Alternative Methods (ECVAM) [Pfuhler et al.,2009]. Although there has been progress in the integration of multiple endpoints into 28-day repeat dose studies (for example, see [Dertinger et al.,2010; Shutsky et al.,2010]), further work is required in order to determine the most appropriate endpoints, dosing regimes, and sampling times.
This study has three overall objectives: (1) to contribute to the validation of the Pig-a assay by comparing the response of the Pig-a assay to the well established lacZ mutation assay; (2) to assess how simultaneous measurement of multiple endpoints (for mutation, chromosome damage and DNA adducts) can be achieved in a single 28-day subchronic mouse study; and (3) to determine the utility of DNA adduct data in assessing the efficiency of mutation induction. We hypothesized that, although the two mutation assays examine different loci (i.e., Pig-a and lacZ), their responses would be similar given their presumed similar mechanisms of action. Conversely, we expected that the dose-response kinetics of BaP-induced micronucleus formation would be different, given that this cytogenetic damage endpoint is sensitive to different types of lesions.
MATERIALS AND METHODS
Chemicals
All chemicals were obtained from Sigma Aldrich Canada (Oakville, ON), except Tris-HCl, phosphate buffered saline (PBS), and proteinase-K, which were obtained from Invitrogen Canada (Burlington, ON).
Animal Treatment
Twenty-five-week old male Muta™Mouse specimens (i.e., transgenic mouse strain 40.6) were dosed daily via oral gavage for 28 days with BaP dissolved in olive oil (25, 50, and 75 mg/kg body weight/day). Each dose group, including vehicle control, contained five animals. Following OECD Test Guideline 474 [OECD,1997], peripheral blood for MN analysis was collected from the saphenous vein 48 hr after the last treatment. Following a three-day sampling period after the final treatment, mice were anaesthetized with isofluorane to permit blood collection via cardiac puncture. This was immediately followed by cervical dislocation. 60 μl aliquots of the collected blood were processed for the Pig-a mutation endpoint analysis. Tissues, including liver, bone marrow, small intestine, and glandular stomach, were isolated, flash-frozen in liquid nitrogen, and stored at −80°C until use. One mouse, dosed i.p. with ethylnitrosourea (45 mg/kg body weight) two weeks prior to necrospsy was used as a positive control for the Pig-a assay. Mice were maintained under conditions approved by the Health Canada Animal Care Committee. Food and water were available ad libitum for the duration of the experiment.
Genomic DNA Isolation
Glandular Stomach
Mucosal cells from glandular stomach were isolated and lysed according to [Brault et al.,1999]. Briefly, glandular stomach was thawed, and stomach mucosal cells were removed from the inner lining of the glandular stomach, and were homogenized in 5 ml lysis buffer (1 mM Na2EDTA, 100 mM NaCl, 20 mM Tris-HCl, pH 7.4), supplemented with 1% SDS (w/v) and 0.1 mg/ml Rnase A and incubated for 1 hr at 37°C. Proteinsase K (1 mg/ml) was added and cells were incubated at 37°C overnight with gentle shaking. Genomic DNA was isolated the day following lysis, using the phenol/chloroform extraction procedure described previously [Douglas et al.,1994; Vijg and Douglas1996]. Isolated DNA was dissolved in 100 μl TE buffer (10 mM Tris pH 7.6, 1 mM EDTA) and stored at 4°C until used.
Bone marrow
To collect bone marrow, femurs were flushed with PBS, the solution was briefly centrifuged, and the pellet was stored at –80°C. DNA was extracted as described above.
Small intestine
Epithelial cells were isolated from the jejunum of the small intestine using a method modified from [Tao et al.,1993] and [Trentin et al.,1998]. Frozen tissue was defrosted on ice and slit open in 1.5 ml cold “snapping buffer” (75 mM KCl, 20 mM EDTA). The tissue was passed quickly into and out of a 1-ml syringe (i.e., “snapped”) three times, and the buffer was discarded. The tissue was then snapped six to nine times in an additional 3 ml of buffer before the cell suspension was collected and centrifuged for 10 min at 1,500 g and 4°C. DNA was extracted from the cell pellet as described above.
Liver
Liver tissue was thawed and homogenized on ice using a motor-driven conical tissue homogenizer in 7 ml TMST buffer (50 mM Tris pH 7.6, 3 mM magnesium acetate, 250 mM sucrose, 0.2% (v/v) Triton X-100). The liver homogenate was centrifuged for 6 min at 800 g (4°C), the supernatant was discarded, and the pellet was washed twice more with TMST buffer as before. The pellet was suspended in 5 ml lysis buffer (10 mM Tris pH 7.6, 10 mM EDTA, 150 mM NaCl, 1% (w/v) SDS and 1mg/ml proteinase K (≥20 Units/mg). This suspension was incubated overnight at 37°C. Again, DNA was extracted as described above.
DNA Adduct Analysis
DNA adducts were measured in bone marrow, liver, glandular stomach, and small intestine using the 32P-postlabeling method with nuclease P1 digestion enrichment [Phillips and Arlt,2007]. All enzymes and chemicals used for this assay were purchased from sources previously described in [Phillips and Arlt,2007]. Briefly, DNA samples (4 μg) were digested with micrococcal nuclease (120 mUnits) and calf spleen phosphodiesterase (40 mUnits), enriched and labeled as reported elsewhere [Philips and Arlt,2007]. Chromatographic conditions for thin-layer chromatography (TLC) on polyethyleneimine-cellulose (PEI-cellulose) plates (Macherey-Nagel, Düren, Germany) were [Arlt et al.,2008]: D1, 1.0 M sodium phosphate, pH 6; D3, 4 M lithium-formate, 7 M urea, pH 3.5; D4, 0.8 M LiCl, 0.5 M Tris, 8.5 M urea, pH 8. After chromatography, TLC sheets were scanned using a Packard Instant Imager (Dowers Grove, IL) and DNA adduct levels (RAL, relative adduct labeling) were calculated from adduct cpm, the specific activity of [γ-32P]ATP and the amount of DNA (pmol of DNA-P) used. An external BaP-diol-epoxide-DNA standard was used for identification of BaP-DNA adducts [Phillips and Castegnaro1999]. Results are expressed as DNA adducts/108 nucleotides.
Evaluation of Mutant Pig-a Phenotypes
RBCs were enriched by centrifugation with Lympholyte® and then washed with PBS. These coded specimens were shipped overnight on ice packs to Litron Laboratories for flow cytometric analysis. Enriched RBCs were incubated with anti-mouse-CD24-PE, washed, and then incubated with the cell permeable nucleic acid dye SYTO 13 as described in Phonethepswath et al. [2008]. For each specimen, the frequency of RETs and mutant phenotype RBCs was measured by interrogating approximately 106 RBCs. The frequency of mutant phenotype RETs was measured by interrogating at least 3 × 10⁵ RETs per specimen using flow cytometry.
lacZ Mutation Evaluation
The frequency of lacZ transgene mutants in genomic DNA isolated from liver, bone marrow, glandular stomach and small intestine was measured using the P-Gal positive selection assay as previously described [Vijg and Douglas,1996; Lambert et al.,2005]. λgt10lacZ DNA was rescued from genomic DNA using the Transpack™ lambda packaging system (Agilent, Mississauga, ON). Packaged phage particles were then mixed with the host bacterium (Escherichia coli lacZ−, galE−, recA−, pAA119 with galT and galK) [Gossen et al.,1992], plated on minimal medium containing 0.3% (w/v) P-Gal and incubated overnight at 37°C. Total plaque-forming units (pfu) were measured on concurrent titre plates that did not contain P-Gal. Mutant frequency (MF) is expressed as the ratio of mutant pfu to total pfu.
Micronucleus Evaluation
For evaluation of micronuclei, blood samples (∼100 μl) were collected from the saphenous vein 48 hr following the last treatment [OECD,1997], and fixed according to MicroFlow® kit instructions. Coded specimens were shipped to Litron Laboratories for analysis, where they were stained and analyzed using a 3-color labeling method described by Dertinger et al. [2004]. Instrument settings were optimized with a MicroFlow-kit supplied biological standard (i.e., malaria-infected erythrocytes; Tometsko et al.,1993). The frequencies (%) of RETs, micronucleated RETs (MN-RET) and micronucleated NCEs (MN-NCE) were determined upon the acquisition of ∼20,000 RETs per specimen.
Statistical Analyses
All data (i.e., adduct level, lacZ mutant frequency, mutant Pig-a phenotype frequency, and micronucleus frequency data) were analyzed by Poisson Regression using SAS v.9.1 (SAS Institute, Cary, NC). The data were fit to the model log(E(Yi)) = log ti + ί xi, where E(Yi) is the expected value for the ith observation, ί is the vector of regressions coefficients, xi is a vector of covariates for the ith observation, and ti is the offset variable used to account for differences in observation count period (i.e., total pfu or total RETs). The offset (i.e., natural log) was given a constant coefficient of 1.0 for each observation, and log-linear relationships between mutant count and test article concentration were specified by a natural log link function. Type 1, or sequential analysis, was employed to examine the statistical significance of the BaP treatment, and custom contrasts were employed to evaluate the statistical significance of responses at each dose tested.
BaP doubling dose (i.e., the dose of BaP required to elicit a doubling in the spontaneous frequency) was calculated for each of the endpoints according to the method of Dubrova [2005], Eq. (1).
| (1) |
where μs is the spontaneous frequency, and mi is the slope of the dose-response function.
The slopes of the dose-response functions, or mi, were calculated using ordinary least squares regression. Standard deviation for each doubling dose was calculated according to Sankaranarayanan and Chakraborty [2000]. The two-tailed Student's t test (p < 0.05), with the appropriate multiple test correction (i.e., Bonferroni correction), was used to compare doubling doses across endpoints.
RESULTS
Transgenic mice were exposed to BaP daily for 28 days via oral gavage, and simultaneous measurements of DNA adduct frequency, micronucleus frequency, lacZ mutant frequency, and the frequency of mutant Pig-a phenotypes were carried out in an effort to better understand the responsiveness of Pig-a phenotype frequency relative to other established genotoxicity endpoints for the prototypical polycyclic aromatic hydrocarbon BaP. No overt signs of toxicity were observed in any dose group, including controls, and no statistically significant reductions in body weight were observed.
DNA Adducts
DNA adducts were evaluated three days following the last treatment, via 32P postlabeling analysis, as a measure of internal dose of the active BaP metabolite to target tissues. Using an external BaP-diol-epoxide-DNA standard, the main adduct detected was identified as dG-N2-BPDE (BaP-7,8-diol-9,10-epoxide-N2-deoxyguanosine). DNA adducts were found to be present in all four of the tissues examined (Fig. 1), and all doses yielded DNA adduct levels that were significantly elevated compared to control (p < 0.05) in all tissues, with the exception of the low dose group (25 mg/kg body weight/day) in glandular stomach. Furthermore, DNA adduct formation was dose-dependent (dose effect p < 0.005). No DNA adducts were observed in the control animals.
Fig. 1.
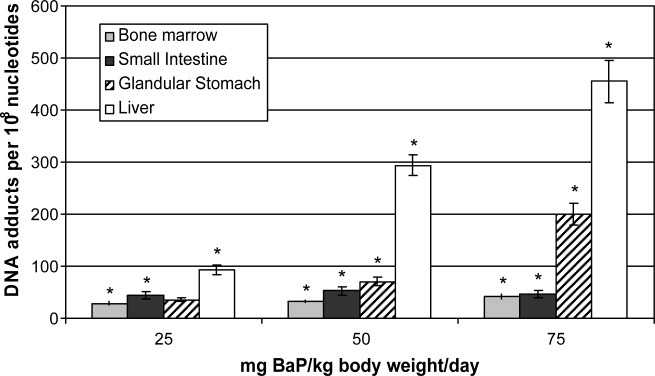
Relative adduct labeling (DNA adducts per 108 nucleotides) of BaP-7,8-diol-9,10-epoxide-N2-deoxyguanosine (BPDE) adducts in tissues of BaP-treated Muta™ Mouse. Values are means of measurements from five separate animals (each DNA sample analysed in two independent postlabeling assays), and error bars represent standard error of the mean. (* indicates p < 0.05 compared to control).
Mutagenic Response to BaP
Evaluation of Mutant Pig-a Phenotypes
The frequency of mutant Pig-a phenotypes was measured using flow cytometry for RBCs and RETs in blood samples obtained at necropsy (i.e., 72 hr following the last dose). Figure 2 summarizes the mutagenic response observed for the Pig-a locus. Dose-dependent increases in mutant phenotype RETs and RBCs (i.e., RETCD24− and RBCCD24−) were observed in both cell populations (for RETCD24− Poisson regression chi-square for test article concentration effect = 129.10, p < 0.0001, and for RBCCD24− Poisson regression chi-square for test article concentration effect =83.82, p < 0.0001). Moreover, a higher proportion of mutant cells were consistently observed in the RET cohort compared to the RBC cohort; however, in both cell populations, each dose group was significantly elevated compared to control (p < 0.05). One mouse, treated with a single i.p. dose of ENU (45 mg/kg body weight) was used as a positive control, and it also showed an increased frequency of RETCD24− and RBCCD24−. There also appeared to be a slight increase in % RETs with increasing BaP dose. This effect has also been observed in BaP-treated rats [Bhalli et al.,2011b], although it should be noted that BaP itself endows RBCs with a modest amount of green fluorescence, and this may have interfered with flow cytometric quantification of % RETs.
Fig. 2.
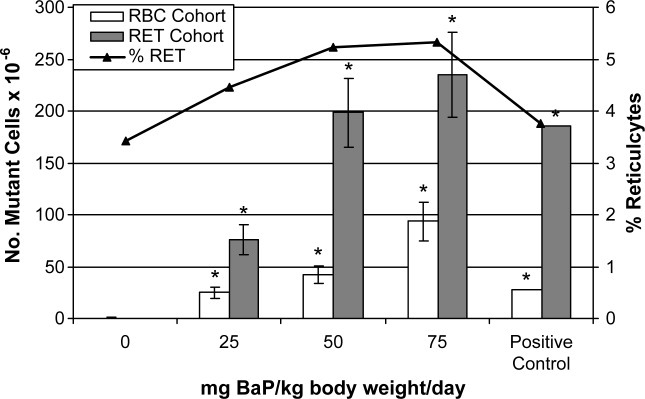
Frequency of mutant Pig-a phenotypes observed in reticulocytes (RETs) and red blood cells (RBCs). Bars represent the mean of measurement from five separate animals and error bars represent the standard error of the mean. The positive control represents the response observed for one mouse treated with 45 mg/kg body weight ethylnitrosourea (i.p.) two weeks prior to necropsy. (* indicates p < 0.05 compared to control) Note that no mutant phenotype RETs were observed in control animals, while in RBC, 0.40 × 10⁻⁶ ± 0.25 × 10⁻⁶ mutant phenotypes were observed.
lacZ Mutation Evaluation
MF for the lacZ transgene was evaluated in four tissues (liver, bone marrow, glandular stomach, and small intestine) 72 hr following the last dose. Figure 3 summarizes the mutagenic response at the lacZ transgene. A dose-dependent increase in BaP-induced lacZ MF was observed in all four tissues (Poisson regression chi-square for test article concentration effect = 149.56 for bone marrow, 237.95 for liver, 156.95 for small intestine and 179.09 for glandular stomach, p < 0.0001 for all tissues.) Small intestine consistently yielded the highest frequency of lacZ mutants, followed by bone marrow, glandular stomach, and liver. In all tissues, all doses of BaP yielded a frequency of lacZ mutants that was significantly elevated compared to control (p < 0.005). Spontaneous MF (×10−5) for each of the tissues are as follows (standard error in brackets): liver: 6.31 (1.30), bone marrow: 3.97 (1.39) and glandular stomach: 5.95 (2.71), small intestine: 32.77 (30.36).
Fig. 3.
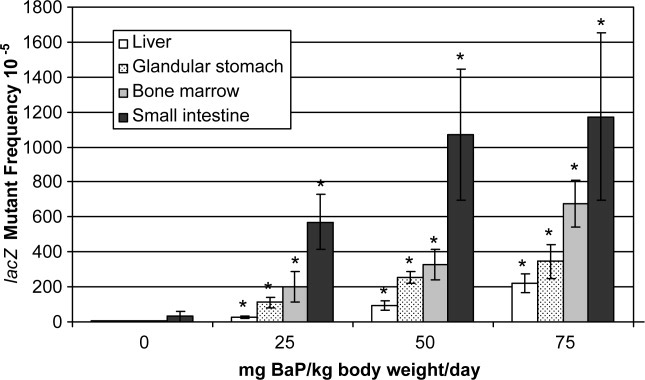
Frequency of lacZ mutants observed in liver, bone marrow, glandular stomach and small intestine of BaP-exposed Muta™ Mouse. Bars represent the mean of measurement from five separate animals and error bars represent the standard error of the mean. (* indicates p < 0.05 compared to control).
Micronucleus Formation
We also measured micronucleus frequency in blood from BaP-exposed animals collected 48 hr following the last treatment. Figure 4 summarizes these results. A dose-dependent increase in % MN-RETs and % MN-NCE was observed (for RETs, Poisson regression chi-square for test article concentration effect = 46.77, p < 0.0001, and for NCEs, Poisson regression chi-square for test article concentration effect = 112.53, p < 0.0001). In both cell populations, each dose group was significantly elevated compared to control (p < 0.05). A dose-dependent increase in % RET was also observed confirming target tissue exposure.
Fig. 4.
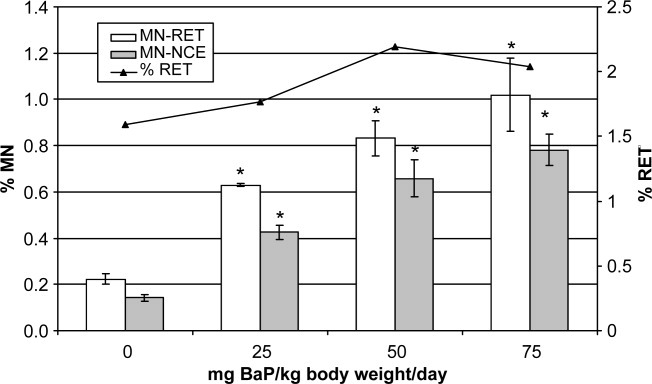
Frequency of micronucleated reticulocytes (% MN-RET) and micronucleated normochromatic erythrocytes (% MN-NCE) in BaP-exposed Muta™ Mouse. Bars represent the mean of measurement from five separate animals and error bars represent the standard error of the mean. (*denotes p < 0.005 compared with control).
Comparison of Responses across Endpoints
An important component of the validation of the Pig-a assay is the comparison of the responsiveness of the mutant Pig-a phenotype endpoint to that of a well-established in vivo gene mutation assay. In this study, we compared the induction of BaP-induced mutant Pig-a phenotypes (as RETCD24−) to the induction of lacZ mutants in the bone marrow, in the same animals. As depicted in Figure 5 the dose-response relationships observed for Pig-a (i.e., RETCD24−) and lacZ MF in bone marrow, are similar. Linear regression analysis of lacZ MF versus the frequency of RETCD24− cells at matched BaP doses revealed a strong correlation (r2 = 0.94, p < 0.05). Interestingly, the maximum lacZ MF in bone marrow was approximately 25-fold higher than the frequency of phenotypic mutants observed for Pig-a in RETs.
Fig. 5.
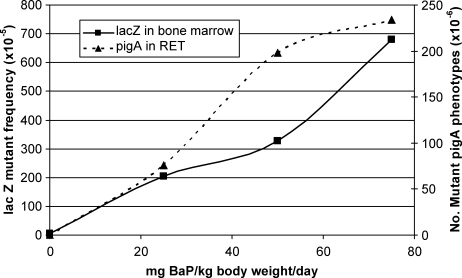
Dose-response relationship for BaP-induced mutants at the lacZ transgene in bone marrow and the frequency of mutant Pig-a phenotypes in reticulocytes (RETs). Note the difference in scale between the two y-axes.
The BaP doubling dose (i.e., the dose of BaP required to elicit a doubling in the spontaneous frequency) for each of the endpoints measured in this study was calculated to permit a quantitative comparison of response induction across endpoints (Table I). Unlike other response metrics (e.g., mutation frequency), doubling dose permits comparison across endpoints and loci, regardless of the response unit. The BaP doubling doses for lacZ MF in all four tissues appear to be correlated with tissue-specific cell turnover rates, with relatively quiescent tissues such a liver showing higher doubling doses. Only the doubling doses calculated for liver and bone marrow are significantly different from each other (p < 0.05). Moreover, the doubling dose for RETCD24− and RBCCD24− are not significantly different from the lacZ doubling dose in bone marrow. However, the doubling dose for micronucleus formation is an order of magnitude higher than that calculated for the gene mutation endpoints (lacZ or Pig-a), and significantly different (p < 0.05).
Table I.
BaP Doubling Doses Calculated For lacZ Mutant Frequency, Mutant Pig-a Phenotypes and Micronucleus Frequency
| Endpoint | Tissue | BaP doubling dose (mg BaP/kg body weight/day) | Standard deviation |
|---|---|---|---|
| lacZ mutant frequency | Bone marrow | 0.458 | 0.249 |
| Small intestine | 2.12 | 59.7 | |
| Glandular stomach | 1.28 | 1.57 | |
| Liver | 2.17 | 0.581 | |
| Mutant Pig-a phenotypes | RET | 0.0856a | 0.106 |
| RBC | 0.346 | 0.272 | |
| Micronucleus frequency | RET | 21.7 | 0.29 |
| RBC | 16.8 | 0.0882 |
Calculated using the spontaneous frequency of RETCD24- from subsequent Muta™ Mouse analyses performed using the newer immunomagnetic scoring procedure (0.28 ± 0.23 × 10⁻⁶). Doubling dose for this endpoint could not be calculated using the method employed here since no RETCD24− were detected in unexposed animals.
Mutagenic efficiency, indicative of the rate of conversion of DNA adducts into mutations (expressed as number of mutants per DNA adduct in 108 nucleotides at a given dose), was calculated for lacZ mutants in bone marrow and mutant Pig-a phenotypes in RETs. The mutagenic efficiency of lacZ in bone marrow was found to be 25-fold higher than that for RETCD24− (Table II). However, it is important to note that since it was not possible to measure DNA adducts directly in the RET population, we have estimated the mutagenic efficiency at the Pig-a locus based on the level of DNA adducts in the entire bone marrow. Accordingly, the mutagenic efficiency for Pig-a could not be adjusted for the proportion of bone marrow DNA adducts in RET or RBC progenitor cells.
Table II.
Mutagenic Efficiency at the lacZ and Pig-a Loci
| Endpoint | Mutagenic efficiency (mutants per DNA adduct in 108 nucleotides) |
|---|---|
| lacZ mutants in bone marrow | 137 × 10−6 |
| mutant Pig-a phenotypes in RET | 5.47 × 10⁻⁶ |
DISCUSSION
In this study we have carried out a subchronic, 28-day BaP exposure in Muta™Mouse in an effort to compare the response of mutant Pig-a phenotype formation with that of mutation formation in the well-studied lacZ transgene. We have shown that these mutational endpoints, along with measurements of internal dose (i.e., DNA adducts) and chromosomal damage (i.e., micronucleus formation), can be effectively integrated into a 28-day repeat dosing study, thus reducing the number of animals required in subchronic genotoxicity studies.
The presence of DNA adducts in these animals shows that BaP was converted to its active metabolite (i.e., BPDE) and delivered to target tissues. The relative levels of adducts observed across tissues is not surprising (liver > glandular stomach > small intestine > bone marrow), given the route of exposure (i.e., oral gavage) and pharmacokinetic factors at play. In this study, the primary site of contact for BaP is the stomach, followed by the small intestine. BaP is then carried to the liver, the primary site of systemic metabolism, via hepatic portal circulation. BaP and its metabolites must enter systemic circulation in order to reach the bone marrow. Accordingly, the levels of DNA adducts are highest in glandular stomach and liver, the sites of contact and primary site of metabolism, respectively, and lowest in the bone marrow and small intestine (Fig. 1). Differences in the levels of metabolizing enzymes (e.g., P450) are also known to vary between tissues, and may account for some of the differences observed in DNA adduct levels.
Dose-dependent increases in both mutant Pig-a phenotypes (in RETs and RBCs) and lacZ mutants (in bone marrow, liver, glandular stomach and small intestine) were observed. The rate of conversion of DNA adducts into mutations, estimated using the ratio of mutant frequency to adduct frequency, and denoted as mutagenic efficiency, was calculated for both of these mutation targets in order to compare susceptibility of the two loci. We estimate that the efficiency of converting BaP-DNA adducts in the bone marrow into lacZ mutants is 25-fold higher than for mutant Pig-a phenotypes in RETs. Similarly, the magnitude of the lacZ response in bone marrow is approximately 25-fold higher than the Pig-a response in RETs, suggesting that the rate of conversion of adducts is slower for the Pig-a endpoint compared with the lacZ endpoint. In contrast, the BaP doubling dose for the lacZ mutation endpoint in bone marrow is not significantly different from the the Pig-a endpoint (in both RETs and RBCs) (Table I). Taken together, these results suggest that, although the rate of conversion of adducts into mutations may be different for lacZ and Pig-a, the kinetics of mutation accumulation for both mutation targets is the same once a mutation is fixed. The similarity in doubling dose is not unexpected given that both assays are designed to measure gene mutation events, and therefore involve the same mechanism of action. Interestingly, the BaP doubling doses calculated here for the lacZ endpoint also seem to increase with decreasing mitotic index of the tissue. This is also expected, since replication is required for mutation fixation and tissues such as liver have previously been highlighted for low cell turnover [Mirsalis et al.,1989].
Assuming that both the lacZ and Pig-a genes are neutral (i.e., cells with lacZ or Pig-a muations are not selected for or against in situ) [Cosentino and Heddle,1996; Keller et al.,1999; Rosti,2002; Lambert et al.,2005], it might be predicted that their mutagenic efficiencies should be the same; however, this does not appear to be the case. Differences in the mutagenic efficiency and the (related) magnitude of response between the two mutation endpoints may be explained by several factors. First and foremost, the discrepancy reflects the fact that the population of bone marrow cells evaluated for lacZ mutants differs from the population of cells evaluated for Pig-a mutations. Since we could not measure adducts directly in blood cells, for the purposes of the efficiency calculation, we have assumed that all bone marrow cells are capable of becoming RETs and RBCs. However, it is well known that bone marrow is composed of many different stem cell populations, only a fraction of which are hematopoietic stem cells (HSC), and, only a fraction of these HSC are committed to the erythrocyte population. The remainder of the HSCs are either destined to become lymphoid progenitor cells (i.e., lymphocytes or natural killer cells, etc.), or other myeloid-based blood cells (e.g., mast cells, macrophages, thrombocytes). Although measurement of the proportions of cell types in the bone marrow that are committed to becoming RETs would prove challenging, this information would permit a better estimate of mutagenic efficiency for the Pig-a endpoint. It is also important to note that DNA adducts were measured in the whole genome, whereas lacZ mutants and mutant Pig-a phenotypes are only measured at a specific locus and there may be some variability in adduct levels between the measured locus compared to the whole genome.
It is important to note that the BaP doubling dose for mutant Pig-a phenotypes in RETs (Table I) was calculated using the spontaneous frequency of RETCD24− from other analyses performed using the newer high throughput scoring procedure [data not shown, method adapted for mice from Dertinger et al. (2011)]. The BaP doubling dose for the Pig-a endpoint in RET could not be calculated using the scoring method used for this study since no RETCD24− were detected in unexposed control animals in this study, and a measurable level of background mutant Pig-a phenotypes is required to calculate doubling dose (see Eq. 1). This newer scoring method employs cell separation by paramagnetic particles to dramatically increase the number of cells scored, thus resulting in more accurate measurements of spontaneous frequency of RETCD24−.
Although the doubling dose values did not reveal any significant difference in the sensitivity of the two loci to BaP, there are marked differences in the absolute values of the mutant and phenotypic frequencies for the lacZ and Pig-a loci, respectively. The high MF at the lacZ locus relative to the Pig-a locus is analogous to the findings of Skopek et. al. [1996] in their comparison of hprt and lacI. The background mutation frequency in the lacI transgene of BigBlue™ rat was found to be approximately an order of magnitude higher than that of hprt [Skopek et al.,1996]. Here, we note a difference between the lacZ MF and the mutant Pig-a phenotype frequency of two orders of magnitude for spontaneous, and greater than one order of magnitude for induced frequency (mean = 24).
It should also be noted that older animals, such as those used in this study, are known to have a higher frequency of spontaneous mutations in lacZ, and other reporter genes; however, we have no reason to expect that the sensitivity of the mutation assays will be impaired. Moreover, the OECD guideline for TGR assays (no. 488) was not available at the time that the animal work was carried out, and no guidelines regarding animal age were available. Future work of this nature should adhere to the OECD guideline [OECD,2011].
Another important consideration is the fact that the Pig-a gene is subject to transcription-coupled repair in the mouse, while the lacZ transgene is not transcribed [Lambert et al.,2005]. This difference would presumably contribute to a higher frequency of mutations at the lacZ locus. There is also the possibility that a higher frequency of silent mutations (i.e., mutations that have no effect on protein function) occur in either one of the lacZ or Pig-a loci, and this contributes to inaccuracy of the measured mutant frequency. Other unknown factors, such as the sequence context and genomic location, may also contribute to the higher mutagenic efficiency observed for lacZ. For example, Lichtenauer-Kaligis et al. (1993) have shown that integration of hprt cDNA into different locations in the human TK6 genome results in differences in mutability.
We have also integrated measurements of chromosome damage into this 28-day repeat dose study by measuring the micronucleus frequency in RETs and NCEs. These measurements were made 48 hr following the last exposure in accordance with OECD guideline 474 [OECD,1997]. Integration was quite simple since only a small blood sample is required for the analysis, and it can be obtained from a living animal (e.g., by saphenous or submandibular vein bleed). The same animals can then be used for analysis of mutations and DNA adducts at three days following the last treatment, thereby reducing the total number of animals required for the study. Integration of multiple endpoints into subchronic repeat dose studies has been highlighted as a way to reduce animal numbers in genetic toxicology studies [Pfuhler et al.,2009]. A recent study showed that the micronucleus assay, comet assay, and Pig-a assay can be integrated into a 28-day repeat dose study in rats [Shutsky et al.,2010], and measurements of micronucleus frequency have been successfully carried out alongside the Pig-a assay in a 28-day subchronic rat study [Dertinger et al.,2010].
In contrast to the gene mutation endpoints, the dose-response kinetics of micronucleus formation were quite different; the BaP doubling dose calculated for micronucleus formation in RETs is approximately 10-fold higher than those for the Pig-a and lacZ mutation endpoints. This observation is consistent with the current understanding of the different mechanisms of micronucleus versus mutation formation. Neutral gene mutations have no selective advantage or disadvantage, and hence, cells containing new neutral mutations can accumulate over time during continuous treatment of the exposed tissue. In contrast, micronuclei measured in RETs are formed during mitosis and cannot accumulate with multiple cell divisions since the MN-RET (i.e., polychromatic erythrocytes) are expected to mature and enter the population of red blood cells (i.e., NCEs).
In this study, we used the standard OECD TGR assay testing regime of 28 + 3 days (i.e., 28 day exposure period + 3 day sampling time) since this is the minimum time necessary for detection of mutations in the lacZ gene [Thybaud et al.,2003; OECD,2011]. We observed significant dose-dependent increases in BaP-induced Pig-a mutant RETCD24− and RBCCD24− phenotypes and lacZ mutants (Figs. 2 and 3, respectively). At the three day sampling time, however, a higher proportion of mutant Pig-a phenotypes is observed in the RET population (versus RBC). This has been shown previously, and is due to the time required for the turnover of RETs into RBCs. In mice, the maximum RET response is reached after 2weeks; whereas, the maximum RBC response is reached only after four weeks [Bhalli et al.,2011a]. The relatively higher response observed in RETs may also be due to the reduced lifespan of GPI-deficient RBC due to their susceptibility to complement-mediated lysis [Tremml et al.,1999]. Likely for these same reasons, we also observed a higher mutagenic efficiency in RETs versus RBCs (Table II). Although the sampling time of 3 days post-exposure may not be optimal for the maximum Pig-a response, it is sufficient to observe dose-related effects and, importantly, is compatible with integration into a TGR assay.
It is also possible that the 28+3 sampling regime is not ideal for measuring DNA adducts; however, it is known that adducts formed by BaP are relatively persistent following acute dosing [Stowers and Anderson,1985]. We are not aware of previously published information on the kinetics of formation and elimination of BPDE DNA adducts following a 28-day subchronic repeat dose study in the mouse, however, studies by Poirier et al. conducted in rats may help shed some light on murine DNA adduct kinetics. In Poirier et al. [1982], Wistar-Furth rats were fed 2-acetylaminofluorene for 28-days and the kinetics of hepatic DNA adduct formation and elimination were measured. Adduct levels reached a plateau at approximately two weeks, and once treatment stopped, adduct levels began to decrease. However, at three-days post-treatment greater than 90% of adducts still remained [Poirier et al.,1982]. Based on this information, and the fact that the measured levels of BaP-DNA adducts showed dose-dependency and strong correlation with lacZ mutant frequency, it is safe to say that the BaP-DNA adduct levels at 28 days were at steady state, and the adduct levels measured at 72-hr post-exposure were a sufficiently accurate representation of BaP internal dose. Nevertheless, it should be acknowledged that the level of BPDE adducts observed in a tissue at any given time depends on the balance between the metabolic conversion of BaP to BPDE (via phase I metabolism), detoxification (via phase II metabolism), the rate of adduct repair, and the cell turnover rate. Therefore, although is seems plausible that the DNA adduct levels on day 28 were slightly higher than those at three days post-treatment, the sampling time required for evaluation of lacZ mutant frequency did not permit assessment of adduct frequency immediately following administration of the final dose. It may be prudent to investigate the kinetics of adduct loss following subchronic oral BaP exposures in order to validate the efficacy of simultaneous measurements of numerous endpoints in the same animals.
A major hurdle in the validation of the Pig-a assay has been confirmation of the mutational basis for the observed phenotypes (i.e., GPI-anchor deficiency); however, sequencing of Pig-a mutant blood cells is not possible since RBCs lack nuclear DNA. Nevertheless, Pig-a mutations have been confirmed in GPI-anchor deficient rat splenic T-cells [Miura et al.,2008; Miura et al.,2011], and in patients with the GPI-anchor deficiency disorder, paroxysmal nocturnal hemoglobinurea (PNH) [Nishimura et al.,1999]. Compelling evidence for the mutational origin of GPI-anchor deficient phenotypes in the Pig-a assay was most recently presented by Kimoto et al (2011). In that study, cDNA from CD24-negative murine bone marrow cells was sequenced, and it was shown that mutations in Pig-a are present when CD24 is lacking [Kimoto et al.,2011]. Evidence of a similar doubling dose for the Pig-a locus and the more commonly employed lacZ locus provides further evidence for the mutational origin of GPI-anchor deficiencies observed in RBCs and RETs in the Pig-a assay, since the result implies a similar mechanism of action.
In summary, we have demonstrated that multiple endpoints can be incorporated into a 28-day subchronic mouse toxicity study, and the results obtained support the validation of the Pig-a assay by showing that the assay yields comparable responses (i.e., doubling dose) to the commonly used and validated transgenic rodent mutation assay, thus providing further support regarding its utility as an in vivo somatic gene mutation assay. Although differences in mutagenic efficiency were observed between the two gene targets, we hypothesize that the differences are likely due to difficulties in assessing adduct frequency in the target cell populations, and differences in repair capacity across loci, rather than differences in the rate of conversion of adducts into mutations.
Future studies should aim to further investigate the responsiveness of GPI-anchor deficient cells in the Pig-a assay relative to more established in vivo genetic toxicity endpoints such as lacZ, including investigations of the low dose region of the dose-response function. Moreover, 28-day repeat dose studies that test additional classes of compounds with different modes of action, as well as time-course studies to examine the persistence of mutant Pig-a phenotypes will provide further insight into the utility of the assay, and will be important steps in the validation of the Pig-a endpoint as a useful and effective in vivo somatic gene mutation assay.
Acknowledgments
The authors would like to thank Lynda Soper for her technical assistance, the staff of the Scientific Services Division of Health Canada for assistance with animal exposures, and Sabina Halappanavar and Francesco Marchetti for useful comments on the manuscript. Spontaneous Pig-a mutant frequency data for Muta™ Mouse were provided by Alexandra Long.
REFERENCES
- Arlt VM, Stiborova M, Henderson CJ, Thiemann M, Frei E, Aimova D, Singh R, Gamboa da Costa G, Schmitz OJ, Farmer PB, Wolf CR, Phillips DH. Metabolic activation of benzo[a]pyrene in vitro by hepatic cytochrome P450 contrasts with detoxification in vivo: Experiments with hepatic cytochrome P450 reductase null mice. Carcinogenesis. 2008;29(3):656–65. doi: 10.1093/carcin/bgn002. [DOI] [PubMed] [Google Scholar]
- Bhalli JA, Pearce MG, Dobrobolsky VN, Heflich RH. Manifestation and persistence of Pig-a mutant red blood cells in C57BL/6 mice following single and split doses of N-ethyl-N-nitrosourea. Environ Mol Mutagen. 2011a doi: 10.1002/em.20682. [DOI] [PubMed] [Google Scholar]
- Bhalli JA, Shaddock JG, Pearce MG, Dobrovolsky VN, Cao X, Heflich RH, Vohr H-W. Report on Stage III Pig-a mutation assays using benzo[a]pyrene. Environ Mol Mutagen. 2011b doi: 10.1002/em.20675. [DOI] [PubMed] [Google Scholar]
- Brault D, Renault D, Tombolan F, Thybaud V. Kinetics of induction of DNA damage and lacZ gene mutations in stomach mucosa of mice treated with beta-propiolactone and N-methyl-N'-nitro-N-nitrosoguanidine, using single-cell gel electrophoresis and MutaMouse models. Environ Mol Mutagen. 1999;34(2-3):182–189. [PubMed] [Google Scholar]
- Bryce SM, Bemis JC, Dertinger SD. In vivo mutation assay based on the endogenous Pig-a locus. Environ Mol Mutagen. 2008;49:256–264. doi: 10.1002/em.20379. [DOI] [PubMed] [Google Scholar]
- Cosentino L, Heddle JA. A test for neutrality of mutations of the lacZ transgene. Environ Mol Mutagen. 1996;28:313–316. doi: 10.1002/(SICI)1098-2280(1996)28:4<313::AID-EM3>3.0.CO;2-C. [DOI] [PubMed] [Google Scholar]
- Dertinger SD, Bryce SM, Phonethepswath S, Avlasevich SL. When pigs fly: Immunomagnetic separation facilitates rapid determination of Pig-a mutant frequency by flow cytometric analysis. Mutat Res. 2011;721:163–170. doi: 10.1016/j.mrgentox.2011.01.009. [DOI] [PMC free article] [PubMed] [Google Scholar]
- Dertinger SD, Camphausen K, Macgregor JT, Bishop ME, Torous DK, Avlasevich S, Cairns S, Tometsko CR, Menard C, Muanza T, Chen Y, Miller RK, Cederbrant K, Bracher M, Gould HJ, Sutton BJ, Dombrowicz D, Karagiannis SN. Three-color labeling method for flow cytometric measurement of cytogenetic damage in rodent and human blood. Environ Mol Mutagen. 2004;44:427–435. doi: 10.1002/em.20075. [DOI] [PubMed] [Google Scholar]
- Dertinger SD, Phonethepswath S, Franklin D, Weller P, Torous DK, Bryce SM, Avlasevich S, Bemis JC, Hyrien O, Palis J, MacGregor JT. Integration of mutation and chromosomal damage endpoints into 28-day repeat dose toxicology studies. Toxicol Sci. 2010;115:401–411. doi: 10.1093/toxsci/kfq070. [DOI] [PMC free article] [PubMed] [Google Scholar]
- Dobrovolsky VN, Miura D, Heflich RH, Dertinger SD. The in vivo Pig-a gene mutation assay, a potential tool for regulatory safety assessment. Environ Mol Mutagen. 2010;51(8-9):825–835. doi: 10.1002/em.20627. [DOI] [PubMed] [Google Scholar]
- Douglas GR, Gingerich JD, Gossen JA, Bartlett SA. Sequence spectra of spontaneous lacZ gene mutations in transgenic mouse somatic and germline tissues. Mutagenesis. 1994;9:451–458. doi: 10.1093/mutage/9.5.451. [DOI] [PubMed] [Google Scholar]
- Dubrova YE. Radiation-induced mutation at tandem repeat DNA Loci in the mouse germline: Spectra and doubling doses. Radiat Res. 2005;163:200–207. doi: 10.1667/rr3296. [DOI] [PubMed] [Google Scholar]
- Gossen JA, de Leeuw WJ, Tan CH, Zwarthoff EC, Berends F, Lohman PH, Knook DL, Vijg J. Efficient rescue of integrated shuttle vectors from transgenic mice: A model for studying mutations in vivo. Proc Natl Acad Sci USA. 1989;86:7971–7975. doi: 10.1073/pnas.86.20.7971. [DOI] [PMC free article] [PubMed] [Google Scholar]
- Gossen JA, Molijn AC, Douglas GR, Vijg J. Application of galactose-sensitive E. coli strains as selective hosts for LacZ- plasmids. Nucleic Acids Res. 1992;20:3254. doi: 10.1093/nar/20.12.3254. [DOI] [PMC free article] [PubMed] [Google Scholar]
- Keller P, Tremml G, Rosti V, Bessler M. X inactivation and somatic cell selection rescue female mice carrying a Piga-null mutation. Proc Natl Acad Sci USA. 1999;96:7479–7483. doi: 10.1073/pnas.96.13.7479. [DOI] [PMC free article] [PubMed] [Google Scholar]
- Kimoto T, Suzuki K, Kobayashi XM, Dobrovolsky VN, Heflich RH, Miura D, Kasahara Y. Manifestation of Pig-a mutant bone marrow erythroids and peripheral blood erythrocytes in mice treated with N-ethyl-N-nitrosourea: Direct sequencing of Pig-a cDNA from cells negative for GPI-anchored protein expression. Mutat Res. 2011;723:36–42. doi: 10.1016/j.mrgentox.2011.03.016. [DOI] [PubMed] [Google Scholar]
- Lambert IB, Singer TM, Boucher SE, Douglas GR. Detailed review of transgenic rodent mutation assays. Mutat Res. 2005;590(1-3):1–280. doi: 10.1016/j.mrrev.2005.04.002. [DOI] [PubMed] [Google Scholar]
- Lichtenauer-Kaligis EG, van der Velde-van Dijke I, den Dulk H, van de Putte P, Giphart-Gassler M, Tasseron-de Jong JG. Genomic position influences spontaneous mutagenesis of an integrated retroviral vector containing the hprt cDNA as target for mutagenesis. Hum Mol Genet. 1993;2:173–182. doi: 10.1093/hmg/2.2.173. [DOI] [PubMed] [Google Scholar]
- Mirsalis JC, Tyson CK, Steinmetz KL, Loh EK, Hamilton CM, Bakke JP, Spalding JW. Measurement of unscheduled DNA synthesis and S-phase synthesis in rodent hepatocytes following in vivo treatment: Testing of 24 compounds. Environ Mol Mutagen. 1989;14:155–164. doi: 10.1002/em.2850140305. [DOI] [PubMed] [Google Scholar]
- Miura D, Dobrovolsky VN, Mittelstaedt RA, Kasahara Y, Katsuura Y, Heflich RH. Development of an in vivo gene mutation assay using the endogenous Pig-A gene. II. Selection of Pig-A mutant rat spleen T-cells with proaerolysin and sequencing Pig-A cDNA from the mutants. Environ Mol Mutagen. 2008;49:622–630. doi: 10.1002/em.20413. [DOI] [PubMed] [Google Scholar]
- Miura D, Shaddock JG, Mittelstaedt RA, Dobrovolsky VN, Kimoto T, Kasahara Y, Heflich RH. Analysis of mutations in the Pig-a gene of spleen T-cells from N-ethyl-N-nitrosourea-treated Fisher 344 rats. Environ Mol Mutagen. 2011;52:419–423. doi: 10.1002/em.20654. [DOI] [PubMed] [Google Scholar]
- Nishimura J, Murakami Y, Kinoshita T. Paroxysmal nocturnal hemoglobinuria: An acquired genetic disease. Am J Hematol. 1999;62:175–182. doi: 10.1002/(sici)1096-8652(199911)62:3<175::aid-ajh7>3.0.co;2-8. [DOI] [PubMed] [Google Scholar]
- OECD. OECD Guidelines for Testing of Chemicals. Paris: Organization for Economic Cooperation and Development; 1997. Test guideline 474: OECD guideline for the testing of chemicals: Mammalian Erythrocyte Micronucleus Test. [Google Scholar]
- OECD. Detailed review paper on transgenic rodent mutation assays. Paris: Organization for Economic Cooperation and Development; 2009. [Google Scholar]
- OECD. OECD Guidelines for Testing of Chemicals. Paris: Organization for Economic Cooperation and Development; 2011. Test guideline 488: OECD guideline for the testing of chemicals: Transgenic Rodent Gene Mutation Assay. [Google Scholar]
- Pfuhler S, Kirkland D, Kasper P, Hayashi M, Vanparys P, Carmichael P, Dertinger S, Eastmond D, Elhajouji A, Krul C, Rothfuss A, Schoening G, Smith A, Speit G, Thomas C, van Benthem J, Corvi R. Reduction of use of animals in regulatory genotoxicity testing: Identification and implementation opportunities-Report from an ECVAM workshop. Mutat Res. 2009;680(1-2):31–42. doi: 10.1016/j.mrgentox.2009.09.002. [DOI] [PubMed] [Google Scholar]
- Phillips DH, Arlt VM. The 32P-postlabeling assay for DNA adducts. Nat Protoc. 2007;2:2772–2781. doi: 10.1038/nprot.2007.394. [DOI] [PubMed] [Google Scholar]
- Phillips DH, Castegnaro M. Standardization and validation of DNA adduct postlabelling methods: Report of interlaboratory trials and production of recommended protocols. Mutagenesis. 1999;14:301–315. doi: 10.1093/mutage/14.3.301. [DOI] [PubMed] [Google Scholar]
- Phonethepswath S, Bryce SM, Bemis JC, Dertinger SD. Erythrocyte-based Pig-a gene mutation assay: Demonstration of cross-species potential. Mutat Res. 2008;657:122–126. doi: 10.1016/j.mrgentox.2008.08.011. [DOI] [PMC free article] [PubMed] [Google Scholar]
- Phonethepswath S, Franklin D, Torous DK, Bryce SM, Bemis JC, Raja S, Avlasevich S, Weller P, Hyrien O, Palis J, MacGregor JT, Dertinger SD. Pig-a mutation: Kinetics in rat erythrocytes following exposure to five prototypical mutagens. Toxicol Sci. 2010;114:59–70. doi: 10.1093/toxsci/kfp289. [DOI] [PMC free article] [PubMed] [Google Scholar]
- Poirier MC, True B, Laishes BA. Determination fo 2-acetylaminofluorene adducts by immunoassay. Environ Health Perspectives. 1982;49:93–99. doi: 10.1289/ehp.834993. [DOI] [PMC free article] [PubMed] [Google Scholar]
- Rosti V. Murine models of paroxysmal nocturnal hemoglobinuria. Ann NY Acad Sci. 2002;963:290–296. doi: 10.1111/j.1749-6632.2002.tb04120.x. [DOI] [PubMed] [Google Scholar]
- Sankaranarayanan K, Chakraborty R. Ionizing radiation and genetic risks. XI. The doubling dose estimates from the mid-1950s to the present and the conceptual change to the use of human data on spontaneous mutation rates and mouse data on induced mutation rates for doubling dose calculations. Mutat Res. 2000;453:107–127. doi: 10.1016/s0027-5107(00)00108-1. [DOI] [PubMed] [Google Scholar]
- Shutsky TJ, Coffing SL, Crammerer Z, Dickinson DD, Engel ME, Fielder RD, Gunther WC, Munzer JB, O'Ione SD, Sanok KE, Schuler MJ, Thiffeault CJ. Integration of genotoxicity testing into repeat dose toxicology studies: What endpoints and tissues should be evaluated. Environ Mol Mutagen. 2010;51:685–742. [Google Scholar]
- Shwed PS, Crosthwait J, Douglas GR, Seligy VL. Characterisation of MutaMouse lambdagt10-lacZ transgene: Evidence for in vivo rearrangements. Mutagenesis. 2010;25:609–616. doi: 10.1093/mutage/geq048. [DOI] [PMC free article] [PubMed] [Google Scholar]
- Skopek TR, Kort KL, Marino DR, Mittal LV, Umbenhauer DR, Laws GM, Adams SP. Mutagenic response of the endogenous hprt gene and lacI transgene in benzo[a]pyrene-treated Big Blue B6C3F1 mice. Environ Mol Mutagen. 1996;28:376–384. doi: 10.1002/(SICI)1098-2280(1996)28:4<376::AID-EM11>3.0.CO;2-C. [DOI] [PubMed] [Google Scholar]
- Stowers SJ, Anderson MW. Formation and persistence of benzo(a)pyrene metabolite-DNA adducts. Environ Health Perspect. 1985;62:31–39. doi: 10.1289/ehp.856231. [DOI] [PMC free article] [PubMed] [Google Scholar]
- Tao KS, Urlando C, Heddle JA. Comparison of somatic mutation in a transgenic versus host locus. Proc Natl Acad Sci USA. 1993;90:10681–10685. doi: 10.1073/pnas.90.22.10681. [DOI] [PMC free article] [PubMed] [Google Scholar]
- Thybaud V, Dean S, Nohmi T, de Boer J, Douglas GR, Glickman BW, Gorelick NJ, Heddle JA, Heflich RH, Lambert I, Martus HJ, Mirsalis JC, Suzuki T, Yajima N. In vivo transgenic mutation assays. Mutat Res. 2003;540:141–151. doi: 10.1016/j.mrgentox.2003.07.004. [DOI] [PubMed] [Google Scholar]
- Tometsko AM, Torous DK, Dertinger SD. Analysis of micronucleated cells by flow cytometry. I. Achieving high resolution with a malaria model. Mutat Res. 1993;292:129–135. doi: 10.1016/0165-1161(93)90140-u. [DOI] [PubMed] [Google Scholar]
- Tremml G, Dominguez C, Rosti V, Zhang Z, Pandolfi PP, Keller P, Bessler M. Increased sensitivity to complement and a decreased red blood cell life span in mice mosaic for a nonfunctional Piga gene. Blood. 1999;94:2945–2954. [PubMed] [Google Scholar]
- Trentin GA, Moody J, Heddle JA. Effect of maternal folate levels on somatic mutation frequency in the developing colon. Mutat Res. 1998;405:81–87. doi: 10.1016/s0027-5107(98)00147-x. [DOI] [PubMed] [Google Scholar]
- Vijg J. Bacteriophage lambda and plasmid LacZ transgenic mice for studying mutations in vivo. In: Pfeifer G, Douglas G, editors. Technologies for the Detection of DNA Damage and Mutations. New York: Plenum Press; 1996. pp. 391–410. [Google Scholar]