

Abstract
Although some scholars maintain that education has little effect on intelligence quotient (IQ) scores, others claim that IQ scores are indeed malleable, primarily through intervention in early childhood. The causal effect of education on IQ at later ages is often difficult to uncover because analyses based on observational data are plagued by problems of reverse causation and self-selection into further education. We exploit a reform that increased compulsory schooling from 7 to 9 y in Norway in the 1960s to estimate the effect of education on IQ. We find that this schooling reform, which primarily affected education in the middle teenage years, had a substantial effect on IQ scores measured at the age of 19 y.
Ever since the advent of intelligence testing, the malleability of intelligence quotient (IQ) scores by education and training has been intensely debated; given that IQ is associated with a host of social and economic outcomes (1–3), insights on this issue are of clear and definite relevance for society. A growing consensus points to the major role that early childhood environment and interventions play in the development of economically and socially relevant cognitive skills (4–6), but the effectiveness and efficiency of later interventions, such as formal schooling, in raising IQ are less certain.
Although the high correlation between IQ and length of schooling is well-documented (1, 7), clear conclusions about both the direction and extent of the possible causal relationship between schooling and IQ scores remain elusive and highly controversial. Herrnstein and Murray's The Bell Curve (3) famously emphasized the role of IQ in self-selection or sorting into educational levels and provided both an extensive literature review and empirical analyses to support claims about the limited malleability of IQ by schooling and/or training. However, reviews by other scholars (7, 8) reach the opposite conclusion, contending that schooling does itself have a substantial independent effect on IQ. These disparities in interpreting the existing evidence arise primarily because empirical analyses of nonexperimental data generally cannot discount reverse causation (i.e., that higher IQ causes a person to obtain more education rather than vice versa or that some other underlying omitted variable or factor is responsible for both high IQ and higher educational attainment).
More recent contributions based on different empirical strategies for addressing the difficulties in observational data, each with its own specific strengths and weaknesses, have been reported (9–13). However, there is one main type of evidence that is both highly relevant and potentially convincing but entirely missing from this literature: analysis of the effect on IQ of major large-scale policy interventions to raise compulsory schooling levels. This current study exploits exogenous variation in individual educational attainments generated by just such a major intervention: a comprehensive compulsory schooling reform that was introduced in Norway in the period from 1955 to 1972 and affected pupils roughly aged 14–16 y. The nature of this reform, as well as the manner of its introduction, offers a unique opportunity to provide hitherto rather elusive evidence on the extent to which formal education affects IQ. Our results document that education occurring even as late as in the middle teenage years can indeed have a statistically significant and sizeable effect on IQ scores.
Norwegian Compulsory Schooling Reform
The Norwegian compulsory schooling reform increased the number of years of compulsory schooling from 7 to 9 y, created a new unified type of middle school (ungdomsskole) for grades 7–9, and standardized the minimum academic curriculum at the middle-school level. Because the school starting age was left unchanged (at 7 y), the reform affected compulsory schooling for adolescents aged roughly 14–16 y. The reform induced many individuals to increase their schooling levels and required that all municipalities provide their youths with an additional 2 y of standardized education in the eighth and ninth grades. Because the introduction of the reform took place in different municipalities in different years, we are able to use a number of different strategies to account for correlation between individuals living in the same communities as well as for time trends in IQ scores during the relevant period (i.e., the Flynn effect) (14). The quasiexperimental nature of this reform has been previously used to study the effect of education on a number of other outcomes in Norway (15–18), and similar reforms in other countries have also been extensively used to study the effect of education on earnings (19–22).
Before the reform, two different types of postcompulsory education at the lower secondary level were available in separate schools in Norway. One type of prereform middle school, realskole, was academically oriented and prepared pupils for further (primarily academic) education at the upper secondary level. Because this school type was not provided at the municipal level, traveling distances for pupils in rural areas were often impractically long before the reform and the students would have incurred extra costs of travel and lodging. The other type of school, framhaldsskole, offered pupils practical/vocational training, mostly in the form of 1-y, nonacademic courses. Municipalities could choose whether or not to offer this type of school to their inhabitants, and the educational offerings in this type of school were not standardized across municipalities. The main impact of the reform was thus to offer, and make compulsory, a standardized academic or unified education track in grade levels 8 and 9 for all pupils, regardless of their place of residence. Following the reform, some tracking by ability or skill levels did take place within the new schooling type, but this practice disappeared over time. Further details of the reform are available in publications by Telhaug (23) and Myhre (24), as well as in SI Text.
The reform was introduced at the municipality level, the lowest of three administrative levels in Norway, with the other two levels being the national level, which has responsibility for higher (tertiary) education, and the county level, which has responsibility for secondary education. Schools at the middle-school (or lower secondary) level were predominantly public. Following the reform, the new type of middle school was administered by the municipalities. Each separate municipality was able to introduce the full compulsory schooling reform after local officials submitted a reform plan to a national committee, which, on approval of the plan, provided national funds to finance the creation of the new middle schools and the extension of compulsory schooling. The timing of the reform in different municipalities was therefore not explicitly randomized, but earlier studies of the reform have not been able to uncover strong correlations between observable characteristics of the municipalities and the timing of the reform (15–18, 25). Extensive checks performed as part of our analysis (Results) fail to uncover evidence that implementation of the reform was not exogenous to our outcomes of interest (education/IQ).
Data
The measure of IQ used in the analysis was obtained from tests of cognitive ability administered by the Norwegian military to all draft-eligible men at approximately the age of 19 y as part of the universal military draft in Norway. The data from these tests have been widely used and interpreted as IQ scores for research purposes (26–31); in particular, the same Norwegian data figure prominently in the original research documenting the Flynn effect and are judged to be of particularly high quality and coverage (14). Further details on the IQ data and IQ trends in Norway at the time of the reform are available in SI Text.
The other data used in this project come from a variety of Norwegian administrative registers organized and maintained by Statistics Norway. Information on place of residence at the age of 14 y was taken from annual datasets from the population registers starting in 1964. Information on educational attainment was obtained from the Norwegian National Educational Database (NUDB), which includes data on the entire population of Norway. Although some of the NUDB data dates back to the early 1970s, full information for the entire population is only reliable following the census in 1980. We therefore use information on highest educational level at the age of 30 y [i.e., 1980 for the earliest cohort we study (born in 1950)]. Data on cohorts born after 1958 showed inconsistencies in the registration of education lengths of 11 y, and we therefore chose to exclude those very late cohorts from our analyses. Altogether, given the restrictions in available data, our analysis is confined to men born during the period 1950–1958. (Further details on the data can be found in SI Text.)
The NUDB includes detailed educational codes that allow us to distinguish between old (prereform) and new (postreform) types of schooling at the primary- and middle-school levels. To identify the timing of the reform in any given municipality, appropriate figures documenting the percentage of cohorts with old and new education codes at the middle-school level were constructed for each of the more than 500 municipalities in Norway at the time. In general, we could easily pinpoint the first cohort affected by the reform because the old schooling codes simply ceased to exist for that cohort [i.e., the share of persons with old schooling codes dropped to (nearly) 0]. We also observed a clear increase in the share of new schooling codes among cohorts at roughly the same time as the reform. However, in some municipalities, the increase in new schooling codes started the year before the old schooling codes disappeared. This suggests that many youths in the cohort immediately preceding the reform were at least partially affected by the reform, although the full reform (with mandatory eighth and ninth grades) did not apply to them (further discussion is provided in SI Text). Although we were able to pinpoint the timing of the reform in the majority of municipalities at the time in Norway, we were unable to do so for all (further details and documentation are provided in SI Text).
We impute years of completed education at the age of 19 y (i.e., when the IQ test is usually taken), based on highest level of completed education at the age of 30 y. Under normal circumstances, the highest level of education at the age of 19 y is completion of high school, equivalent to 12 y of education in Norway at the time of the reform. Therefore, we assign the maximum of 12 y of education at the age of 19 y to anyone who is registered with 12 or more years of completed education by the age of 30 y. For lower education levels, we take the level registered at the age of 30 y as indicative of the level of education at the age of 19 y. We also briefly discuss results when we use the full length of education at the age of 30 y (i.e., including education that was likely to have been obtained after the IQ test was taken), and show that the different measures of educational attainment do not substantially alter our results.
Supporting Information provides a graphical depiction of average IQ scores and years of completed education across persons in the birth cohorts born during the period 1950–1958 and used in our analysis (i.e., the men for whom we are able to identify the timing of the reform in their home municipality). Supporting Information also presents relevant descriptive statistics from our data, broken down by cohort, and documents that the analysis sample did not differ in any noticeable way from the full population of relevant cohorts.
Methods and Specification Details
Throughout this article, we report two sets of results from two slightly different but closely related econometric techniques, which are given a textbook exposition in the work of Wooldridge (32), discussed in great detail as part of the survey reported by Imben and Wooldridge (33) and explained for an interdisciplinary audience (demographers) by Moffitt (34). The general idea of the first approach, a difference-in-difference (DID) analysis, is to estimate the effect of the reform on the average IQ score for Norwegian men by comparing the change in IQ scores from the prereform period to postreform period for municipalities that introduced the reform in a given year with the change in IQ scores in that same period in municipalities that did not introduce the reform in that particular year. Alternative assumptions about the nature of the time trend in educational attainment and/or IQ scores are possible and are discussed extensively later. The second approach employs instrumental variables (IV) methods in which experiencing the new schooling system is used as an instrument for educational attainment (with appropriate controls for time trends and municipality of residence). The resulting system of two simultaneous equations is then estimated by two-stage least squares (2SLS). If we assume that the exclusive mechanism by which the reform affected IQ scores is by increasing the amount of schooling, the IV/2SLS approach allows us to break down the effect of the reform into (i) the effect of the reform on educational attainment and (ii) the effect of 1 y of additional schooling on IQ scores.
We can obtain the average reform effect within the DID framework by estimating the following linear regression with ordinary least squares:
 |
where ri is an indicator variable for whether or not a person i was affected by the reform; mij is an indicator variable for place of residence in municipality j; dit is an indicator variable for birth cohort, t = 1950,…,1958; and
and  are parameters to be estimated; and υi is an error term. Inclusion of the indicator variables mij and dit allows us to capture any average differences in IQ levels in different municipalities and different birth cohorts, respectively. Coefficient ρ then gives us the effect, averaged across all municipalities and times, of the reform on the average IQ score for male conscripts in Norway.
We might also be interested in estimates of the effect of an additional 1 y of schooling on IQ. A simple but unsatisfactory manner in which to study this question would be to estimate a linear regression of IQ score on education as well as other possible relevant covariates:
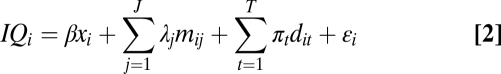 |
where IQi is the IQ score; β, λ, and π are coefficients to be estimated; xi is years of schooling; and εi is an error term. We would clearly hesitate to interpret the β coefficient obtained from such a regression as an estimate of the true or “causal” effect of education on IQ scores because it is conceivable that some type of latent ability influences both IQ scores and education at the same time. This is a classic case of omitted variable bias in linear regression; if it is assumed that education and latent ability are positively correlated, the β correlation obtained from the linear regression overestimates the true (causal) relationship between education and IQ scores.
According to well-known results from econometrics (32–34), the omitted variable problem in a situation like this can be solved by the method of IV if we are able to find an instrument, zi, that is correlated with years of schooling, xi, but uncorrelated with the error term, εi, in Eq. 2. The compulsory school reform implemented in Norway in the 1960s and 1970s is a candidate for such an instrument because whether or not a person was affected by the reform is correlated with schooling attainments, and one can argue for and analyze whether it is unlikely to be correlated with other factors subsumed under εi. If the reform affected IQ scores only by increasing the amount of schooling obtained by Norwegian men, our second approach based on IV allows us to obtain an estimate of the effect of an additional 1 y of schooling on individual IQ scores. We can formulate this by expressing schooling as a function of the reform (as well as other relevant covariates):
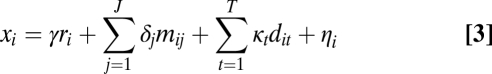 |
where ri is an indicator variable for whether or not a person is affected by the reform; γ, δ, and κ are coefficients to be estimated; and ηi is an error term. The full estimation problem now becomes a system of two simultaneous linear equations (Eqs. 2 and 3), and it can be estimated by 2SLS [further technical details on this method are provided by Wooldridge (32)].
Because the reform also involved standardization of the school curriculum in the new type of middle school created by the reform, it is possible that at least part of the total effect of the reform was attributable to a change in the quality or nature, rather than the quantity, of the education provided on introduction of the reform; [e.g., Marsh et al. (35) discuss how an educational reform affected self-perceptions of ability in Germany]. Thus, with the IV/2SLS approach, the additional assumption that increasing length of education was the exclusive mechanism by which the reform affected IQ may not be tenable. Note that this additional assumption does not apply to the DID approach. In other words, regardless of whether the effect of the reform is attributable to changes in quantity or quality, the DID estimate of the effect of the reform remains valid and does reflect an effect of education attributable to the reform as a whole. Despite such caveats to the application of the IV/2SLS approach, we find it useful to present those results because we can compare them with results from a basic linear regression of IQ on education with the same controls for municipality and birth cohort. Because a basic linear regression of IQ on education is likely to yield an upwardly biased estimate of the effect of education on IQ, comparison of the IV/2SLS results with a basic linear regression allows us to obtain a sense of the magnitude of the effect of schooling on IQ obtained with our quasiexperimental approach.
To see the relationship between the IV and DID methods, we can substitute Eq. 3 into Eq. 2, which yields:
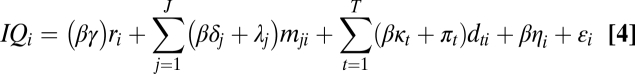 |
Comparing this with the DID specification in Eq. 1 and defining , we see that the IV/2SLS strategy decomposes the effect of the reform (estimated with the DID approach) into two parts: (i) the effect of the reform on educational attainment, γ, and (ii) the effect of educational attainment on IQ, β.
As mentioned above, the last prereform cohort appears to have been partly affected by the reform in many municipalities. Including partially treated individuals in the analysis leads to attenuation bias (bias toward 0) in the estimation of the reform effect, and the last prereform cohort in each municipality is therefore excluded from the main analyses of this study. Results estimated with the last prereform cohort included are, however, also presented and briefly discussed later.
Robust SEs based on the sandwich (or Huber–White) estimate of variance (36, 37) with clustering by municipality/cohort groupings are reported. SEs that allow for potential serial correlation (within a municipality) were also estimated by clustering on municipality, as suggested by Bertrand et al. (38).
We can also interpret the magnitude of the reform effect by comparing it with the Flynn effect in the relevant period (i.e., for cohorts born during the period 1950–1958). There is broad consensus that the Flynn effect represents a very large increase in average IQ scores over time; in discussing the Flynn effect, a task force appointed by the Board of Scientific Affairs of the American Psychological Association concluded: “The sheer extent of these increases is remarkable” (ref. 1, p. 89). Further detailed discussion of the trend of rising IQ scores in Norway during the second half of the 20th century as documented in previous studies is provided in SI Text. Because we have access to individual data, we are able to estimate average yearly growth over the birth cohorts we study (1950–1958) by means of a linear regression of IQ on a linear time trend with additional controls for place of residence (i.e., with a specification closer to that used for the main analysis). This indicates that IQ scores were increasing by roughly 0.202 IQ points per cohort (year) during the period we study and that the total Flynn effect for the nine cohorts included in this study thus amounted to a little over 1.6 IQ points. The Flynn effect for the period we study is slightly lower than for earlier decades (29).
Results
The basic descriptive results documented in Fig. 1 provide a glimpse of the relationship between the reform and changes in education and IQ scores by indicating how both average educational attainment and average IQ scores are related to the timing of the reform. An unusually large increase in both average education and average IQ is apparent at the same time as the reform was introduced. As mentioned above, the cohort immediately preceding the first full reform cohort was partially affected by the reform, and this can account for the unusually large increase in schooling from 2 y to 1 y before the reform.
Fig. 1.

Average IQ and education by time to reform.
Table 1 presents the estimated effect of the reform from the full specification of the empirical approaches, which controls for both municipal-specific (average) effects and general (average) time trends in IQ and/or educational attainment by specifying indicator variables for each municipality and birth cohort. The quasiexperimental results suggest that the reform increased the average IQ score for Norwegian men by a statistically significant 0.6 IQ points. With the IV/2SLS approach, this translates into the reform increasing education by 0.16 y and an additional 1 y of schooling raising IQ by a statistically significant 3.7 points. For comparison, a basic linear regression of IQ on education suggests that an additional 1 y of education is, on average, associated with roughly a 5.0-point higher IQ score. Hence, the effect of education on IQ estimated in this study is, as expected, somewhat lower than the relationship between IQ and education obtained from a basic regression analysis, but it is still quite substantial. The magnitude of the effect found here is broadly similar to the estimated effect of 1 y of education in the few previous studies that have made various attempts to account for self-selection in educational attainment when studying the relationship between education and IQ (e.g., 8–10).
Table 1.
Effect of schooling on IQ
| Effect of | Linear regression | Quasiexperiment |
| Reform on average IQ | 0.603 | |
| (SE) | (0.174) | |
| Reform on schooling | 0.163 | 0.163 |
| (SE) | (0.017) | (0.017) |
| 1 y of schooling on IQ | 5.057 | 3.692 |
| (SE) | (0.030) | (0.914) |
| No. observations | 107,223 | 107,223 |
Indicator variables for municipality of residence and birth cohort are included in both specifications. The population for analysis consists of men born during the period 1950–1958 for whom IQ scores are available and who lived in a municipality where the timing of reform introduction could be identified. The last prereform cohort is excluded. The linear regression results are estimated by ordinary least squares. For the quasiexperimental results, the effect of the reform on IQ score is a DID estimate and the effects of the reform on schooling and of 1 y of schooling on IQ score are estimated by the 2SLS method. Under appropriate assumptions, the effect of education on IQ score is equal to the ratio of the effect of the reform on IQ score and the effect of the reform on schooling. Robust SEs based on the sandwich (or Huber–White) estimate of variance with clustering by municipality/cohort groupings are reported.
As noted above, we estimate the Flynn effect to be roughly 0.202 IQ points per year or 1.6 IQ points over the cohorts we study. Thus, the reform effect of 0.6 IQ points is equivalent to 3 y of the average Flynn effect in Norway at the time of the reform. However, the reform itself obviously represents a contribution to the total Flynn effect in the period. Because we estimate the total reform effect to be 0.6 IQ points and the total Flynn effect to be roughly 1.6 IQ points, we can attribute over one-third of the Flynn effect to the direct effect of the educational reform for the population of cohorts we study.
To document the robustness of our results, we performed a number of complementary analyses, including alternative modeling of the time trend, construction of “placebo” reforms, estimation with information on the full length of education (including that completed after draft assessment), investigation of the possibility of selective migration in response to or anticipation of the reform, and alternative estimates of SEs that account for potential serial correlation by municipality, as suggested by Bertrand et al. (38). The first robustness check, reported in the column labeled [2] in Table 2, documents that we also uncover statistically significant and sizeable effects of the reform even when the potentially problematic last prereform cohort is included in the analysis.
Table 2.
Robustness checks
| Effects of | [1] | [2] | [3] | [4] | [5] | [6] | [7] |
| Reform on average IQ | 0.603 | 0.363 | 0.619 | 0.847 | 0.962 | 0.603 | 0.603 |
| (SE) | (0.174) | (0.154) | (0.187) | (0.201) | (0.262) | (0.174) | (0.231) |
| Reform on schooling | 0.163 | 0.152 | 0.190 | 0.211 | 0.206 | 0.172 | 0.163 |
| (SE) | (0.017) | (0.014) | (0.019) | (0.023) | (0.033) | (0.031) | (0.016) |
| One year of schooling on IQ | 3.692 | 2.389 | 3.267 | 4.018 | 4.680 | 3.504 | 3.692 |
| (SE) | (0.914) | (0.891) | (0.853) | (0.815) | (1.135) | (0.856) | (1.216) |
| No. observations | 107,223 | 117,564 | 79,905 | 107,223 | 107,223 | 107,223 | 107,223 |
| Municipal indicator variables | ✓ | ✓ | ✓ | ✓ | ✓ | ✓ | ✓ |
| Cohort indicator variables | ✓ | ✓ | ✓ | ✓ | ✓ | ||
| Reform 1951–1958 only | ✓ | ||||||
| Municipal linear trend | ✓ | ||||||
| Municipal quadratic trend | ✓ | ||||||
| Excluding last prereform cohort | ✓ | ✓ | ✓ | ✓ | ✓ | ✓ | |
| Full length of education at the age of 30 y | ✓ | ||||||
| SE with clustering on municipality | ✓ |
Robust SEs based on the sandwich (or Huber–White) estimate of variance with clustering by municipality/cohort groupings are reported. Column [1] repeats the baseline estimates from Table 1. Column [2] presents results when the cohort immediately preceding full reform implementation is included. Column [3] presents results for a sample consisting only of those municipalities that introduced the reform during the period 1951–1958. Column [4] presents results from a specification with municipal-specific linear trends. Column [5] presents results from a specification with municipal-specific quadratic trends. Column [6] presents results with full length of education at the age of 30 y. Column [7] presents alternative robust SEs with clustering on municipality.
The manner in which the compulsory school reform occurred in Norway, in different municipalities in different years over a period of several years, allows us to control for time trends in educational attainment and IQ scores, and thus helps to rule out the possibility that such trends are driving our results. We are essentially able to compare educational and IQ gains in municipalities that introduced the reform in any given year with the time trend occurring in the other municipalities that did not introduce the reform that year. Thus, the most important identifying assumption in the results from the main specification (presented in Table 1) (i.e., the assumption needed to interpret the results as “true” or causal effects of the reform) posits that the introduction of the reform is not correlated with underlying trends in IQ at the municipality level. In other words, in the main results, we have assumed that the year-to-year trend in average IQ scores for municipalities that did not introduce the reform in any given year is an appropriate counterfactual for the year-to-year trend in average IQ scores for municipalities that introduced the reform in that given year. Several of the robustness analyses we report here aim to document that underlying differences in time trends are not the primary driving force behind our main results.
Because data limitations force us to restrict our analysis to men from the birth cohorts born during the period 1950–1958, all the men born into those cohorts in municipalities that introduced the reform for cohorts born either before 1951 or after 1958 only serve as controls for the general time trend in our main specification. If the time trend in those early- and late-implementing municipalities was very different from the time trend in the other municipalities, this could lead to spurious results on the effect of schooling on IQ scores. A simple way to ensure that our results are not driven by differences in time trends for municipalities that introduced the reform before 1951 or after 1958 is to reestimate the model, excluding persons who lived in those early- and late-reform communities. As the column labeled [3] in Table 2 indicates, this exercise reduces the sample by about 25% but does not substantially change the parameter estimates.
Another manner in which we can ensure that our results are not largely driven by differences in trends for different municipalities is to estimate trends separately for each municipality within our analysis. We are unable to estimate such a flexible specification of the time trend with separate cohort indicator variables for each separate municipality because the indicator variable for reform year would be collinear with the indicator variable for one of the calendar years (i.e., the year of the reform) for any given municipality. We can instead study two alternative specifications of municipal-specific trends, a linear time trend for each municipality and one where the passing of time enters as a quadratic function. Results with a linear municipal-specific time trend, reported in the column labeled [4] in Table 2, and a quadratic time trend for each municipality (column labeled [5] in Table 2) are also in line with results from the main specification.
In the main analysis, we imputed years of completed education at the age of 19 y, when the military cognitive ability test is generally taken, and use that measure of education in the main analysis. The main motivation for this is that it is only education up until the time of test-taking that can have a direct effect on IQ measured by that particular test. However, the reform might also have had an effect on educational attainment beyond the age of 19 y. Because information on educational attainment is not used directly in the DID approach, the estimate of the effect of the reform on IQ in the DID approach remains valid. However, for both general understanding of the workings of the reform and assessment of the IV/2SLS approach, it is useful to measure the effect of the reform on full educational attainment at the age of 30 y. As documented in column [6] in Table 2, the reform had little effect on educational attainment beyond the secondary level; use of information on full educational attainment only increases the effect of the reform on education from 0.163 to 0.172. Furthermore, the IV/2SLS estimate of the effect of education on IQ is unaffected to all intents and purposes.
As pointed out by Bertrand et al. (38), failure to account for potential serial correlation in outcome variables when estimating SEs in a DID model can lead to erroneous rejection of a null hypothesis of no effect. Thus, to check that our main conclusions are robust to possible serial correlation, we also calculated SEs with clustering at the municipality level, as suggested by Bertrand et al. (38). The last column of Table 2 (labeled [7]) presents the alternative SEs estimated with clustering at the municipality level for the main specification. The alternative SEs with clustering on municipality are slightly larger than the SEs reported in Table 1 but are still far from large enough to alter the main conclusion that education has a strong, statistically significant effect on IQ score.
Another manner in which to check the robustness of results is to construct a placebo reform (i.e., act as if the reform took place either before or after the actual reform was implemented) and see if we pick up a statistically significant effect of the placebo. If we uncover a statistically significant effect of the placebo, our main results from the actual reform are likely to be spurious, caused by other underlying differences among municipalities. We can construct a placebo before the timing of the actual reform by subtracting a given number of years from the actual reform timing and excluding all the real postreform cohorts. Given that the last prereform cohort in many municipalities appears to have been affected by the reform, the constructed placebo has to be at least 2 y before the true reform. We also constructed a similar placebo 2 y after the true reform dates, excluding all (real) prereform cohorts from the analysis.
The columns labeled “Placebo” in Table 3 document that we do not uncover statistically significant effects from such placebo analyses. Because we need to exclude certain cohorts from such analyses, we are also dramatically reducing the sample size when we study the constructed placebo reforms. In and of itself, decrease in sample size reduces the precision of any estimates (compare with Table 1) and can obscure any effects of the placebo. Thus, for each of the reported placebo analyses, we also present results based on the actual reform, with the sample trimmed in the same manner as is necessary for the placebo analyses. For a placebo constructed 2 y before the actual reform, this means that we need to limit our analysis to municipalities that implemented the reform during the period 1953–1958 and to exclude any true postreform cohorts, as well as the last prereform cohort (which we know was partially affected by the reform). For a placebo constructed 2 y after the actual reform, this means that we need to limit our analysis to municipalities that implemented the reform during the period 1951–1956 and exclude any true prereform cohorts. The real reform results from those two different comparison samples, presented in the columns labeled “Reform comparison” in Table 3, are very similar to all our preceding results from the full sample for analysis and document that the lack of statistically significant results from the placebos is not simply the result of other sample restrictions in the placebo analyses. Thus, we can conclude that our placebo analysis also gives no indication of the main analysis picking up spurious reform effects.
Table 3.
Placebo analysis
| Prereform placebo (2 y before reform) |
Postreform placebo (2 y after reform) |
|||
| Effects of | Reform comparison | Placebo | Reform comparison | Placebo |
| Reform on IQ | 0.900 | −0.413 | 0.698 | −0.032 |
| (SE) | (0.262) | (0.229) | (0.238) | (0.201) |
| Reform on schooling | 0.200 | −0.035 | 0.191 | −0.002 |
| (SE) | (0.034) | (0.031) | (0.025) | (0.020) |
| Municipal indicators | ✓ | ✓ | ✓ | ✓ |
| Cohort indicators | ✓ | ✓ | ✓ | ✓ |
| Excluding prereform cohort | ✓ | ✓ | ||
| Reform 1953–1958 | ✓ | ✓ | ||
| Reform 1951–1956 | ✓ | ✓ | ||
| No. observations | 34,043 | 27,418 | 54,324 | 56,105 |
The table documents the coefficient estimates of reform on IQ and schooling with indicator variables for municipality of residence and birth cohort included in all specifications. The columns labeled “Placebo” indicate estimates where the dating of the reform is 2 y prior or 2 y after actual reform introduction. The columns labeled “Reform comparison” include the same sample restrictions necessary for the placebo analyses for the actual reform timing (i.e., municipalities that introduced the reform during period 1951–1956 for postreform placebo comparison and during the period 1953–1958 for prereform placebo comparison and exclusion of all the real postreform cohorts). The last prereform cohort is excluded from the analysis. Robust SEs based on the sandwich (or Huber–White) estimate of variance with clustering by municipality/cohort groupings are reported.
Because it is conceivable, at least in theory, that individuals knew (or could have found out) when the reform was planned in different municipalities, some families may have moved so that their children would have access to the postreform schooling system (or would remain within the old schooling system). To exclude this possibility, we performed an analysis of the change in the size of the relevant school population at the age of 14 y in each municipality. More specifically, we performed a DID analysis with the same specification of control variables as in Eq. 1 but where the dependent variable was the number or natural logarithm of the number of pupils aged 14 y in the municipality. The sample was otherwise the same as that used in the analysis. If introduction of the reform attracted students from nonreform municipalities, we would expect to find a statistically significant positive effect of the reform on the number of pupils aged 14 y. We were unable to uncover such an effect of the reform (see Supporting Information), and therefore conclude that there is little evidence to support the idea of selective migration in response to (or anticipation of) the reform.
Discussion
By exploiting the increase in schooling induced by a comprehensive compulsory schooling reform, this study is able to uncover a statistically significant and sizeable effect of middle-school education on IQ scores in early adulthood for Norwegian men. The robustness checks and complementary analyses performed as part of this research give little reason to suspect that the main results on the effect of education in midadolescence on IQ scores in young adulthood are spurious. The relevance of these results extends to a number of major discussions in the social sciences, but some caution ought to be exercised when extrapolating our results to other educational interventions or, in general, to other contexts and countries (39, 40). Particular features of the Norwegian educational system and/or Norwegian society at the time may have been major factors that enabled this reform to have such a marked effect.
As pointed out in the introductory section, the effect of education on IQ has been a recurring theme of great controversy and contention, with scholars often interpreting the existing evidence in vastly different ways. The unique “quasiexperimental” nature of the Norwegian compulsory schooling reform, combined with opportunities afforded by comprehensive detailed register data, provides a particularly valuable framework with which to study and reconsider this issue. These results do not directly challenge the recent emphasis placed on early childhood environment for the development of cognitive skills (4, 5) because that also depends on the higher cost-effectiveness of early interventions; however, given the paucity of evidence on any effects of later interventions on cognitive ability, these results suggest that we should not yet entirely disregard the potential of interventions even as late as in adolescence. Finally, this study represents a unique case in which we are able to attribute a substantial portion, roughly one-third, of the Flynn effect in a certain period directly to a specific cause, a large-scale educational intervention.
Supplementary Material
Acknowledgments
We thank Manudeep Singh Bhuller, Magne Mogstad, Gro Nygaard, Steve Pudney, Kjell Salvanes, Alfred Oftedal Telhaug, Kjetil Telle, and two anonymous referees for comments. While carrying out this research, C.N.B. was associated with the Centre of Equality, Social Organization, and Performance (ESOP) at the Department of Economics, University of Oslo. ESOP is supported by the Research Council of Norway.
Footnotes
The authors declare no conflict of interest.
This article is a PNAS Direct Submission.
This article contains supporting information online at www.pnas.org/lookup/suppl/doi:10.1073/pnas.1106077109/-/DCSupplemental.
References
- 1.Neisser U, et al. Intelligence: Knowns and unknowns. Am Psychol. 1996;51:77–101. [Google Scholar]
- 2.Heckman JJ, Stixrud J, Urzua S. The effects of cognitive and noncognitive abilities on labor market outcomes and behaviour. J Labor Econ. 2006;24:411–482. [Google Scholar]
- 3.Herrnstein RJ, Murray C. The Bell Curve: Intelligence and Class Structure in American Life. New York: Free Press; 1994. [Google Scholar]
- 4.Knudsen EI, Heckman JJ, Cameron JL, Shonkoff JP. Economic, neurobiological, and behavioral perspectives on building America's future workforce. Proc Natl Acad Sci USA. 2006;103:10155–10162. doi: 10.1073/pnas.0600888103. [DOI] [PMC free article] [PubMed] [Google Scholar]
- 5.Heckman JJ. Skill formation and the economics of investing in disadvantaged children. Science. 2006;312:1900–1902. doi: 10.1126/science.1128898. [DOI] [PubMed] [Google Scholar]
- 6.Burchinal MR, Campbell FA, Bryant DM, Wasik BH, Ramey CT. Early intervention and mediating processes in cognitive performance of children of low-income African American families. Child Dev. 1997;68:935–954. doi: 10.1111/j.1467-8624.1997.tb01972.x. [DOI] [PubMed] [Google Scholar]
- 7.Ceci SJ. How much does schooling influence general intelligence and its cognitive components? A reassessment of the evidence. Dev Psychol. 1991;27:703–722. [Google Scholar]
- 8.Winship C, Korenman S. In: Intelligence, Genes, and Success. Scientists Respond to the Bell Curve. Devlin B, Fienberg SE, Resnick DP, Roeder K, editors. New York: Springer; 1997. pp. 215–234. [Google Scholar]
- 9.Cascio EU, Lewis EG. Schooling and the Armed Forces qualifying test. Evidence from school-entry laws. J Hum Resour. 2006;41:294–318. [Google Scholar]
- 10.Falch T, Massih SS. The effect of education on cognitive ability. Econ Inq. 2011;49:838–856. doi: 10.1111/j.1465-7295.2010.00312.x. [DOI] [PubMed] [Google Scholar]
- 11.Hansen K, Heckman JJ, Mullen KJ. The effect of schooling and ability on achievement test scores. J Econom. 2004;121:39–98. [Google Scholar]
- 12.Brouwers SA, Mishra RC, Van de Vijver FJR. Schooling and everyday cognitive development among Kharwar children in India: A natural experiment. Int J Behav Dev. 2006;30:559–567. [Google Scholar]
- 13.Van de Vijver FJR, Brouwers SA. Schooling and basic aspects of intelligence: A natural quasi-experiment in Malawi. J Appl Dev Psychol. 2009;30:67–74. [Google Scholar]
- 14.Flynn JR. Massive IQ gains in 14 nations. Psychol Bull. 1987;101:171–191. [Google Scholar]
- 15.Aakvik A, Salvanes KG, Vaage K. Measuring heterogeneity in the returns to education using an education reform. Eur Econ Rev. 2010;54:483–500. [Google Scholar]
- 16.Monstad K, Salvanes KG, Propper C. Education and fertility: Evidence from a natural experiment. Scand J Econ. 2008;110:827–853. [Google Scholar]
- 17.Black SE, Devereux PJ, Salvanes KG. Staying in the classroom and out of the maternity ward? The effect of compulsory schooling laws on teenage births. Econ J. 2008;118:1025–1054. [Google Scholar]
- 18.Black SE, Devereux PJ, Salvanes KG. Why the apple doesn't fall far: Understanding intergenerational transmission of human capital. Am Econ Rev. 2005;95:437–449. [Google Scholar]
- 19.Harmon C, Walker I. Estimates of the economic return to schooling for the United Kingdom. Am Econ Rev. 1995;85:1278–1286. [Google Scholar]
- 20.Ichino A, Winter-Ebmer R. Lower and upper bounds of returns to schooling: An exercise in IV estimation with different instruments. Eur Econ Rev. 1999;43:889–901. [Google Scholar]
- 21.Meghir C, Palme M. Educational reform, ability, and family background. Am Econ Rev. 2005;95:414–424. [Google Scholar]
- 22.Brunello G, Fort M, Weber G. Changes in compulsory schooling, education and the distribution of wages in Europe. Econ J. 2009;119:516–539. [Google Scholar]
- 23.Telhaug AO. Norwegian School Development After 1945. Oslo: Didakta; 1982. (in Norwegian) [Google Scholar]
- 24.Myhre R. Development of the Norwegian School. Oslo: Ad Notam Gyldendal; 1992. (in Norwegian) [Google Scholar]
- 25.Lie S. Regulated social change: A diffusion study of the Norwegian comprehensive school reform. Acta Sociol. 1974;16:332–350. [Google Scholar]
- 26.Kristensen P, Bjerkedal T. Explaining the relation between birth order and intelligence. Science. 2007;316:1717. doi: 10.1126/science.1141493. [DOI] [PubMed] [Google Scholar]
- 27.Sundet JM, Tambs K, Magnus P, Berg K. On the question of secular trends in the heritability of IQ test scores: A study of Norwegian twins. Intelligence. 1988;12:47–59. [Google Scholar]
- 28.Black SE, Devereux PJ, Salvanes KG. From the cradle to the job market? The effect of birth weight on adult outcomes of children. Q J Econ. 2007;122:409–439. [Google Scholar]
- 29.Sundet JM, Barlaug DG, Torjussen TM. The end of the Flynn effect? A study of secular trends in mean intelligence test scores of Norwegian conscripts during half a century. Intelligence. 2004;32:349–362. [Google Scholar]
- 30.Sundet JM, Tambs K, Harris JR, Magnus P, Torjussen TM. Resolving the genetic and environmental sources of the correlation between height and intelligence: A study of nearly 2600 Norwegian male twin pairs. Twin Res Hum Genet. 2005;8:307–311. doi: 10.1375/1832427054936745. [DOI] [PubMed] [Google Scholar]
- 31.Black SE, Devereux PJ, Salvanes KG. Like father like son: A note on the intergenerational transmission of IQ scores. Econ Lett. 2009;105:138–140. [Google Scholar]
- 32.Wooldridge JM. Econometric Analysis of Cross Section and Panel Data. Cambridge, MA: MIT Press; 2002. [Google Scholar]
- 33.Imbens GW, Wooldridge JM. Recent developments in the econometrics of program evaluation. J Econ Lit. 2009;47:5–86. [Google Scholar]
- 34.Moffitt R. Remarks on the analysis of causal relationships in population research. Demography. 2005;42:91–108. doi: 10.1353/dem.2005.0006. [DOI] [PubMed] [Google Scholar]
- 35.Marsh HW, Köller O, Baumert J. Reunification of East and West German school systems: Longitudinal multilevel modeling study of the big-fish-little-pond effect on academic self-concept. Am Educ Res J. 2001;38:321–350. [Google Scholar]
- 36.Huber PJ. Proceedings of the Fifth Berkeley Symposium on Mathematical Statistics and Probability. Berkeley, CA: Univ of California Press; 1967. pp. 221–233. [Google Scholar]
- 37.White H. A heteroscedasticity-consistent covariance matrix estimator and a direct test for heteroscedasticity. Econometrica. 1980;48:817–830. [Google Scholar]
- 38.Bertrand M, Duflo E, Mullainathan S. How much should we trust differences-in-differences estimates? Q J Econ. 2004;119:249–275. [Google Scholar]
- 39.Rindermann H, Ceci SJ. Educational policy and country outcomes in international cognitive competence studies. Perspect Psychol Sci. 2009;4:551–577. doi: 10.1111/j.1745-6924.2009.01165.x. [DOI] [PubMed] [Google Scholar]
- 40.Brouwers SA, Van de Vijver FJR, Van Hemert DA. Variation in Raven's Progressive Matrices scores across time and place. Learn Individ Differ. 2009;19:330–338. [Google Scholar]
Associated Data
This section collects any data citations, data availability statements, or supplementary materials included in this article.