Abstract
Introduction
The role of matrix metalloproteinases (MMPs) in type 2 diabetes mellitus (DM) is not clear as increased activation of MMPs in the vasculature contrasts with decreased activity of MMPs in the kidneys, contributing to development of nephropathy.
Material and methods
We measured serum MMP-2 and MMP-9 in 22 subjects with type 2 DM age (mean ± SD) 56.7 ±16.8 years, BMI 31.8 ±4.6 kg/m2, HbA1c 8.45 ±1.78% and in 32 controls, age 39.2 ±16.0 years, BMI 35.2 ±8.5 kg/m2. In 15 subjects with 2 DM we also measured MMP-2 and MMP-9 at discharge from hospital and after 3 months (n = 8). In controls, MMP-2 and -9 were also measured during 75 g oral glucose tolerance test (OGTT).
Results
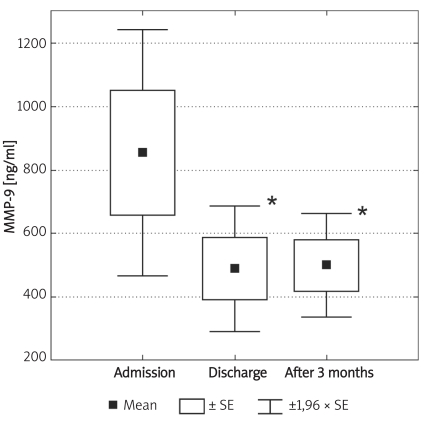
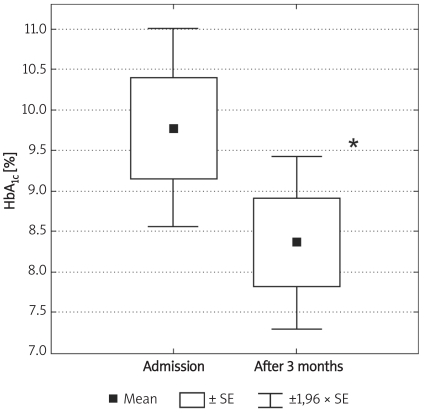
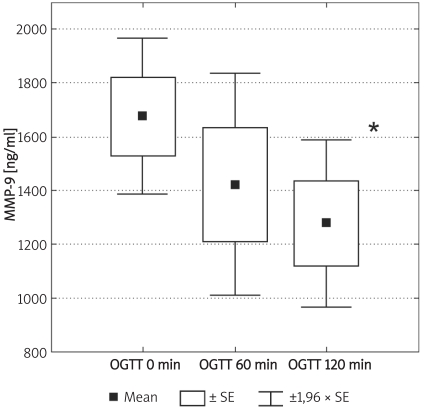
Concentrations of MMP-2 and MMP-9 were lower in subjects with type 2 DM (219 ±62 ng/ml vs. 305 ±63 ng/ml and 716 ±469 ng/ml vs. 1285 ±470 ng/ml, for MMP-2 and MMP-9, respectively, p < 0.05). MMP-9 concentrations fell at 120 min of OGTT from 1675 ±372 ng/ml to 1276 ±422 ng/ml (p < 0.05). In diabetic subjects there was a correlation between MMP-9 and HbA1c (r = 0.51, p< 0.05). In subjects with diabetes there was a fall of HbA1c from 9.77 ±1.76% to 8.36 ±1.54% (p < 0.01), at three months post-discharge. There was no difference in MMP-2, but there was a fall in MMP-9 at three months post-discharge in comparison to concentrations observed at admission (854 ±560 ng/ml vs. 500 ±235 ng/ml, p= 0.02).
Conclusions
Matrix metalloproteinases in type 2 and MMP-9 concentrations were lower in subjects with 2 DM than in non-diabetic controls. Regulation of MMPs appears to be complex as hyperglycaemia during OGTT results in a decrease in MMP-9, while chronic hyperglycaemia, reflected by HbA1c, correlates with MMP-9 concentrations in subjects with 2 DM.
Keywords: matrix metalloproteinases, type 2 diabetes, oral glucose tolerance test
Introduction
Abnormal carbohydrate metabolism is an important and still growing social problem. For some years it has been recognised that cardiovascular complications are the leading cause of increasing premature mortality in patients with type 2 diabetes [1-4]. Despite considerable progress in elucidation of the mechanisms leading to development of diabetic angiopathy, our understanding of the precise events involved in this process, including abnormalities in vascular remodelling, is still far from complete. Recently it has been proven that matrix metalloproteinases (MMPs) play an important role in atherosclerosis and rebuilding of the vascular wall [5].
Matrix metalloproteinases are a family of zinc-binding proteolytic enzymes that normally remodel the extracellular matrix and pathologically attack substrates as part of an inflammatory response. Increased activity of MMPs has been reported in numerous disease processes including tumour growth, arthritis and cardiovascular disease. Increased matrix degradation by MMPs within the atherosclerotic plaque has been implicated as one of the key factors that leads to plaque instability, and consequently to cardiovascular events [6]. The major MMP species in the myocardium and vasculature are the gelatinases (MMPs 2 and 9), MMP-1 (interstitial collagenase) and Mt1-MMP. Matrix metalloproteinases in type 2 and MMP-9 specifically attack type IV collagen, laminin, and fibronectin, major components of the basal lamina around blood vessels [7]. Matrix metalloproteinases in type 2 diabetes, found in human arteries, have been implicated in acute myocardial ischaemia and reperfusion injury [8], and along with MMP-9 play a major role in myocardial and vascular matrix remodelling [9]. Furthermore, increased expression of MMP-9 has been demonstrated in the vulnerable regions of human atherosclerotic plaques [10]. Metalloproteinases also participate in the formation and destabilization of the atherosclerotic plaque. A key role in this phenomenon is linked with activation of MMP-1, MMP-2, MMP-3, MMP-7 and MMP-9 within atherosclerotic arteries [11]. Circulatory levels of MMP-2 and MMP-9 are reported to be raised in patients with acute coronary syndromes [12]. Increased expression and activation of MMP-2 and MMP-9 were found in cerebral ischaemia [13], whilst increased MMP-9 expression has been related to haemorrhagic transformation of cardio-embolic stroke [14].
In comparison with the general population, atherosclerosis in diabetic patients manifests earlier, is more severe and has a more disseminated character. Moreover, diabetic patients die more frequently of myocardial infarction, suffer from recurrent coronary events and are more prone to the development of heart insufficiency. A reason for this adverse prognosis could also be related to disturbed synthesis and activity of MMPs [15]. However, the relationship between MMPs and their inhibitors (tissue inhibitors of matrix metalloproteinases – TIMPs) and diabetic angiopathy is less well defined. Hyperglycaemia directly or indirectly (e.g., via oxidative stress or advanced glycation products) might increase MMP expression and activity in large vessels [16]. On the other hand, low proteolytic activity of MMPs contributes to diabetic nephropathy [17, 18], probably via increased glycation-related activity of TIMP-2, the principal inhibitor of MMP-2 [19]. Within atherosclerotic plaques an imbalance between MMPs and TIMPs may induce matrix degradation, resulting in an increased risk of plaque rupture. Furthermore, because MMPs enhance blood coagulability they may play a role in acute thrombotic occlusion of vessels and consequent cardiovascular events [20].
Despite these data, the role of MMPs in development of complications of type 2 diabetes (DM) is not fully understood. Some studies demonstrate increased activity of MMPs in diabetic vasculature [16], or skin fibroblasts [21], but simultaneously there is no evidence of increased MMP synthesis in venous monocytes in subjects with type 2 DM [22], while decreased activity of MMPs (and MMP-2 in particular) has been reported in diabetic nephropathy [17-19].
In our study, we have therefore endeavoured to compare concentrations of selected matrix metalloproteinases (MMP-2, MMP-9) in subjects with diabetes and in non-diabetic controls. We have also endeavoured to determine the effects of short-term hyperglycaemia during an oral glucose tolerance test (OGTT) as well as the effects of chronic hyperglycaemia on serum concentrations of MMP-2 and MMP-9.
Material and methods
The study involved 22 subjects with type 2 DM age (mean ± SD) 56.7 ±16.8 years, BMI 31.8 ±4.6 kg/m2, HbA1c 8.45 ±1.78% and 32 non-diabetic, normal glucose tolerance controls, age 39.2 ±16.0 years, BMI 35.2 ±8.5 kg/m2. Normal glucose tolerance was defined as glucose levels at 120 min of OGTT of no more than 140 mg/dl – 7.8 mmol/l, and fasting glucose no more than 110 mg/dl – 6.1 mmol/l. The design of the study was approved by the Ethical Committee of The Polish Mother’s Memorial Research Institute (Poland). Thirty out of 32 controls were treatment-naI..ve, and the remaining two received antihypertensive medication (ACE inhibitors and thiazide diuretics). Fifteen out of 22 subjects with type 2 diabetes were hospitalized because of unsatisfactory diabetic control, and the others for investigations of proteinuria (three) or ischaemic heart disease (four). The latter subjects had been admitted with chest pains suggestive of unstable angina, but eventually had no elevation of troponin concentrations and were referred for outpatient exercise ECG. Three out of 22 subjects with type 2 diabetes were treated with insulin, seven were treated with a combination of sulfonylurea (Gliclazide) and metformin, two with sulfonylurea alone, while the remaining subjects were treated with either metformin or acarbose, or a combination of both. All diabetic patients had normal creatinine; however, seven had evidence of nephropathy (three with frank proteinuria and four with microalbuminuria), and one patient also had pre-proliferative retinopathy. Fourteen patients with type 2 diabetes had macrovascular complications, including a history of myocardial infarction (5 patients), confirmed ischaemic heart disease (6 patients), a history of cerebrovascular accident with good neurological recovery (2 patients), and confirmed evidence of carotid artery stenosis (1 patient). Twenty out of 22 patients with diabetes received treatment with ACE inhibitors or angiotensin receptor blockers, half of them also received amlodipine (a calcium channel blocker), eight patients with macrovascular complications received treatment with statins (simvastatin or atorvastatin) and aspirin at initial assessment, while all patients with diabetes were prescribed statins and aspirin at the time of hospital discharge (n = 15). In patients with type 2 diabetes serum concentrations of MMP-2 and MMP-9 were measured in the clinic or at admission (n = 22), at discharge from the hospital (n = 15) and at three months after discharge (n = 8). In a subgroup of eight control subjects MMP-2 and MMP-9 concentrations were also measured at 0, 60 and 120 min of 75 g OGTT. Control subjects were recruited either from the Obesity and Metabolic Syndrome Clinic of The Polish Mother’s Memorial Research Institute (Poland), or from the Gastroenterological Clinic in St Alexander Hospital, Kielce, Poland. In the latter clinic, we recruited patients who presented with symptoms suggestive of gastroesophageal reflux, had no evidence of cardiovascular disease, and subsequently were found to have no abnormalities on gastroscopy. At the time of initial assessment control subjects did not receive any medication that might interfere with blood concentrations of MMPs. In controls we also assessed parameters of insulin resistance by means of HOMA and the Insulin Resistance Index (IRI). The HOMA index was calculated from fasting glucose and insulin concentrations according the formula: Glucose0min (mmol/l) × Insulin0min (µU/ml)/22.5 [23]. Insulin Resistance Index was calculated through the formula: 2/[1/(INSp × GLYp)] + 1, where INSp and GLYp are the measured insulin and glycaemic areas [24]. Insulin Resistance Index is a method based on changes of glycaemia and insulinaemia during OGTT, and correlates well with the euglycaemic hyperinsulinaemic glucose clamp technique [25]. Serum total MMP-2 and MMP-9 concentrations were measured by ELISA assays (MMP-2: Human, Biotrak ELISA System; Amersham Biosciences, intra-assay precision [CV] 6.3%; MMP-9 (total): R and D Systems, Minneapolis, USA, CV 2.9%).
Statistical analysis
The data were analysed by means of simple descriptive statistics of location and dispersion and tests of significance for comparison of distributions in different groups (parametric or non-parametric tests depending on the distribution of analysed variables): the t-test (paired or for independent groups) and Mann-Whitney or Wilcoxon matched paired test. Repeated measurements in controls (in OGTT test) and diabetes (on admission, discharge and follow-up) were also analysed by Friedman’s ANOVA by ranks. Associations between covariates of interest were qualified by means of Pearson or Spearman correlations, depending on the distribution of the analysed variables. Associations between covariates of interest were qualified by means of Pearson correlations. In all analyses, statistical significance was considered achieved at a value of p ≤ 0.05. All the calculations were derived by means of Statistica v8.0 software.
Results
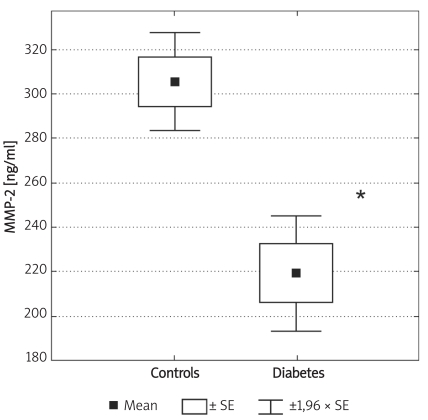
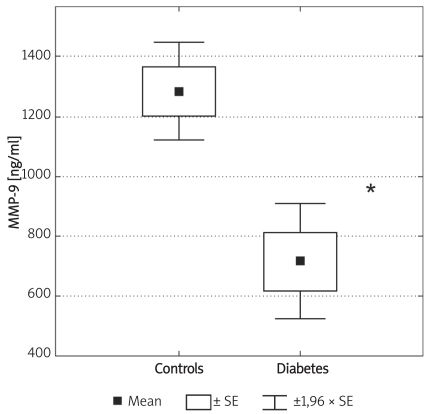
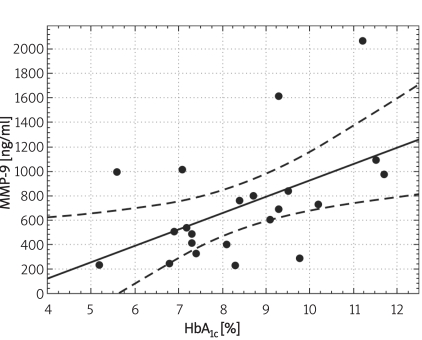
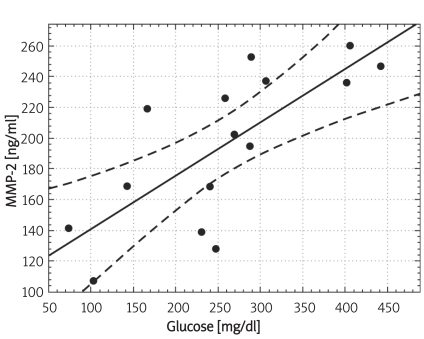
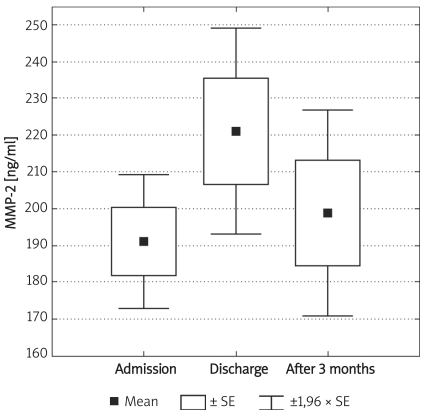
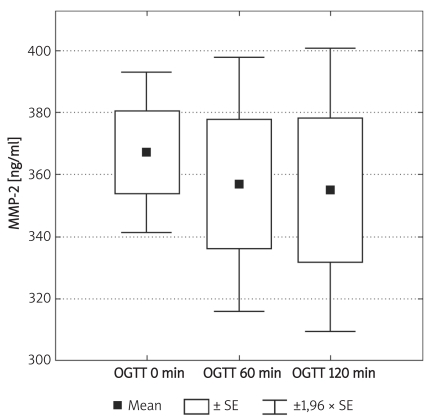
Individuals in the control group were significantly younger (p < 0.01) and non-significantly more obese (difference in BMI was not significant; p = 0.07). Demographic characteristics of analysed groups and comparison of lipid parameters are presented in Table IA. Twenty-six out of 32 controls were overweight or obese (81%), 16 (50%) had low HDL cholesterol (defined as levels below 50 mg/dl for women and 40 mg/dl for men), 10 (31%) were found to be hypertensive (BP > 130/85 mmHg), 9 (28%) had triglycerides above 150 mg/dl, 7 (21%) had fasting glucose levels between 100 mg/dl and 110 mg/dl, thus fulfilling the latest criteria for impaired fasting glucose. If NCEP/ATP III metabolic syndrome criteria were employed [26], then the diagnosis of metabolic syndrome might be established in 12 control subjects (37.5%). In the control group there was, however, no correlation between concentrations of MMPs and age or BMI. Insulin resistance indices (HOMA, IRI) in the control group are presented in Table IB. Concentrations of both MMP-2 and MMP-9 are presented in Table II and Figures 1A-B. The levels of both MMP-2 and MMP-9 were lower in subjects with type 2 DM (219 ±62 ng/ml vs. 305 ±63 ng/ml and 716 ±469 ng/ml vs. 1285 ±470 ng/ml, for MMP-2 and MMP-9, respectively, p < 0.05). In diabetic subjects there was a negative correlation between MMP-2 and age (rs = –0.55, p = 0.008) and between MMP-9 and HbA1c (rs = 0.47, p = 0.03, n = 15, Figure 2B) and BMI (rs = –0.47, p = 0.03, n = 22). In a multivariate model those two covariates (HbA1c and BMI) explained, however, only 34% of MMP-9 variability. There was also a positive correlation between MMP-2 and glucose levels on admission (rs = 0.81, p = 0.002, Figure 2A). There was also a negative correlation between MMP-9 and BMI (rs = –0.47, p = 0.03). This was, however, no longer significant (p = 0.16), when both BMI and HbA1c were included in a multivariate analysis. In subjects with type 2 DM there was no difference in MMP-2 at the time of admission vs. discharge (n = 15) from hospital and after 3 months (n = 8). In contrast, there was a trend towards lower MMP-9 levels at time of hospital discharge (p = 0.08, n = 15). In 8 subjects with MMP-9 data at all three time-points, the concentrations of MMP-9 were lower at discharge and after 3 months in comparison to levels at admission (MMP-9: 854 ±560 ng/ml at admission and 500 ±235 ng/ml after 3 months (p = 0.02, n = 8, Table II, Figures 3A-B). This was accompanied by a significant decrease in HbA1c concentrations in those patients from 9.77 ±1.76% to 8.36 ±1.54% (p < 0.01, n = 8, Figure 3C). In controls there was no correlation between both MMP-2 and MMP-9 and HOMA (r = –0.11, p = 0.54, r = 0.27, p = 0.14, for MMP-2 and MMP-9, respectively), or IRI (r = –0.03, p = 0.85, r = 0.18, p = 0.33, for MMP-2 and MMP-9, respectively). Transient hyperglycaemia during OGTT did not influence serum MMP-2 concentrations but resulted in a significant fall in MMP-9 at 0 vs. 120 min of OGTT, both when examined by t-test and by Friedman’s rank ANOVA (MMP-9 1675 ±419 ng/ml at 0 min of OGTT vs. 1276 ±452 ng/ml at 120 min of OGTT, p = 0.047 (Friedman’s rank ANOVA, Table III, Figures 4A-B).
Table 1A.
Descriptive statistics for demographic characteristics and the levels of lipid parameters in the diabetes and control group. Value of p represents the significance level of the Mann-Whitney test for comparison of distributions between groups
| Group | n | Mean ± SEM | Median | Min | Max | Value of p | |
|---|---|---|---|---|---|---|---|
| Age [years] | Diabetes | 22 | 56.65 ±3.59 | 54 | 28 | 80 | 0.01 |
| Controls | 32 | 31.84 ±2.81 | 36 | 18 | 65 | ||
| Body mass index [kg/m2] | Diabetes | 22 | 31.84 ±0.99 | 31.6 | 23.8 | 41.4 | 0.07 |
| Controls | 32 | 35.17 ±1.63 | 35.5 | 19.6 | 56.9 | ||
| Triglycerides [mg/dl] | Diabetes | 22 | 184.8 ±28.4 | 127.0 | 44.0 | 542.0 | 0.26 |
| Controls | 32 | 130.9 ±9.2 | 125.0 | 57.0 | 306.0 | ||
| Cholesterol total [mg/dl] | Diabetes | 22 | 197.1 ±9.3 | 204.0 | 116.0 | 298.0 | 0.49 |
| Controls | 32 | 194.7 ±9.0 | 189.0 | 127.0 | 408.0 | ||
| Cholesterol-LDL [mg/dl] | Diabetes | 22 | 117.1 ±8.8 | 110.0 | 70.0 | 189.0 | 0.81 |
| Controls | 32 | 121.4 ±7.8 | 113.5 | 59.00 | 295.0 | ||
| Cholesterol-HDL [mg/dl] | Diabetes | 22 | 37.2 ±2.2 | 37.0 | 25.0 | 64.0 | 0.003 |
| Controls | 32 | 46.3 ±2.2 | 43.0 | 23.00 | 83.0 |
Table 1B.
Descriptive statistics for insulin resistance indices HOMA [23] and Insulin Resistance Index (IRI) [24, 25] in the control group (n = 32)
| Mean | Median | Min | Max | SD | SE | |
|---|---|---|---|---|---|---|
| HOMA | 2.71 | 2.12 | 0.85 | 7.07 | 1.75 | 0.31 |
| IRI | 1.23 | 1.26 | 0.57 | 1.82 | 0.35 | 0.06 |
Table II.
Descriptive statistics for the levels of plasma concentrations of matrix metalloproteinases (MMP-2 and MMP-9) in the diabetes group – at admission (Ad, n = 22), discharge (Ds, n = 15) and after 3 months of follow-up (n = 8). Value of p represents the significance level of the appropriate paired test for comparison of mean values of these characteristics in different time intervals for 15 or 8 individuals, respectively. In the additional column ‘P vs Contr’, significance levels for comparisons with the control group (n = 32) are presented (t-test). Corresponding values in the control group were 305 ±63 ng/ml and 1285 ±470 ng/ml, for MMP-2 and MMP-9, respectively. Statistical significance of the measured parameters did not change after application of the ANOVA Friedman test for comparison of MMP-2 and MMP-9 at different time intervals for 8 individuals with type 2 diabetes, where measurements were performed at all three time points (p = 0.22, and p = 0.02, for MMP-2 and MMP-9, respectively)
| n | Mean | Med | Min | Max | SD | SE | Value of p | P vs. Contr | |||
|---|---|---|---|---|---|---|---|---|---|---|---|
| MMP-2 [ng/ml] | Ad | 22 | 219 | 203 | 138 | 377 | 62 | 13 | – | – | 0.000008 |
| 15 | 208 | 195 | 155 | 377 | 55 | 14 | Ad vs. Ds | 0.55 | |||
| 8 | 191 | 195 | 157 | 227 | 26 | 9 | – | ||||
| Ds | 15 | 195 | 202 | 107 | 260 | 50 | 13 | – | 0.0000004 | ||
| 8 | 221 | 237 | 139 | 260 | 40 | 14 | Ds vs. 3m | 0.26 | |||
| 3m | 8 | 199 | 203 | 131 | 259 | 41 | 14 | Ad vs. 3m | 0.69 | 0.00006 | |
| MMP-9 [ng/ml] | Ad | 22 | 716 | 640 | 230 | 2080 | 460 | 98 | – | ||
| 15 | 730 | 530 | 230 | 2080 | 542 | 140 | Ad vs. Ds | 0.08 | 0.00005 | ||
| 8 | 854 | 700 | 280 | 2080 | 560 | 198 | Ad vs. Ds | 0.02 | |||
| Ds | 15 | 529 | 480 | 200 | 980 | 243 | 63 | – | 0.000001 | ||
| 8 | 489 | 445 | 200 | 980 | 284 | 101 | Ds vs. 3m | 0.81 | |||
| 3m | 8 | 500 | 510 | 230 | 840 | 235 | 83 | Ad vs. 3m | 0.02 | 0.00005 | |
Figure 1A.
Box and whisker plot for plasma concentrations of MMP-2 in the controls (n = 32) and subjects with type 2 diabetes (n = 22). Significantly lower values in diabetes in comparison to controls are marked by asterisk: * (p ≤ 0.0001)
Figure 1B.
Box and whisker plot for plasma concentrations of MMP-9 in the controls (n = 32) and subjects with type 2 diabetes (n = 22). Significantly lower values in diabetes in comparison to controls are marked by asterisk: * (p ≤ 0.0001)
Figure 2B.
Correlation between serum concentrations of MMP-9 and HbA1c in subjects with type 2 diabetes (n = 22, Pearson's method: r = 0.517, p = 0.014, Spearman rank correlation method: rs = 0.47, p = 0.03)
Figure 2A.
Correlation between serum concentrations of MMP-2 and glucose in subjects with type 2 diabetes on admission to hospital (n = 15) (Pearson' s method: r = 0.750, p = 0.0014, Spearman rank correlation method: rs = 0.81, p = 0.002)
Figure 3A.
Box and whisker plot for serum concentrations of MMP-2 in diabetic patients at different time intervals: admission, discharge from hospital and after three months (n = 8)
Figure 3B.
Box and whisker plot for serum concentrations of MMP-9 in diabetic patients at different time intervals: admission to hospital, discharge from hospital and after three months (n = 8). Significantly lower values in comparison to admission are marked by an asterisk: * (p ≤ 0.05)
Figure 3C.
Box and whisker plot for HbA1c in diabetic patients at admission and 3 months after discharge from hospital (n = 8). Significantly lower values in follow-up are marked by asterisk: * (p = 0.01)
Table III.
Descriptive statistics for the levels of plasma concentrations of matrix metalloproteinases (MMP-2 and MMP-9) during oral glucose tolerance test (OGTT) in the control group. Value of p represents the significance level of the ANOVA Friedman test for comparison of these characteristics in different OGTT time intervals for 8 individuals
| OGTT | n | Mean ± SEM | Median | Min | Max | Value of p | |
|---|---|---|---|---|---|---|---|
| MMP-2 [ng/ml] | 0’ | 8 | 367±13 | 357 | 335 | 454 | 0.88 |
| 60’ | 8 | 357 ±21 | 376 | 263 | 420 | ||
| 120’ | 8 | 355 ±23 | 339 | 265 | 475 | ||
| MMP-9 [ng/ml] | 0’ | 8 | 1675 ±148 | 1600 | 1180 | 2320 | 0.047 |
| 60’ | 8 | 1421 ±212 | 1485 | 450 | 2390 | ||
| 120’ | 8 | 1276 ±156 | 1245 | 570 | 2070 |
Figure 4A.
Box and whisker plot for serum concentrations of MMP-2 during 75 g oral glucose tolerance test (OGTT) in the control group (n = 8, Friedman´s rank ANOVA)
Figure 4B.
Box and whisker plot for serum concentrations of MMP-9 during OGTT in the control group (n = 8). Significantly lower values in 120 min in comparison to 0 min are marked by asterisk: * (p = 0.047, Friedman´s rank ANOVA)
Discussion
Despite the multitude of data on the potential relationship between MMPs and cardiovascular disease, and despite the well-known fact of significantly increased incidence and prevalence of cardiovascular disease in people with type 2 diabetes, the role of MMPs in development of both micro- and macrovascular complications has only recently started to be investigated. Contrary to our expectations our study demonstrated lower concentrations of both MMP-2 and MMP-9 in subjects with type 2 diabetes. Current literature data on this issue are conflicting, with some studies reporting raised blood concentrations of MMPs in subjects with type 2 DM [27, 28], while some studies demonstrated either no difference in plasma MMPs between subjects with and without type 2 DM [29], or lower concentrations of MMPs in patients with type 2 DM, i.e. similar results to our data [30]. In our opinion, several factors might have contributed to decreased concentrations of MMPs in our patients with diabetes. These factors might include effects of medications commonly used by subjects with type 2 diabetes, such as statins, ACE inhibitors/AT-II blockers, calcium channel blockers and acetylsalicylic acid. Statins and fibrates are the most common agents used in therapy of hyperlipidaemia in diabetes. These agents exert anti-inflammatory and antioxidant effects, improve endothelial function and stabilise atherosclerotic plaque via modulation of extracellular matrix homeostasis and a decrease in concentrations and activity of metalloproteinases and their inhibitors [31], the same being largely also applicable to ACE inhibitors and AT-II blockers [32]. Calcium channel blockers reduce the secretion of MMP-9 and TIMP-1 by macrophages [33], while acetylsalicylic acid blocks the cyclooxygenase, decreases the synthesis of prostaglandins and then controls the pathological activation of MMPs [34, 35]. These effects of medication render the issue of adequate subject matching in controls vs. diabetic patients extremely difficult as according to the current standards virtually every patient with type 2 diabetes qualifies for treatment with statins, while the great majority require ACE-inhibitors/AT-II blockers as well as other agents (e.g. calcium channel blockers) for treatment of hypertension and/or renoprotection. Though not the primary subject of the study it is of interest to note that our subjects treated with insulin or sulfonylurea-metformin combinations (all of whom also received statins, ACE-inhibitors ± calcium channel blockers and aspirin) tended to have lower concentrations of MMP-2 (mean 190 ng/ml vs. 252 ng/ml) and MMP-9 (572 ng/ml vs. 990 ng/ml) than those on metformin ± acarbose, who received less medication. In our opinion the issue of quantitative effects of medications on serum MMPs has only recently begun to be investigated and warrants a separate study.
Despite these limitations our data support a possibility that prolonged hyperglycaemia might be related to increased activity of some MMPs, given the positive correlation between serum MMP-9 concentrations and HbA1c. This is also supported by a trend towards a decline in serum MMP-9 concentrations at the time of discharge from hospital (when glycaemic control was better) as well as by a significant decrease in MMP-9 at three months post-discharge, accompanied by a fall of HbA1c. This hypothesis might be supported by some animal data as in dogs chronic hyperglycaemia abolishes development of coronary collateral vessels by increasing MMP-9 activity and angiostatin expression [36].
The issue of the effects of acute hyperglycaemia upon MMPs appears to be complex. First, there seems to be differential regulation of MMPs, as there was a change of MMP-9, but not MMP-2 at 120 min of OGTT. Selective decline of MMP-9, but not MMP-2, raises a possibility of differential regulation of MMPs in response to acute changes in glycaemia. There are very few data on changes of MMPs in response to acute, i.e. short-term changes of glycaemia. Sampson et al. [30] report a fall in soluble adhesion molecules (VCAM-1, ICAM-1, E-selectin), but no change in plasma levels of MMP-3 and MMP-9 at 90 min after a 75-g oral glucose tolerance test. This differs from our data, though we note that in our subjects the decline in serum MMP-9 was significant only at 120 min, and not at 60 min of OGTT, so a longer period of hyperglycaemia might be required to observe significant changes in plasma/serum MMP-9 concentrations. Interestingly, Polhill et al. [37] demonstrated differences between the effects of short vs. longer periods of hyperglycaemia. The authors exposed human renal cortical fibroblasts to short-term (2 h) hyperglycaemia (15 mmol/l), three times a day over 72 h. There was an increase in extracellular matrix accumulation association with increased tissue inhibitor of matrix metalloproteinase that would in turn lead to decreased activity of MMPs. In contrast, sustained exposure to hyperglycaemia (15 mmol/l) resulted in increased MMP-2 and MMP-9 activities. It should be mentioned, however, that in some studies the authors employed very high glucose concentrations in order to demonstrate increased MMPs activity in blood vessels, rather than the levels typically observed in clinical practice. For instance, in the study of Death et al. [38], glucose levels were around 25 mmol/l (450 mg/dl), while such concentrations are observed only in extremely poorly controlled patients with type 2 DM on the verge of hyperosmolar non-ketotic hyperglycaemia.
Another issue that warrants discussion is the possible relationship between MMPs and insulin. Our data do not provide convincing support for a significant direct effect of either acute or chronic hyperinsulinaemia on serum MMPs. In our control group there was no correlation between serum MMP concentrations and either HOMA or IRI. Previously we had also failed to demonstrate a correlation between MMP-2 or MMP-9 and fasting insulin in women with polycystic ovary syndrome [39]. Other authors report either lack of a direct correlation between MMP-2 or MMP-9 and HOMA [40], or just a relatively weak correlation between plasma MMP-9 and fasting insulin (r2 = 0.16, p = 0.04) [41]. There is also evidence that insulin infusion might exert opposite effects to those induced by hyperglycaemia, as it exerts antioxidant and anti-inflammatory effects [42]. Insulin also improves nitric oxide production and results in improved blood circulation to ischaemic areas [42]. Hence, though an unfavourable milieu associated with metabolic syndrome might promote increased activity of MMPs, insulin per seis rather unlikely to play a crucial role in this phenomenon. There are, however, studies that demonstrated an increase in free MMP-2 and MMP-9 (zymographic method) in aortic tissue of male rats during euglycaemic-hyperinsulinaemic clamp [43], or in monocytes of hyperinsulinaemic and obese mice [44], the latter study contrasting with the lack of increase in MMP activity in monocytes in humans with type 2 DM [22].
The limitations of the study include a high drop-out rate among subjects with type 2 DM, who presented for evaluation at 3 months after discharge, older age of our patients with type 2 diabetes, and the failure to account for all possible effects of medications taken by our patients with type 2 DM on serum concentrations of MMP-2 and MMP-9. It would be, however, unethical to deprive patients with type 2 DM of their vital medications, such as statins or ACE inhibitors. We also believe that the age difference between the groups per sewas unlikely to explain the observed differences in MMP concentrations, given the lack of any correlation between age and MMPs in the control group.
In conclusion, our study demonstrated lower levels of MMP-2 and MMP-9 in subjects with type 2 diabetes, the reasons for this phenomenon being complex. Our results also suggest that MMP-9, in contrast to MMP-2, may be more prone to possibly inhibitory short-term effects of hyperglycaemia vs. possibly stimulatory long-term effects of raised glucose concentrations. Given the ample evidence for a possible role of MMPs in cardiovascular disease and diabetes, we postulate that further research on larger groups of subjects might help to elucidate the effects of hyperglycaemia and hyperinsulinaemia upon the activity of matrix metalloproteinases in humans.
Acknowledgments
This study was accepted for poster presentation at the 45th Annual Meeting of the European Association for the Study of Diabetes in Vienna, Austria (29 September – 2 October 2009).
References
- 1.Kannel WB, McGee DL. Diabetes and glucose tolerance as a risk factors for cardiovascular disease: the Framingham study. Diabetes Care. 1979;241:120–6. doi: 10.2337/diacare.2.2.120. [DOI] [PubMed] [Google Scholar]
- 2.Ruderman NB, Haudenschild C. Diabetes as an atherogenic factor. Prog Cardiovasc Dis. 1984;26:373–412. doi: 10.1016/0033-0620(84)90011-2. [DOI] [PubMed] [Google Scholar]
- 3.Barthelemy O, Jacqueminet S, Rouzet F, et al. Intensive cardiovascular risk factors therapy and prevalence of silent myocardial ischaemia in patients with type 2 diabetes. Arch Cardiovasc Dis. 2008;101:539–46. doi: 10.1016/j.acvd.2008.06.015. [DOI] [PubMed] [Google Scholar]
- 4.Adler AI. UKPDS-modelling of cardiovascular risk assessment and lifetime simulation of outcomes. Diabet Med. 2008;25:41–6. doi: 10.1111/j.1464-5491.2008.02498.x. [DOI] [PubMed] [Google Scholar]
- 5.Beaudeux JL, Giral P, Brukert E. Matrix metalloproteinases and atherosclerosis. Therapeutic aspects. Ann Biol Clin. 2003;61:147–58. [PubMed] [Google Scholar]
- 6.Shah PK. Plaque disruption and thrombosis.Potential role of inflammation and infection. Cardiol Rev. 2000;1:31–9. [PubMed] [Google Scholar]
- 7.Mun-Bryce S, Rosenberg GA. Matrix metalloproteinases in cerebrovascular disease. J Cereb Blood Flow Metab. 1998;18:1163–72. doi: 10.1097/00004647-199811000-00001. [DOI] [PubMed] [Google Scholar]
- 8.Wang W, Schulze CJ, Suarez-Pinzon WL, Dyck JR, Sawicki G, Schulz R. Intracellular action of matrix metalloproteinase-2 accounts for acute myocardial ischemia and reperfusion injury. Circulation. 2002;106:1543–9. doi: 10.1161/01.cir.0000028818.33488.7b. [DOI] [PubMed] [Google Scholar]
- 9.Creemers EE, Cleutjens JP, Smits JF, Daemen MJ. Matrix metalloproteinase inhibition after myocardial infarction: a new approach to prevent heart failure? Circ Res. 2001;89:201–10. doi: 10.1161/hh1501.094396. [DOI] [PubMed] [Google Scholar]
- 10.Galis ZS, Sukhova GK, Lark MV, Libby P. Increased expression of matrix metalloproteinases and matrix degrading activity in vulnerable regions of human atherosclerotic plaques. J Clin Invest. 1994;94:2493–503. doi: 10.1172/JCI117619. [DOI] [PMC free article] [PubMed] [Google Scholar]
- 11.Whalting C, McPheat W, Hurt-Camejo E. Matrix management assigning different role of MMP-2 and MMP-9 in vascular remodeling. Arterioscler Thomb Vasc Biol. 2004;24:10–1. doi: 10.1161/01.ATV.0000100562.63144.C1. [DOI] [PubMed] [Google Scholar]
- 12.Kai H, Ikeda H, Yasukawa H, et al. Peripheral blood levels of matrix metalloproteinase-2 and -9 are elevated in patients with acute coronary syndromes. J Am Coll Cardiol. 1998;32:368–72. doi: 10.1016/s0735-1097(98)00250-2. [DOI] [PubMed] [Google Scholar]
- 13.Planas AM, Sole S, Justicia C. Expression and activation of matrix metalloproteinase-2 and -9 in rat brain after focal cerebral ischeamia. Neurobiol Dis. 2001;8:834–46. doi: 10.1006/nbdi.2001.0435. [DOI] [PubMed] [Google Scholar]
- 14.Montaner J, Alvarez-Sabin J, Molina CA, et al. Matrix metalloproteinase expression is related to haemorrhagic transformation after cardioembolic stroke. Stroke. 2001;32:2762–7. doi: 10.1161/hs1201.99512. [DOI] [PubMed] [Google Scholar]
- 15.Portik-Dobos V, Anstadt MP, Hutchinson J, Bannan M, Ergul A. Evidence for a matrix metalloproteinasesinduction/activation system in arterial vasculature and decreased synthesis and activity in diabetes. Diabetes. 2002;51:3063–8. doi: 10.2337/diabetes.51.10.3063. [DOI] [PubMed] [Google Scholar]
- 16.Chung AW, Hsiang YN, Matzke LA, McManus BM, van Breemen C, Okon EB. Reduced expression of vascular endothelial growth factor paralleled with the increased angiostatin expression resulting from the upregulated activities of matrix metalloproteinase-2 and -9 in human type 2 diabetic arterial vasculature. Circ Res. 2006;99:140–8. doi: 10.1161/01.RES.0000232352.90786.fa. [DOI] [PubMed] [Google Scholar]
- 17.Inada A, Nagai K, Arai H, et al. Establishment of a diabetic mouse model with progressive diabetic nephropathy. Am J Pathol. 2005;167:327–36. doi: 10.1016/s0002-9440(10)62978-1. [DOI] [PMC free article] [PubMed] [Google Scholar]
- 18.Han SY, Jee YH, Han KH, et al. An imbalance between matrix metalloproteinase-2 and tissue inhibitor of matrix metalloproteinase-2 contributes to the development of early diabetic nephropathy. Nephrol Dial Transplant. 2006;21:2406–16. doi: 10.1093/ndt/gfl238. [DOI] [PubMed] [Google Scholar]
- 19.McLennan SV, Martell SK, Yue DK. Effects of mesangium glycation on matrix metalloproteinase activities possible role in diabetic nephropathy. Diabetes. 2002;51:2612–8. doi: 10.2337/diabetes.51.8.2612. [DOI] [PubMed] [Google Scholar]
- 20.Kadoglou NP, Daskalopoulou SS, Perrea D, Liapis CD. Matrix metalloproteinases and diabetic vascular complications. Angiology. 2005;56:173–89. doi: 10.1177/000331970505600208. [DOI] [PubMed] [Google Scholar]
- 21.Wall S, Sampson MJ, Levell N, Williams T, Murphy G. Elevated matrix metalloproteinase-2 and -3 production from healthy dermal fibroblasts in human diabetes. Br J Dermatol. 2003;149:13–6. doi: 10.1046/j.1365-2133.2003.05262.x. [DOI] [PubMed] [Google Scholar]
- 22.Baugh MD, Gavrilovic J, Davies IR, Hughes DA, Sampson MJ. Monocyte matrix metalloproteinase production in type 2 diabetes and controls – a cross sectional study. Cardiovasc Diabetol. 2003;2:3. doi: 10.1186/1475-2840-2-3. [DOI] [PMC free article] [PubMed] [Google Scholar]
- 23.Matthews DR, Hosker JP, Rudenski AS, Naylor BA, Treacher DF, Turner RC. Homeostasis model assessment: insulin resistance and cell function from fasting plasma glucose and insulin concentrations in man. Diabetologia. 1985;28:412–9. doi: 10.1007/BF00280883. [DOI] [PubMed] [Google Scholar]
- 24.Belfiore F, Iannello S, Volpicelli G. Insulin sensitivity indices calculated from basal and OGTT-induced insulin, glucose, and FFA levels. Mol Genet Metab. 1998;63:134–41. doi: 10.1006/mgme.1997.2658. [DOI] [PubMed] [Google Scholar]
- 25.Matsuda M, DeFronzo R. Insulin sensitivity indices obtained from oral glucose tolerance testing. Diabetes Care. 1999;9:1462–70. doi: 10.2337/diacare.22.9.1462. [DOI] [PubMed] [Google Scholar]
- 26.Koutsovasilis A, Protopsaltis J, Triposkiadis F, et al. Comparative performance of three metabolic syndrome definitions in the prediction of acute coronary syndrome. Intern Med. 2009;48:179–87. doi: 10.2169/internalmedicine.48.1654. [DOI] [PubMed] [Google Scholar]
- 27.Signorelli SS, Malaponte G, Libra M, et al. Plasma levels and zymographic activities of matrix metalloproteinases 2 and 9 in type II diabetics with peripherial arterial disease. Vasc Med. 2005;10:1–6. doi: 10.1191/1358863x05vm582oa. [DOI] [PubMed] [Google Scholar]
- 28.Derosa G, D’Angelo A, Tinelli C, et al. Evaluation of metalloproteinase 2 and 9 levels and their inhibitors in diabetic and healthy subjects. Diabetes Metab. 2007;33:129–34. doi: 10.1016/j.diabet.2006.11.008. [DOI] [PubMed] [Google Scholar]
- 29.Papazafiropoulou A, Perrea D, Moyssakis I, Kokkinos A, Katsilambros N, Tentolouris N. Plasma levels of MMP-2, MMP-9 and TIMP-1 are not associated with arterial stiffness in subjects with type 2 diabetes mellitus. J Diabet Comp. 2008 Dec 4; doi: 10.1016/j.jdiacomp.2008.10.004. [DOI] [PubMed] [Google Scholar]
- 30.Sampson M, Davies I, Gavrilovic J, et al. Plasma matrix metalloproteinases, low density lipoprotein oxidisability and soluble adhesion molecules after a glucose load in type 2 diabetes. Cardiovasc Diabetol. 2004;3:7–14. doi: 10.1186/1475-2840-3-7. [DOI] [PMC free article] [PubMed] [Google Scholar]
- 31.Nakaya R, Uzui H, Shimizu H, et al. Pravastatin suppresses the increase in matrix metalloproteinase -2 levels after acute myocardial infarction. Int J Cardiol. 2005;105:67–73. doi: 10.1016/j.ijcard.2004.12.024. [DOI] [PubMed] [Google Scholar]
- 32.Rizzoni D, Porteri E, De Ciuceis C, et al. Effect of treatment with candesartan or enalapril on subcutaneous small artery structure in hypertensive patients with noninsulin-depentent diabetes mellitus. Hypertension. 2005;45:659–65. doi: 10.1161/01.HYP.0000153308.91043.97. [DOI] [PubMed] [Google Scholar]
- 33.Bellosta S, Canavesi M, Favari E, et al. Lacidipine modulates the secretion of matrix metalloproteinase-9 by human macrophages. J Pharmacol Exp Ther. 2001;296:736–43. [PubMed] [Google Scholar]
- 34.Sampson M, Wall S, Baugh M, et al. Monocyte matrix and ADAM metalloproteinases expression in type 2 diabetes after aspirin therapy. Diabetes Res Clin Pract. 2006;71:45–51. doi: 10.1016/j.diabres.2005.05.014. [DOI] [PubMed] [Google Scholar]
- 35.Kim MP, Zhou M, Wahl LM. Angiotensin II increases human monocyte matrix metalloproteinase-1 through the AT2 receptor and prostaglandin E2: implication for atherosclerotic plaque rupture. J Leukoc Biol. 2005;78:195–201. doi: 10.1189/jlb.1204715. [DOI] [PubMed] [Google Scholar]
- 36.Weihrauch D, Lohr NL, Mraovic B, et al. Chronic hyperglycemia attenuates coronary collateral development and impairs proliferative properties of myocardial interstitial fluid by production of angiostatin. Circulation. 2004;109:2343–8. doi: 10.1161/01.CIR.0000129225.67353.1F. [DOI] [PubMed] [Google Scholar]
- 37.Polhill TS, Saad S, Poronnik P, Fulcher GR, Pollock CA. Short-term peaks in glucose promote renal fibrogenesis independently of total glucose exposure. Am J Physiol Renal Physiol. 2004;287:F268–73. doi: 10.1152/ajprenal.00084.2004. [DOI] [PubMed] [Google Scholar]
- 38.Death AK, Fischer EJ, McGrath KC, Yue DK. High glucose alters matrix metalloproteinase expression in two key vascular cells: potential impact on atherosclerosis in diabetes. Atherosclerosis. 2003;168:263–9. doi: 10.1016/s0021-9150(03)00140-0. [DOI] [PubMed] [Google Scholar]
- 39.Lewandowski KC, Komorowski J, O’Callaghan CJ, et al. Increased circulating levels of matrix metalloproteinase -2 and 9- in women with the polycystic ovary syndrome. J Clin Endocrinol Metab. 2006;91:1173–7. doi: 10.1210/jc.2005-0648. [DOI] [PubMed] [Google Scholar]
- 40.Derosa G, Ferrari I, D’Angelo A, et al. Matrix metalloproteinase-2 and -9 levels in obese patients. Endothelium. 2008;15:219–24. doi: 10.1080/10623320802228815. [DOI] [PubMed] [Google Scholar]
- 41.Glowinska-Olszewska B, Urban M. Elevated matrix metalloproteinase 9 and tissue inhibitor of metalloproteinase 1 in obese children and adolescents. Metabolism. 2007;56:799–805. doi: 10.1016/j.metabol.2007.01.011. [DOI] [PubMed] [Google Scholar]
- 42.Garg R, Chaudhuri A, Munschauer F, Dandona P. Hyperglycemia, insulin, and acute ischemic stroke: a mechanistic justification for a trial of insulin infusion therapy. Stroke. 2006;37:267–73. doi: 10.1161/01.STR.0000195175.29487.30. [DOI] [PubMed] [Google Scholar]
- 43.Boden G, Song WW. Effects of insulin and free fatty acids on matrix metalloproteinases. Curr Diabet Rep. 2008;8:239–42. doi: 10.1007/s11892-008-0041-y. [DOI] [PubMed] [Google Scholar]
- 44.Kappert K, Meyborg H, Clemenz M, et al. Insulin facilitates monocyte migration: a possible link to tissue inflammation in insulin-resistance. Biochem Biophys Res Commun. 2008;365:503–8. doi: 10.1016/j.bbrc.2007.11.006. [DOI] [PubMed] [Google Scholar]


