Abstract
Ca2+ concentration in peroxisomal matrix ([Ca2+]perox) has been monitored dynamically in mammalian cells expressing variants of Ca2+-sensitive aequorin specifically targeted to peroxisomes. Upon stimulation with agonists that induce Ca2+ release from intracellular stores, peroxisomes transiently take up Ca2+ reaching peak values in the lumen as high as 50–100 μm, depending on cell types. Also in resting cells, peroxisomes sustain a Ca2+ gradient, [Ca2+]perox being ∼20-fold higher than [Ca2+] in the cytosol ([Ca2+]cyt). The properties of Ca2+ traffic across the peroxisomal membrane are different from those reported for other subcellular organelles. The sensitivity of peroxisomal Ca2+ uptake to agents dissipating H+ and Na+ gradients unravels the existence of a complex bioenergetic framework including V-ATPase, Ca2+/H+, and Ca2+/Na+ activities whose components are yet to be identified at a molecular level. The different [Ca2+]perox of resting and stimulated cells suggest that Ca2+ could play an important role in the regulation of peroxisomal metabolism.
Peroxisomes are quasi-ubiquitous organelles of eukaryotic cells that are involved in several metabolic pathways. They play an essential role in fatty acid α- and β-oxidation, in the biosynthesis of ether phospholipids and bile acids, in the catabolism of purines and polyamines and in the degradation of hydrogen peroxides, prostaglandins, glyoxylate, and l-pipecolic acid (1). Impairment of peroxisomal activities causes “peroxisomal disorders,” most of which are associated with severe neurological symptoms as in the Zellweger spectrum (1–3). Structurally, peroxisomes consist of a proteinaceous milieu limited by a single lipid bilayer originally thought to be freely permeable to small solutes. In contrast, recent reports demonstrated the existence of peroxisomal membrane transporters in both yeast and mammalian cells (4–8), thus suggesting a strictly regulated activity of peroxisomal pathways acting in concert with cytosolic metabolism. In addition, the hypothesis of peroxisomes playing a direct role in intracellular signaling was supported (9), but no information until now is available on how extracellular agonists could have regulatory effects on peroxisomal biochemical pathways via their second messengers. In this context, we investigated for the first time the properties of peroxisomes in handling Ca2+, one of the most ubiquitous cellular second messengers.
In this work we provide direct evidence that peroxisomes play a role in Ca2+ homeostasis by using the targeted recombinant aequorin approach that has been previously applied to other subcellular compartments such as mitochondria (10), nucleus (11), endoplasmic reticulum (ER)4 (12), Golgi apparatus (13), and secretory vesicles (14). We generated two novel peroxisomally targeted aequorins, peroxAEQwt and peroxAEQmut, suitable for dynamic monitoring of Ca2+ in intact cells over a wide range of concentrations. We found that a large transient Ca2+ uptake occurs in peroxisomes of cells stimulated with extracellular agonists. Furthermore, in steady state conditions, Ca2+ in peroxisomal lumen is maintained at concentrations ∼20-fold higher than in cytosol. The sensitivity of peroxisomal Ca2+ transport to a set of different ionophore reagents unravels the existence of an unexpectedly complex bioenergetic framework across the peroxisomal membrane, whereby a H+ gradient (in resting state) and H+ and Na+ gradients (in stimulated cells) sustain Ca2+ uptake into the peroxisomal lumen.
Our work provides clear evidence that peroxisomes are involved in Ca2+ homeostasis, thus adding further complexity to the intracellular network of Ca2+ signaling. The dynamic flux of Ca2+ ions across the peroxisomal membrane presented herein has unique characteristics when compared with previously investigated subcellular compartments, suggesting the existence of yet unidentified peroxisomal membrane transporting systems as well as the potential for Ca2+ to play a role in the regulation of peroxisomal metabolism.
EXPERIMENTAL PROCEDURES
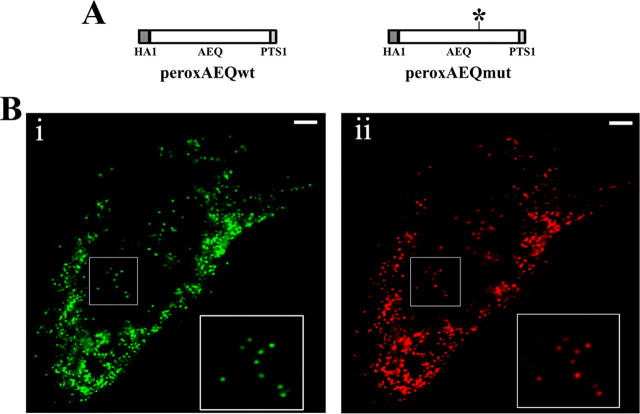
Construction of peroxAEQs and pHluorin cDNAs—Peroxisome-targeted wild-type and mutant aequorins (peroxAEQwt and peroxAEQmut) were generated by appending the PTS1 signal to their C termini. For the amplification of both aequorin variants, oligonucleotides 5′-CAT AAG CTT ATG TAT GAT GTT CCT GAT TAT-3′ and 5′-TAA GAA TTC TTA TAA TTT GGA GGG GAC AGC TCC ACC GTA-3′ were used as forward and reverse primers to insert the PTS1 sequence downstream the HindIII-EcoRI fragments encoding the HA1-tagged aequorin (15) and the HA1-tagged D119A aequorin mutant cDNAs (12). The final chimeric cDNAs were then shuttled as HindIII-EcoRI fragments into the mammalian vectors pcDNA3 (Invitrogen) (pcDNA3-peroxAEQwt and pcDNA3-peroxAEQmut; see Fig. 1A). The cDNAs encoding the cytosolic and peroxisomal variants of the ratiometric pH-sensitive pHluorin (16) were lifted from pHPR258 and pHPR282 plasmids, respectively (5), as EcoRI-SalI fragments and ligated into EcoRI-XhoI-cut pcDNA3 (pcDNA3-cyt-pHluorin and pcDNA3-peroxi-pHluorin). Escherichia coli DH5α strain was used for all plasmid amplifications and isolations. The sequences of the inserts were verified.
FIGURE 1.
Schematic map of peroxAEQwt and peroxAEQmut and subcellular localization of peroxAEQwt. A, the two peroxisomal aequorin chimeras were generated by adding the PTS1 sequence downstream from the cDNAs encoding the HA1-tagged wild-type and mutant aequorins. For the peroxAEQmut, an asterisk indicates the position of the D119A mutation of the aequorin cDNA. B, CHO cells were transiently co-transfected with pcDNA3-peroxAEQwt and peroxi-DsRed2 plasmid. Thirty-six hours after transfection, the cells were fixed and permeabilized for immunostaining. The images were acquired by fluorescence microscopy. Identical fields are presented. Panel i, green immunofluorescence of CHO cells labeled with HA.11 antibody and anti-mouse AlexaFluor 488 conjugated as secondary fluorescent antibody. Panel ii, red fluorescence of peroxisome-targeted DsRed2. Details of peroxisomal co-localization are magnified in the insets at the right corners of both panels. Bars, 10 μm.
Cell Cultures and Transfection—All cell types (passages 15 and 30) used in the present work were grown in 75-cm2 flasks in the presence of an appropriate medium (Sigma-Aldrich) supplemented with 10% fetal bovine serum. In particular, CHO cells were cultured in Ham's F-12 nutrient mixture; HeLa, HepG2, and COS-7 cells in Dulbecco's modified Eagle's medium; and HEK293 cells in Dulbecco's modified Eagle's medium/F-12 medium. Twenty-four hours before transfection, the cells were seeded onto 13-mm (for aequorin measurements), 24-mm (for immunofluorescence) or 40-mm (for pHluorin measurements) glass coverslips and allowed to attain 40–60% confluence. Transfection was carried out with 4, 8, or 12 μg of total plasmid DNA for 13-, 24-, or 40-mm coverslips, respectively, according to a standard calcium-phosphate procedure (17), and the experiments were performed 36–48 h after transfection.
Immunolocalization of the Peroxisomal HA1-tagged Recombinant Aequorins—For the immunofluorescence experiments, CHO cells were co-transfected with 4 μg of pcDNA3-peroxAEQwt or pcDNA3-peroxAEQmut and 4 μg of peroxi-DsRed2 plasmid (Clontech, Mountain View, CA) containing the coding sequence of the red fluorescent DsRed protein having a type-2 PTS signal (1) for its specific expression in the peroxisomes. Thirty-six to 48 h after transfection, the cells were fixed in the presence of formaldehyde and permeabilized with 0.1% Triton X-100, as previously described (13), and then incubated for 1 h at 37 °C in a wet chamber with a 1:250 dilution (in phosphate-buffered saline) of the HA.11 monoclonal antibody, clone 16B12 (Covance, Princeton, NJ) raised against the HA1 epitope. Immunostaining of the cells was performed with the green fluorescent AlexaFluor 488 anti-mouse secondary antibody (Molecular Probes, Eugene, OR). Wide field fluorescences were acquired through a Zeiss Axiovert 200 microscope (Zeiss, Jena, Germany) equipped with a CoolSNAP HQ CCD camera (Roper Scientific, Trenton, NJ). The images were analyzed using the Metamorph software (Universal Imaging Corporation, Downington, PA) and processed with the AutoDeblur 2D deconvolution software (AutoQuant Imaging, Inc., Watervliet, NY).
pH Measurements with Expressed pHluorins—The cells were seeded on 40-mm coverslips and transfected after 24 h with 12 μg of pcDNA3-cyt-pHluorin or pcDNA3-peroxi-pHluorin. Thirty-six to 48 h after transfection coverslips were mounted in a thermostatted Bioptechs FCS2 closed chamber (Bioptechs, Inc., Butler, PA). The cells were perfused with Krebs-Ringer modified buffer supplemented with Ca2+ (KRB/Ca2+: 125 mm NaCl, 5 mm KCl, 1 mm MgSO4, 1 mm Na2HPO4, 20 mm NaHCO3, 2 mm l-glutamine, 1 mm CaCl2, and 20 mm HEPES, pH 7.4), challenged, where indicated, with 100 μm ATP, and then perfused with KRB/Ca2+ solutions buffered at different pHs (pH 6.5–7.75) in the presence of 10 μm monensin and 1 μm FCCP to titrate the pH-sensitive fluorescence of both pHluorins. Fluorescence images were acquired, as previously described (5), through a Zeiss Axiovert 200 microscope equipped with a Photometrics Cascade 512B CCD camera (Roper Scientific) and analyzed using the Metafluor software (Universal Imaging Corporation, Downington, PA).
Aequorin Reconstitution and Luminescence Measurements—Recombinant aequorins were reconstituted by incubating transfected cells with 5 μm coelenterazine (for cytAEQwt (15), mitAEQmut (18), peroxAEQwt and peroxAEQmut), or 5 μm coelenterazine n (for erAEQmut (12)) in KRB/Ca2+, pH 7.4, in 5% CO2 atmosphere at 37 °C for 2–3 h. When a reduction of the intracellular Ca2+ content was necessary, aequorin reconstitutions were performed by incubating the cells for 1–2 h at 4 °C in KRB in the absence of Ca2+ and in the presence of 5 μm coelenterazine, 5 μm ionomycin, as a Ca2+ ionophore, and 0.6 mm EGTA. After this treatment, the cells were extensively washed with KRB supplemented with 2% bovine serum albumin and 1 mm EGTA (13). Where indicated, the cells were permeabilized with 20 μm digitonin for 1 min (19) and subsequently perfused with “intracellular buffer” supplemented with 0.1 mm EGTA (IB/EGTA: 140 mm KCl, 10 mm NaCl, 1 mm KH2PO4, 5.5 mm glucose, 2 mm MgSO4, 1 mm ATP, 2 mm succinate, 20 mm HEPES, pH 7.05) at 37 °C. The Ca2+-dependent luminescence of aequorin was measured by perfusing the cells with KRB/Ca2+ supplemented with 5.5 mm glucose and stimulating them with 100 μm ATP (CHO, HepG2, COS-7, and HEK293) or 100 μm histamine (HeLa cells). In permeabilized cells, [Ca2+] measurements were carried out perfusing the cells in IB without EGTA, i.e. ∼5 μm free Ca2+ (13), and activating with 5 μm IP3. All of the experiments were terminated by lysing the cells with 100 μm digitonin in a hypotonic Ca2+-rich solution (10 mm CaCl2 in H2O), thus discharging the remaining aequorin pool. The light signal was collected in a purpose-built luminometer and calibrated into [Ca2+] values as previously described (20). When Ca2+ sensitivity of peroxAEQs luminescence was studied, CHO cells expressing peroxAEQwt or peroxAEQmut were lysed by freezing/thawing cycles at -80 °C, and the probes were reconstituted with 5 μm coelenterazine. Lysed cells were then collected into a PerkinElmer MicroBeta Jet luminometer, and Ca2+ sensitivity of the probes was measured as previously described (12) by relating the rate of the luminescence emitted in the presence of EGTA-buffered Ca2+ solutions (L) to that emitted after complete consumption of the probes with excess of Ca2+ (Lmax).
RESULTS
Subcellular Targeting and Validation of Peroxisomal Aequorins—Peroxisomal variants of the hemagglutinin (HA1)-tagged wild-type (15) and D119A mutant (12) aequorins were generated by appending the PTS1 signal (1) to their C termini (Fig. 1A). The two different aequorin chimeras, designated as peroxAEQwt and peroxAEQmut, were expressed in mammalian cells, and their peroxisomal localization was confirmed by immunocytochemical experiments. The fluorescence of immunostained cells expressing peroxAEQwt (Fig. 1B, panel i) or peroxAEQmut (not shown) extensively overlapped with that of the co-expressed recombinant peroxisomal marker peroxi-DsRed2 (Fig. 1B, panel ii), whereas no significant overlay was imaged when cells co-expressed mitochondrial or ER fluorescent recombinant proteins (21) (not shown).
As previously reported (22), the addition of targeting motifs to the C terminus of aequorin could modify its stability as well as its Ca2+-dependent luminescence emission. Accordingly, the light emission from lysates of CHO cells expressing the peroxAEQs was measured upon reconstitution of the probes in the presence of various Ca2+-buffered solutions at neutral pH. The emitted luminescence of peroxisomal probes at free [Ca2+] ranging between 10-9 and 10-2 m (L) was related to the total luminescence emitted in the presence of saturating [Ca2+] (Lmax), and the calculated L/Lmax values were actually similar to the output of lysates of cells expressing the cytosolic wild-type (cytAEQwt) or the mitochondrial mutant aequorin (mitAEQmut) used in the same experimental conditions as already calibrated reference probes (11, 23) (data not shown). In addition, because Ca2+ sensitivity of aequorins depends on the pH of the surrounding medium, we determined the pH of the peroxisomal lumen using a peroxisomally targeted variant of the pH-sensitive protein pHluorin (16) (peroxi-pHluorin). When compared with a cytosolic pHluorin, the measured peroxisomal and cytosolic pH values showed minor differences that do not significantly affect aequorin Ca2+ sensitivity (CHO cells, 6.92 ± 0.15, n = 25 in peroxisomes versus 7.08 ± 0.11, n = 25 in cytosol; HeLa cells, 7.09 ± 0.25, n = 15 in peroxisomes versus 7.23 ± 0.09, n = 15 in cytosol). In view of these data, the Ca2+ response for peroxAEQs was therefore assumed to be equivalent to that of the cytosolic and mitochondrial variants.
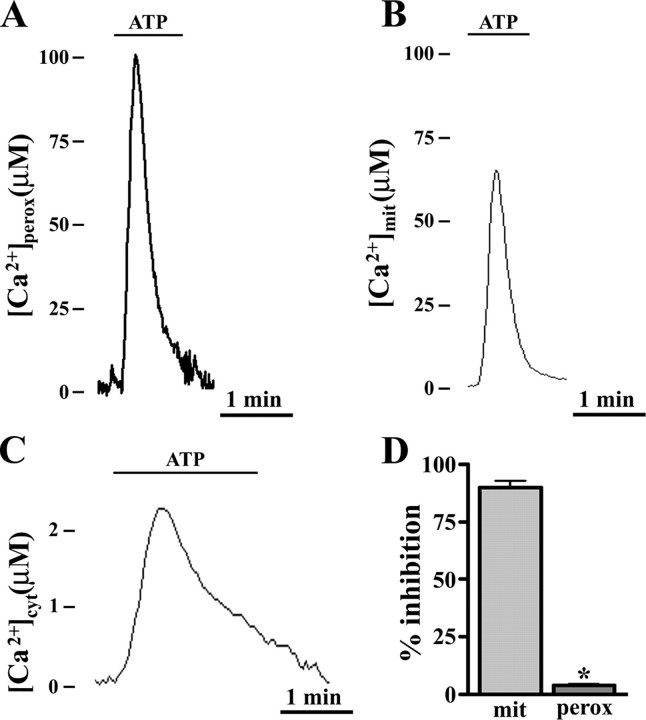
Peroxisomes Transiently Accumulate Ca2+ upon Agonist Stimulation—Evidence for a possible role of peroxisomes in cellular Ca2+ signaling was obtained when peroxAEQmut was transiently expressed in mammalian cells, and its Ca2+-dependent luminescence was measured in the presence of agonists that elicit the IP3-mediated release of Ca2+ from intracellular stores (24). Upon cell stimulation, a rapid transient Ca2+ influx occurred in peroxisomes (Fig. 2A), parallel to the [Ca2+] increases recorded in mitochondria and cytosol (Fig. 2, B and C). The kinetics of the peroxisomal [Ca2+] changes were similar to those already described for mitochondria (23). However, as shown in Table 1 for several stimulated cell lines, the measured agonist-induced peroxisomal [Ca2+] peak values ([Ca2+]perox) varied from ∼50 to ∼100 μm, and they were significantly and reproducibly higher than those measured in mitochondria and were unaffected by ruthenium red (Fig. 2D), a well known inhibitor of mitochondrial Ca2+ uptake (23). Therefore, peroxisomes transiently reach a higher [Ca2+] than mitochondria, peaking as rapidly as mitochondria although through a different molecular route.
FIGURE 2.
Ca2+ uptake occurs in peroxisomes of agonist-stimulated CHO cells to a higher extent than in mitochondria and cytosol and is not inhibited by ruthenium red. A–C, cells were seeded onto glass coverslips and transfected in parallel batches with pcDNA3-peroxAEQmut, VR1012-mitAEQmut (18), and VR1012-cytAEQwt (15). After 36 h, recombinant aequorins were reconstituted with 5 μm coelenterazine in 5% CO2 atmosphere at 37°C for 2 h in KRB/Ca2+ medium supplemented with 5.5 mm glucose. At the luminometer, the cells were perfused with the same medium and triggered with 100 μm ATP. The experiments were terminated lysing the cells with a Ca2+-rich hypotonic medium, and collection and calibration of the output luminescence were carried out, as described under “Experimental Procedures.” The data are representative of 15 experiments that yielded similar results. D, CHO cells were transfected in parallel with VR1012/mitAEQmut or pcDNA3/peroxAEQmut. After reconstitution of the recombinant probes with 5 μm coelenterazine, the cells were permeabilized by 1-min incubation with 20 μm digitonin (19) and perfused in IB buffer. Mitochondrial (mit) and peroxisomal (perox) Ca2+ uptakes were measured upon the addition of 5 μm IP3 in the presence or absence of 4 μm ruthenium red. Aequorin luminescence was calibrated and measured into [Ca2+] values, and the presented data ± S.E. (error bars) from four replicates express the inhibition percentages of Ca2+ uptake as compared with control cells (*, p < 0.001, one-way analysis of variance followed by Bonferroni's t test).
TABLE 1.
Agonist-induced [Ca2+] peak values measured in cytosol, mitochondria, and peroxisomes of different cell lines All of the indicated cells were transfected in parallel with VR1012/cytAEQwt, VR1012/mitAEQmut, and pcDNA3/peroxAEQmut plasmids, which respectively encode cytosolic, mitochondrial, and peroxisomal aequorin chimeras. The recombinant probes were reconstituted after 36 h with 5 μm coelenterazine in 5% CO2 atmosphere at 37 °C for 2 h in KRB/Ca2+ medium plus 5.5 mm glucose. At the luminometer, the cells were perfused in the same medium and stimulated with 100 μm ATP, except the HeLa cells, which were triggered with 100 μm histamine. The data represent the maximum of [Ca2+] peaks measured upon agonist stimulation.
| Cells | [Ca2+]cyt | [Ca2+]mit | [Ca2+]perox |
|---|---|---|---|
| mm | mm | mm | |
| HeLa | 1.2 ± 0.2 (n = 15) | 42 ± 6 (n = 15) | 69 ± 7 (n = 15) |
| CHO | 2.2 ± 0.3 (n = 15) | 63 ± 6 (n = 15) | 107 ± 9 (n = 15) |
| HEK293 | 0.8 ± 0.2 (n = 15) | 39 ± 4 (n = 15) | 58 ± 8 (n = 15) |
| COS-7 | 0.9 ± 0.2 (n = 15) | 26 ± 7 (n = 15) | 55 ± 5 (n = 15) |
| HepG2 | 0.9 ± 0.3 (n = 15) | 34 ± 4 (n = 15) | 51 ± 4 (n = 15) |
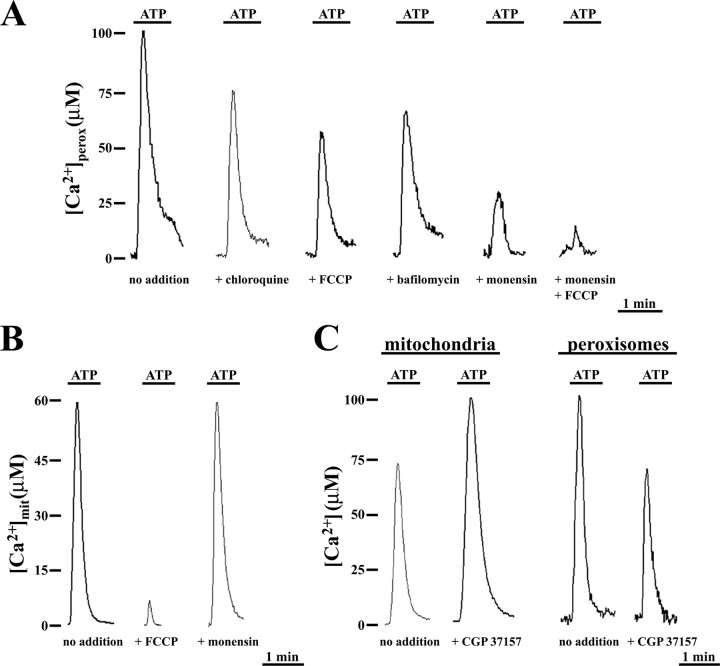
Peroxisomal Ca2+ Uptake in Stimulated CHO Cells—To investigate the mechanism leading to the large agonist-evoked [Ca2+]perox increase, we tested the effect of reagents dissipating pH gradients across biological membranes (Fig. 3). In ATP-challenged CHO cells expressing peroxAEQmut, the clear reduction of [Ca2+]perox peaks induced by chloroquine or the mitochondrial uncoupler FCCP (untreated, 98 ± 10 μm, n = 15; chloroquine-treated, 78 ± 6 μm, n = 10; FCCP-treated, 58 ± 5 μm, n = 10; Fig. 3A) suggested that a H+ gradient may exist across the peroxisomal membrane. Therefore, because biological membrane H+ gradients can be accomplished by a H+-ATPase activity, we monitored the agonist-evoked [Ca2+]perox peaks in the presence of oligomycin or bafilomycin, as inhibitors of the F-type and V-type ATPases (25–27), respectively (Fig. 3A). Oligomycin did not influence the peroxisomal Ca2+ uptake (not shown), whereas bafilomycin produced a ∼30% reduction of [Ca2+]perox peaks, as compared with controls (nontreated, 101 ± 9 μm, n = 15; oligomycin-treated, 107 ± 12 μm, n = 9; bafilomycin-treated, 62 ± 8 μm, n = 15) (Fig. 3A), suggesting the presence of a peroxisomal vacuolar(V)-type ATPase activity in CHO cells.
FIGURE 3.
Peroxisomal and mitochondrial agonist-evoked Ca2+ uptake have different sensitivities to H+ gradient collapsing reagents and to benzothiazepine CGP37157. A, CHO cells expressing peroxAEQmut were perfused in KRB/Ca2+ in the presence or absence of 40 μm chloroquine, 2 μm FCCP, 10 μm monensin, or 10 μm monensin plus 2 μm FCCP and stimulated with 100 μm ATP. In the case of bafilomycin, the cells were preincubated with 300 nm bafilomycin in KRB for 15 min at 37 °C before perfusion with KRB/Ca2+ and subsequent stimulation. B, CHO cells expressing mitAEQmut were perfused in KRB/Ca2+ in the presence or absence of 2 μm FCCP or 10 μm monensin and stimulated with 100 μm ATP. C, CHO cells expressing mitAEQmut or peroxAEQmut were perfused in KRB/Ca2+ and stimulated with 100 μm ATP in the absence or presence of 20 μm CGP37157. The data are representative of at least 15 separate experiments that yielded similar results. Treatment with each of these reagents did not affect the integrity or the morphology of the organelles, as confirmed by fluorescence microscopy in cells expressing the peroxi-DsRed2 or the mitBFP (21) used as fluorescent markers for peroxisomes and mitochondria, respectively (not shown).
A stronger decrease of [Ca2+]perox peaks was observed in agonist-stimulated cells treated with the Na+/H+ ionophore monensin (control, 98 ± 10 μm, n = 15; monensin-treated, 26 ± 5 μm, n = 15) (Fig. 3A), and importantly, the combination of monensin with FCCP almost completely abolished the [Ca2+]perox peaks (monensin + FCCP-treated, 8 ± 3 μm, n = 15) (Fig. 3A). The rapid peroxisomal Ca2+ uptake in ATP-stimulated CHO cells could therefore be led by gradients of both H+ and Na+ ions. It should be noted that FCCP, but not monensin, reduced mitochondrial Ca2+ uptake (Fig. 3B); however, its inhibitory effect was significantly more pronounced in mitochondria than in peroxisomes ([Ca2+]mit, control, 64 ± 9 μm, n = 15; FCCP-treated 4.5 ± 3 μm, n = 15; monensin-treated, 68 ± 8 μm, n = 15). Furthermore, both reagents did not affect the agonist-challenged [Ca2+]cyt changes (not shown). The involvement of Na+ and nonspecifically of a Na+/Ca2+ exchanger in agonist-evoked peroxisomal Ca2+ uptake was confirmed by using the benzothiazepine CGP37157 (28). As shown in Fig. 3C, in the presence of CGP37157, mitochondrial Ca2+ uptake was enhanced ([Ca2+]mit, untreated, 64 ± 9 μm, n = 15; CGP37157-treated, 98 ± 7 μm, n = 15), whereas it diminished in peroxisomes ([Ca2+]perox, untreated, 102 ± 6 μm, n = 10; CGP37157-treated, 70 ± 8 μm, n = 10) and remained unaltered in cytosol ([Ca2+]cyt, untreated, 2.1 ± 0.3 μm, n = 15; CGP37157-treated, 2.0 ± 0.4 μm, n = 15; not shown). The increase in mitochondrial Ca2+ uptake by CGP37157 is accounted for by its inhibitory effect on the mitochondrial Ca2+/Na+ exchanger that exports Ca2+ from the mitochondrial matrix to the cytosol (28). On the other hand, in the peroxisomal membrane a Ca2+/Na+ exchanger inhibited by CGP37157 and responsible in part for the agonist-evoked peroxisomal Ca2+ uptake might be present. Overall, the above-reported results indicate that two components, represented by the Ca2+/H+ and Ca2+/Na+ exchangers, are involved in peroxisomal agonist-evoked Ca2+ uptake.
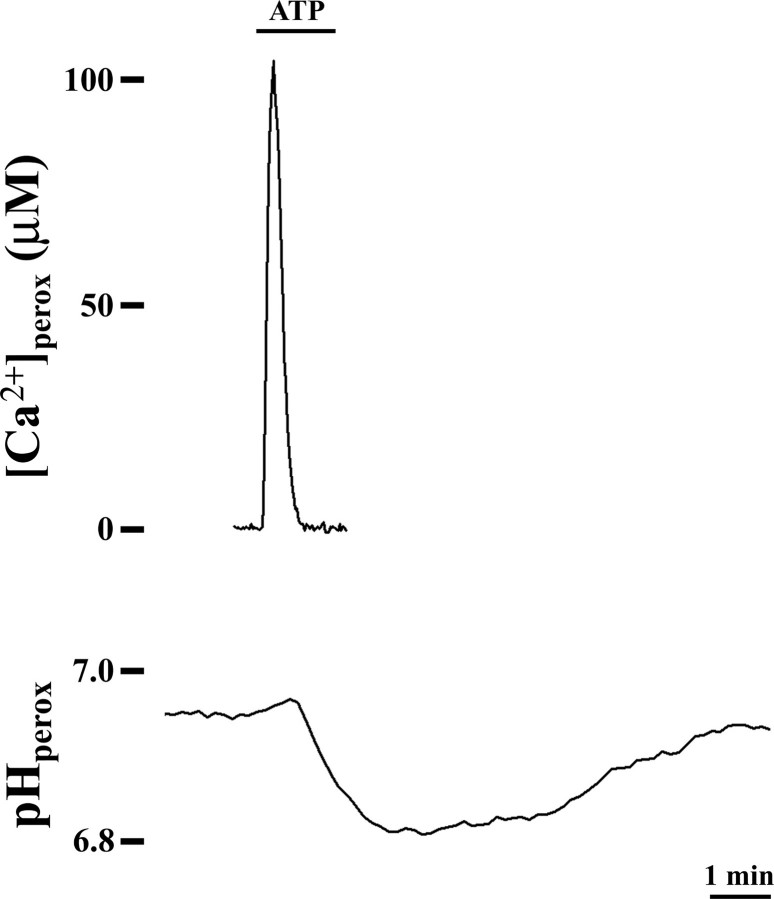
Peroxisomal pH Changes upon Addition of Ca2+-mobilizing Agonists—Given the effect of the reagents dissipating membrane H+ gradients on the agonist-induced [Ca2+]perox changes, we monitored the peroxisomal pH in ATP-stimulated CHO cells expressing the ratiometric pH-sensitive probe pHluorin. As shown in Fig. 4, upon cell stimulation peroxisomal Ca2+ influx occurs contemporary with a bland alkalinization of peroxisomal pH soon followed by a more marked and protracted transient acidification mainly associated to the subsequent Ca2+ efflux. According to these data, if the Ca2+ influx may take part along with a hardly monitorable H+ efflux, the subsequent peroxisomal acidification of the lumen suggests that Ca2+ re-extrusion occurs, directly or indirectly, in exchange with H+. Such a prolonged compensatory response of the organelle in part recalls what happens in mitochondria where transitory alkalinization of the mitochondrial matrix occurs when Ca2+-mobilizing agents are added (29).
FIGURE 4.
The peroxisomal pH changes when cells are stimulated by Ca2+-mobilizing extracellular agonists. CHO cells expressing peroxAEQmut (upper trace) or peroxi-pHluorin (lower trace) were perfused at 37 °C in KRB/Ca2+ medium plus 5.5 mm glucose and challenged, where indicated, with 100 μm ATP. pHluorin ratiometric fluorescence values obtained at 405/485-nm excitation were imaged as described under “Experimental Procedures”; the corresponding pH values were calculated by perfusing the cells at the end of the experiment with pH-buffered solutions supplemented with 1 μm FCCP plus 10 μm monensin. The data are representative of at least 10 separate parallel experiments that yielded similar results.
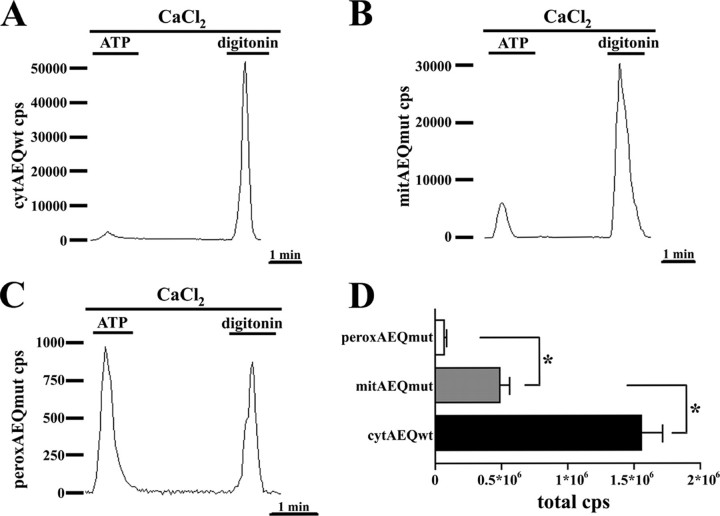
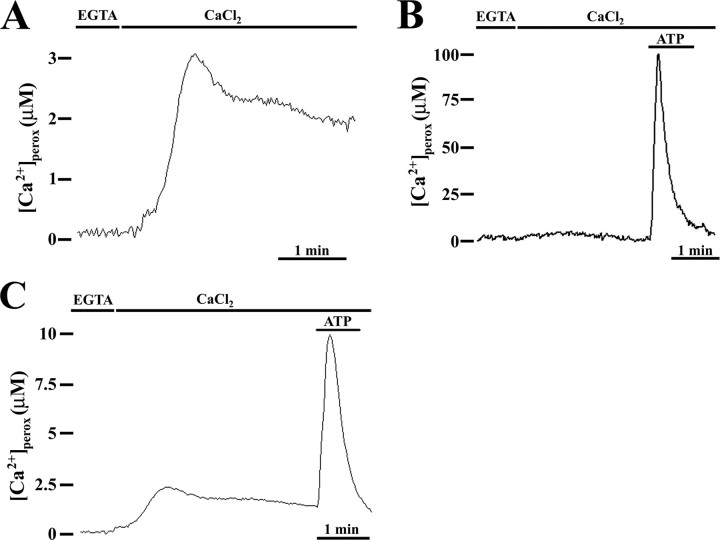
Peroxisomal Ca2+ Content in Resting Conditions—The experiments performed using peroxAEQmut revealed a low number of total luminescence counts as compared with those recorded with cytAEQwt or mitAEQmut (Fig. 5). The possibility that peroxisomes concentrate Ca2+ in their lumen during resting conditions, consuming the peroxisomally reconstituted aequorin (13), was tested in CHO cells expressing the probe peroxAEQwt, endowed with higher Ca2+ affinity (30) and reconstituted after depleting the intracellular organelles of calcium (13) (Fig. 6). At the luminometer, when Ca2+-depleted cells were refilled with Ca2+, after a lag of ∼30 s, [Ca2+]perox increased up to ∼3 μm, and then the signal decreased and after 1 min virtually leveled off for several minutes (Fig. 6A). By contrast, when the same experiment was performed using peroxAEQmut, the [Ca2+] changes were not detectable (Fig. 6B) because of the lower sensitivity of the probe. Therefore, in the absence of Ca2+-releasing agonists, peroxisomes are able to accumulate [Ca2+] 20–30-fold higher than in cytosol (15). By completing the experiments, the addition of ATP after Ca2+ refilling induced [Ca2+]perox peaks entirely similar to those obtained in cells that had not been treated with EGTA and ionomycin, when expressing both peroxAEQmut and peroxAEQwt (Fig. 6, B and C), demonstrating the functional integrity of the organelles after Ca2+ depletion treatment.
FIGURE 5.
Cells expressing peroxAEQmut output very low luminescence signals compared with cells expressing cytAEQwt or mitAEQmut. CHO cells expressing cytAEQwt (A), mitAEQmut (B), or peroxAEQmut (C) were reconstituted with 5 μm coelenterazine in KRB/Ca2+ medium supplemented with 5.5 mm glucose. At the luminometer, the cells were perfused with the same buffer, challenged with 100 μm ATP, and lysed in the presence of 0.1 mm digitonin and 10 mm CaCl2. The traces are representative of 15 experiments showing similar results. D, total luminescence counts from cells expressing cytAEQwt, mitAEQmut, or peroxAEQmut were collected from 15 parallel experiments having similar background count rate and duration. The significance of the differences among the luminescences of the three aequorin probes is indicated (*, p < 0.001, one-way analysis of variance followed by Bonferroni's t test).
FIGURE 6.
Peroxisomes accumulate Ca2+ during the resting state. CHO cells expressing peroxAEQwt (A and C) or peroxAEQmut (B) were depleted of Ca2+ by incubation with 5 μm ionomycin in KRB supplemented with 0.6 mm EGTA. Then aequorins were reconstituted in the same medium with 5 μm coelenterazine for 1–2 h at 4 °C. At the luminometer, after extensive washing with KRB in the presence of 2% bovine serum albumin and 1 mm EGTA, the cells were initially perfused with KRB supplemented with 0.1 mm EGTA and then with KRB/Ca2+. Where shown, after Ca2+ refilling, the cells were challenged with 100 μm ATP. The data are representative of at least 15 separate experiments, which yielded the same results. In these experiments, the EGTA plus ionomycin treatment, at 4 °C as well as at 37 °C, did not induce visible alterations in the shape or in the number of peroxisomes in comparison with nontreated cells, as demonstrated in fluorescence microscopy by imaging living CHO cells expressing peroxi-DsRed2 as a fluorescent peroxisomal marker (data not shown).
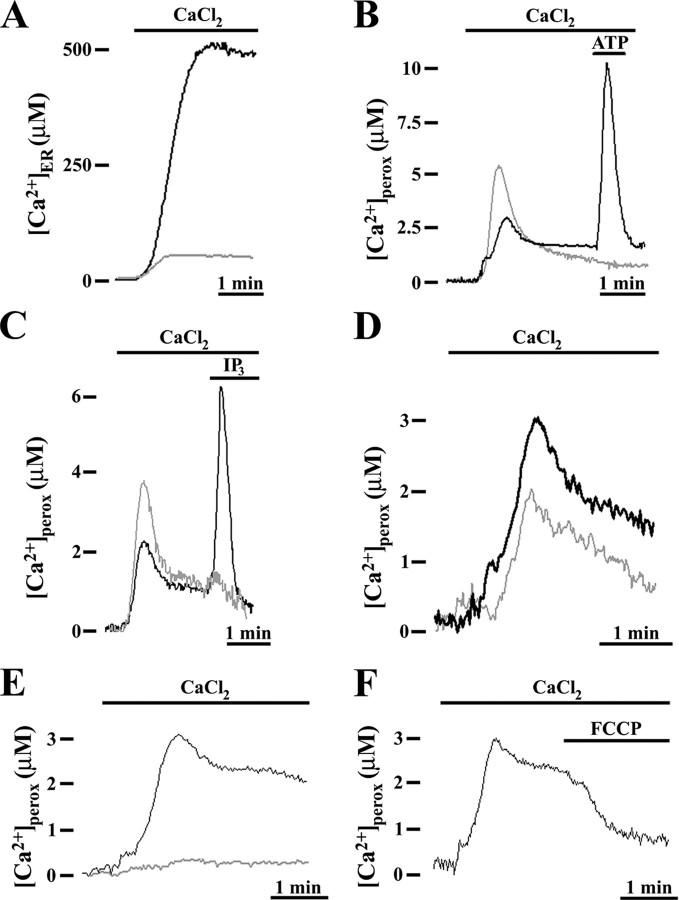
Pathways of Peroxisomal Ca2+ Accumulation in Resting Conditions—Ca2+ accumulation in peroxisomes in resting was first investigated using thapsigargin and tBuBHQ (31, 32), specific inhibitors of sarco/endoplasmic Ca2+-ATPase that actively pump Ca2+ from the cytosol to the ER lumen (33). When Ca2+ was added back to Ca2+-depleted cells that had been preincubated with both thapsigargin (Fig. 7A) or tBuBHQ (not shown), Ca2+ uptake into the ER was strongly reduced. By contrast, under the same experimental conditions, Ca2+ entry into peroxisomes was markedly increased (Fig. 7B), a likely finding because of the enhanced [Ca2+]cyt recorded in parallel (not shown) and already previously reported (13). Similar results were also obtained when digitonin-permeabilized Ca2+-depleted cells were Ca2+ refilled in the presence of orthovanadate, a wide spectrum inhibitor of P-type Ca2+-ATPase (Fig. 7C), thus excluding a role of Ca2+-ATPase in resting peroxisomal Ca2+ homeostasis. Furthermore, the addition of ATP to thapsigargin-treated cells (Fig. 7B) or IP3 to orthovanadate-treated cells (Fig. 7C) did not induce any further peroxisomal Ca2+ uptake in contrast with what was observed in nontreated cells. This result is clearly due to ER Ca2+ depletion and confirms the relationship between peroxisomes and the agonist-evoked Ca2+ release from intracellular stores.
FIGURE 7.
Resting peroxisomal Ca2+ accumulation is not affected by P-type ATPase inhibitors and is related to a H+ gradient across the peroxisomal membrane. CHO cells expressing endoplasmic reticulum aequorin (erAEQmut) (A) or peroxAEQwt (B–F) were Ca2+-depleted as described in the legend to Fig. 6 and aequorins reconstituted with 5 μm coelenterazine (peroxAEQwt) or coelenterazine n (erAEQmut) for 1–2 h at 4 °C. A and B, in the luminometer chamber, the cells were perfused with KRB supplemented with 1 mm EGTA, and Ca2+ uptake into the cells was initiated by replacing EGTA with 1 mm CaCl2, as indicated. The cells were incubated with (gray traces) and without (black traces) 1 μm thapsigargin during the final 10 min of the reconstitution. C, cells were permeabilized with 20 μm digitonin, i.e. a concentration that preserves the integrity of the peroxisomes and of the other subcellular organelles (19) and perfused in IB/EGTA medium. Ca2+ uptake was triggered by omitting EGTA (with ∼5 μm Ca2+) in the presence (gray trace) or absence (black trace) of 100 μm orthovanadate. Where indicated 100 μm ATP (B) or 5 μm IP3 (C) were added to challenge the IP3-mediated peroxisomal Ca2+ uptake. D, cells were incubated with (gray trace) or without (black trace) 300 nm bafilomycin in KRB supplemented with 1 mm EGTA for 15 min at 37 °C before replacing EGTA with 1 mm CaCl2. E and F, after Ca2+ depletion and aequorin reconstitution, CHO cells were initially perfused with KRB supplemented with 1 mm EGTA and then with KRB/Ca2+ in the presence of 2 μm FCCP. All of the presented traces are representative of at least 15 separate experiments that yielded the same results.
Interestingly, when Ca2+-depleted CHO cells were incubated with bafilomycin concentrations inhibiting the V-type ATPases, but not the P-type ATPases (34), a clear decrease of peroxisomal Ca2+ refilling was observed (Fig. 7D). This finding further supports the suggestion that a putative peroxisomal V-type ATPase activity occurs in CHO cells. Consequently, we tested the effect of FCCP with the result that peroxisomal Ca2+ refilling was virtually abolished (Fig. 7E). Moreover, FCCP caused a release of Ca2+ from peroxisomes that had been reloaded with Ca2+ (Fig. 7F). Therefore, during resting a H+ gradient is not only required for peroxisomal Ca2+ uptake but also to maintain the existing Ca2+ concentration gradient between peroxisomes and cytosol.
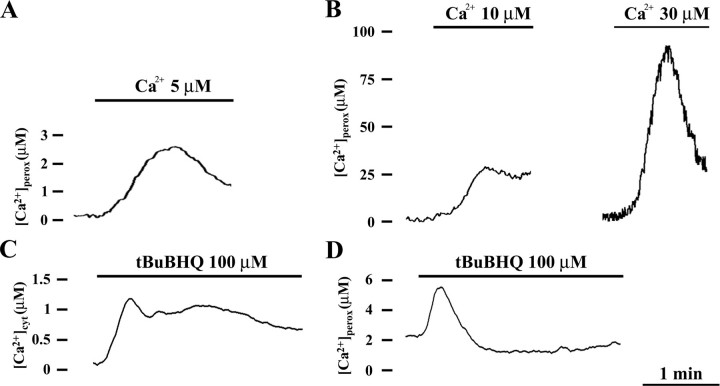
Ca2+ Sensitivity of Peroxisomes—The two different kinetics of peroxisomal Ca2+ uptake respectively shown in resting and in agonist-stimulated CHO cells may unravel a different sensitivity of these organelles when [Ca2+]cyt changes. The response of peroxisomes to different buffered [Ca2+] was firstly studied in permeabilized CHO cells. As presented in Fig. 8 (A and B), the perfusion with 5 μm and 10 μm Ca2+ induced an increase of [Ca2+]perox according to a kinetic comparable with that monitored during Ca2+ refilling in intact cell (Fig. 6) ([Ca2+]perox, perfused with 5 μm Ca2+, 2.4 ± 0.4 μm, n = 8; perfused with 10 μm Ca2+, 28 ± 3 μm, n = 8). Instead, perfusion with higher [Ca2+], i.e. ≥30 μm (Fig. 8B), generated [Ca2+]perox increases that recall the agonist-induced peroxisomal Ca2+ peaks (Fig. 2) ([Ca2+]perox, perfused with 30 μm Ca2+, 92 ± 8 μm, n = 8). These results suggest that a basal peroxisomal Ca2+ transport is activated in the presence of low [Ca2+]cyt (resting cells), whereas a different transport system is triggered when high [Ca2+]cyt occurs (stimulated cells). Indeed, when intact CHO cells after Ca2+ refilling were treated with tBuBHQ (Fig. 8, C and D) that promotes a slow release of Ca2+ from the ER and a small increase of the [Ca2+]cyt, it did not produce any increase in mitochondrial Ca2+ (not shown) as already described (23), whereas in peroxisomes it only minimally enhanced the Ca2+ content, thus confirming that the agonist-induced peroxisomal Ca2+ uptake is mainly related to the higher InsP3-mediated [Ca2+]cyt microdomains.
FIGURE 8.
Ca2+ sensitivity of CHO peroxisomes. Upper panel, CHO cells expressing peroxAEQwt (A) or peroxAEQmut (B) were permeabilized with digitonin as described in the legend to Fig. 7. Ca2+ uptake was triggered by perfusing the cells with IB in the presence of EGTA-buffered solutions of CaCl2 at the indicated concentrations. Lower panel, CHO cells expressing cytAEQwt (C) or peroxAEQwt (D) were Ca2+-depleted by treatment with oligomycin, and after Ca2+ refilling with KRB/Ca2+ were treated with 100 μm tBuBHQ diluted in the same medium. No [Ca2+]perox peaks were detected in CHO cells expressing peroxAEQmut in the same experimental conditions (not shown). All of the presented traces are representative of at least nine separate experiments that yielded similar results.
DISCUSSION
The relatively new concept of a selective metabolic communication between cytosol and peroxisomes raises questions concerning whether and how peroxisomes are involved in cellular signaling pathways. In the present work, we focused on the possibility that peroxisomes take part in the intracellular homeostasis of Ca2+, a versatile second messenger that is able to decode a great variety of extracellular stimuli into the simultaneous control of different biochemical pathways occurring in various subcellular compartments. To the best of our knowledge, no information about the involvement of peroxisomes in Ca2+ signaling has hitherto been reported.
With the aim of investigating the Ca2+ concentration in peroxisomes, we efficiently targeted to the peroxisomal lumen recombinant aequorins. Our recordings provide the evidence that peroxisomal Ca2+ handling is substantially different from those already reported for other subcellular organelles (33). In particular, mammalian peroxisomes stably maintain Ca2+ in their lumen during resting up to concentrations ∼20-fold higher than in cytosol (∼2 versus ∼0.1 μm), whereas with challenging the cells with Ca2+-releasing agonists, a more conspicuous although transient peroxisomal Ca2+ uptake (up to ∼100 μm) is induced. Also, the agonist-induced [Ca2+]perox peaks are characterized by a rapid entry and a subsequent slower efflux of the ion, compatible in shape but not in amplitude to those monitored in mitochondria (10) with a different sensitivity to pharmacological treatments. According to these data, peroxisomes, which represent only a very low percentage of the cell volume (35), are unlikely candidates to be effective stores of intracellular calcium (36), and the relatively low intraperoxisomal Ca2+ concentration during resting could reflect the presence of a driving force across the peroxisomal membrane. This hypothesis was pointed out when a complete suppression and ∼50% inhibition of peroxisomal Ca2+ uptakes during resting and agonist stimulation, respectively, were produced in the presence of FCCP that dissipates pH gradients across biological membranes. This suggested the existence of a H+ gradient across the peroxisomal membrane and, in bioenergetic terms, made peroxisomes similar to mitochondria where Ca2+ movements across their membrane depend strictly on the large H+ electrochemical gradient and FCCP is one of the best described inhibitors (23). More specifically, in peroxisomes FCCP generated an immediate inhibitory effect on the slower and more contained Ca2+ uptake during resting. By contrast, upon cell stimulation when a much larger and faster Ca2+ accumulation takes place, the partial FCCP effect could only be monitored after a short (∼10 s) preincubation,5 which is different from what happens in mitochondria where an almost complete inhibition of Ca2+ uptake occurs. These observations denoted that in resting but not during cell stimulation, a H+ gradient is by itself sufficient to sustain the peroxisomal Ca2+ uptake, thus representing the only determinant for the resting Ca2+ accumulation.
On the basis of the differences of [Ca2+] recorded between cytosol and peroxisomal lumen, the driving force required for the peroxisomal Ca2+ entry would be of ∼30 and ∼50 mV in resting and stimulated cells, respectively, according to the Nernst equation. Actually, in resting cells, by monitoring pHluorin ratiometric fluorescence, we measured a non-significant ΔpH between cytosol and peroxisomes of ∼0.2, corresponding to a ΔμH of ∼12–15 mV that is apparently insufficient to sustain peroxisomal Ca2+ accumulation. In addition, the agonist-evoked Ca2+ influx into peroxisomes is accompanied only by a modest increase of peroxisomal pH, which would exclude a possible Ca2+/H+ exchange across the peroxisomal membrane. In reality, it should be noted that in our experimental conditions, the pH sensitivity of the probe pHluorin does not allow accurate determination of ΔpH values less than ∼0.3–0.4. Furthermore, it might be also inferred that a clear difference between cytosolic and peroxisomal pH might be only displayed in microdomains localized juxtaposed to the peroxisomal membrane (37) and that a Na+ gradient could be part of the driving force for Ca2+ accumulation (see below). Finally, pH buffering properties of the peroxisomal matrix are suggested by the reversible acidification of peroxisomal lumen following agonist stimulation (Fig. 4), in which repolarization mechanisms could be related to a different orientation of H+ ions across the peroxisomal membrane, if compared with mitochondria (29).
For the completion of the larger agonist-evoked peroxisomal Ca2+ increases, the main energetic contribution is most likely represented by a Na+ gradient. When the Na+/H+ ionophore monensin is applied to stimulated cells, the inhibitory effect on peroxisomal Ca2+ uptake is higher than with FCCP, and the Ca2+ peaks are almost completely abolished with the contemporary presence of both reagents. These data suggest that the total driving force for Ca2+ entry into peroxisomes derives from the sum of a H+ gradient, ΔμH, and, to a higher extent, a Na+ gradient, ΔμNa. The peroxisomal H+ gradient might be generated by a peroxisomal V-type H+-ATPase. In fact, the V-type H+-ATPase inhibitor bafilomycin (25) clearly inhibits peroxisomal Ca2+ uptake, both in resting and in activated cells. Although the presence of this complex in peroxisomal membrane has already been hypothesized by others (38–40), further investigation is required to validate this hypothesis. Alternatively, the observed partial inhibition of peroxisomal Ca2+ uptake by bafilomycin might be secondary to the inhibition exerted by bafilomycin on the V-ATPase of other subcellular compartments, particularly endosomes, Golgi apparatus, and vacuoles (26), because release of H+ from these compartments subsequent to bafilomycin treatment (41–43) would oppose a peroxisomal Ca2+/H+ exchange by dissipating the H+ gradient across the peroxisomal membrane.
Although the existence of ΔpH across the peroxisomal membrane still represents an unsolved question (5, 39, 44–46) and the data reported herein on the presence of a peroxisomal Na+ gradient deserve further confirmation, in view of our results, we assume that H+ and Na+ ions could be more distributed on the internal side of the peroxisomal membrane, thus allowing the uptake of Ca2+ into peroxisomes in exchange with H+ (in resting) and also with Na+ (upon cell stimulation). Accordingly, we hypothesize the existence in the peroxisomal membrane of Ca2+/H+ and Ca2+/Na+ exchangers having different Ca2+ affinities, which would transport Ca2+ against a concentration gradient into the peroxisomal lumen at the expense of the H+ and Na+ gradients, respectively. The high affinity Ca2+/H+ exchanger would mainly catalyze Ca2+ uptake in the presence of low Ca2+ concentrations in the cytosol in resting conditions, whereas the low affinity Ca2+/Na+ exchanger would catalyze the high peroxisomal Ca2+ peaks in the presence of higher cytosolic Ca2+ concentrations following Ca2+ release from intracellular stores upon cell stimulation. In support of our assumption, if in stimulated cells CGP37157, an inhibitor of the Ca2+/Na+ exchangers (28, 47), enhances Ca2+ uptake in mitochondria, in peroxisomes it inhibits Ca2+ uptake, thus clearly indicating the existence of a peroxisomal Ca2+/Na+ exchanger. Therefore, on the basis of an opposite orientation of ion gradients across the respective membranes, in peroxisomes Ca2+/H+ and Ca2+/Na+ exchangers would catalyze the entry of Ca2+ toward the lumen, whereas mitochondrial Ca2+/H+ and Ca2+/Na+ function to discharge Ca2+ from the mitochondrial matrix (23).
As to the decay of the agonist-evoked [Ca2+]perox rise, we cannot determine whether it depends on a Ca2+ buffering phenomenon within the peroxisomal lumen or on extrusion of Ca2+ mediated by an unknown transport system. However, it seems evident that peroxisomal Ca2+ homeostasis is accomplished through specific pathways requiring membrane transporters not yet identified at a molecular level. Consequently, the recent notion of a selective peroxisomal membrane with distinctive bioenergetics appears strengthened. Indeed, the [Ca2+]perox values we have measured exclude the possibility of a peroxisomal membrane being freely permeable to ions. The large amplitude of the [Ca2+]perox increase occurring when the cells are stimulated or when peroxisomes are perfused with high [Ca2+] could suggest that peroxisomes are exposed to microdomains generated upon stimulation in proximity of ER Ca2+ channels, similar to what was reported for mitochondria. Indeed, close contacts between peroxisomes and subcellular Ca2+ stores have been documented (48), leaving open the possibility that the increase in [Ca2+]perox could be heterogeneous and a subset of closely interacting peroxisomes could significantly increase the average [Ca2+]perox peaks. Knowledge of the molecular entities responsible for the Ca2+ transport across the peroxisomal membrane would elucidate whether the amplitudes of peroxisomal Ca2+ accumulations both in resting and in activated cells could be related not only to different transporters with different affinities for Ca2+, but also whether their transport properties imply uniport mechanisms, likewise in mitochondria (33), or Ca2+ exchange with counter ions, as our data strongly suggest. To date, as for mitochondrial Ca2+ transport systems (33), scarce information is available about the molecular identity of putative peroxisomal Ca2+ transporters. A secretory pathway Ca2+/Mn2+-ATPases isoform has been reported in peroxisomes (49), but our data with orthovanadate and thapsigargin rule out a role for any Ca2+-ATPase in Ca2+ accumulation in peroxisomes. Alternatively, the function of Ca2+ transporters or ion exchangers could be directly studied in vitro with peroxisomal membranes, but the difficult isolation of these organelles from cells because of their extreme fragility and low abundance could make these studies experimentally limiting.
In conclusion, we have shown that peroxisomes also take part in cellular Ca2+ homeostasis. In analyzed cells, the intervention of several different pathways is necessary for peroxisomal Ca2+ handling, thus reflecting complex bioenergetics that characterize peroxisomal membrane selectivity. Having excluded a role for peroxisomes as a subcellular Ca2+ reservoir, future studies are warranted to biochemically characterize transporters and targets of peroxisomal Ca2+ and to ascertain a regulatory role of the ion in peroxisomal function and its involvement in peroxisome-related disorders.
This work was supported by grants from Ministero dell'Università e della Ricerca, Ministero della Salute, Center of Excellence in Genomics, Apulia Region and European Community's Sixth Programme for Research Contract LSHM-CT-2004-503116, Telethon Grant GGP05284, the Italian Association for Cancer Research, local funds from the Universities of Bari and Ferrara, European Union Fondi Strutturali Obiettivo 2, the Regional Program for Industrial Research, Innovation and Technological Transfer of the Emilia Romagna Region, and the Italian Space Agency. The costs of publication of this article were defrayed in part by the payment of page charges. This article must therefore be hereby marked “advertisement” in accordance with 18 U.S.C. Section 1734 solely to indicate this fact.
Footnotes
The abbreviations used are: ER, endoplasmic reticulum; PTS, peroxisomal targeting sequence; FCCP, carbonylcyanide p-(trifuoromethoxy) phenylhydrazone; tBuBHQ, ter-butylbenzohydroquinone; HA, hemagglutinin; CHO, Chinese hamster ovary; IP3, inositol 1,4,5-trisphosphate.
F. M. Lasorsa and P. Pinton, personal observation.
References
- 1.Wanders, R. J., and Waterham, H. R. (2006) Annu. Rev. Biochem. 75 295-332 [DOI] [PubMed] [Google Scholar]
- 2.Reddy, J. K., and Mannaerts, G. P. (1994) Annu. Rev. Nutr. 14 343-370 [DOI] [PubMed] [Google Scholar]
- 3.Wanders, R. J. (2004) Am. J. Med. Genet. 126 355-375 [DOI] [PubMed] [Google Scholar]
- 4.Palmieri, L., Rottensteiner, H., Girzalsky, W., Scarcia, P., Palmieri, F., and Erdmann, R. (2001) EMBO J. 20 5049-5059 [DOI] [PMC free article] [PubMed] [Google Scholar]
- 5.Lasorsa, F. M., Scarcia, P., Erdmann, R., Palmieri, F., Rottensteiner, H., and Palmieri, L. (2004) Biochem. J. 381 581-585 [DOI] [PMC free article] [PubMed] [Google Scholar]
- 6.Rottensteiner, H., and Theodoulou, F. L. (2006) Biochim. Biophys. Acta. 1763 1527-1540 [DOI] [PubMed] [Google Scholar]
- 7.Theodoulou, F. L., Holdsworth, M., and Baker, A. (2006) FEBS Lett. 580 1139-1155 [DOI] [PubMed] [Google Scholar]
- 8.Visser, W. F., van Roermund, C. W., Ijlst, L., Waterham, H. R., and Wanders, R. J. (2007) Biochem. J. 401 365-375 [DOI] [PMC free article] [PubMed] [Google Scholar]
- 9.Titorenko, V. I., and Rachubinski, R. A. (2004) J. Cell Biol. 164 641-645 [DOI] [PMC free article] [PubMed] [Google Scholar]
- 10.Rizzuto, R., Simpson, A. W., Brini, M., and Pozzan, T. (1992) Nature 358 325-327 [DOI] [PubMed] [Google Scholar]
- 11.Brini, M., Murgia, M., Pasti, L., Picard, D., Pozzan, T., and Rizzuto, R. (1993) EMBO J. 12 4813-4819 [DOI] [PMC free article] [PubMed] [Google Scholar]
- 12.Montero, M., Brini, M., Marsault, R., Alvarez, J., Sitia, R., Pozzan, T., and Rizzuto, R. (1995) EMBO J. 14 5467-5475 [DOI] [PMC free article] [PubMed] [Google Scholar]
- 13.Pinton, P., Pozzan, T., and Rizzuto, R. (1998) EMBO J. 17 5298-5308 [DOI] [PMC free article] [PubMed] [Google Scholar]
- 14.Mitchell, K. J., Pinton, P., Varadi, A., Tacchetti, C., Ainscow, E. K., Pozzan, T., Rizzuto, R., and Rutter, G. A. (2001) J. Cell Biol. 155 41-51 [DOI] [PMC free article] [PubMed] [Google Scholar]
- 15.Brini, M., Marsault, R., Bastianutto, C., Alvarez, J., Pozzan, T., and Rizzuto, R. (1995) J. Biol. Chem. 270 9896-9903 [DOI] [PubMed] [Google Scholar]
- 16.Miesenbock, G., De Angelis, D. A., and Rothman, J. E. (1998) Nature 394 192-195 [DOI] [PubMed] [Google Scholar]
- 17.Pinton, P., Rimessi, A., Romagnoli, A., Prandini, A., and Rizzuto, R. (2007) Methods Cell Biol. 80 297-325 [DOI] [PubMed] [Google Scholar]
- 18.Lasorsa, F. M., Pinton, P., Palmieri, L., Fiermonte, G., Rizzuto, R., and Palmieri, F. (2003) J. Biol. Chem. 278 38686-38692 [DOI] [PubMed] [Google Scholar]
- 19.Aboushadi, N., and Krisans, S. K. (1998) J. Lipid Res. 39 1781-1791 [PubMed] [Google Scholar]
- 20.Chiesa, A., Rapizzi, E., Tosello, V., Pinton, P., de Virgilio, M., Fogarty, K. E., and Rizzuto, R. (2001) Biochem. J. 355 1-12 [DOI] [PMC free article] [PubMed] [Google Scholar]
- 21.Rizzuto, R., Pinton, P., Carrington, W., Fay, F. S., Fogarty, K. E., Lifshitz, L. M., Tuft, R. A., and Pozzan, T. (1998) Science 280 1763-1766 [DOI] [PubMed] [Google Scholar]
- 22.Alvarez, J., and Montero, M. (2002) Cell Calcium 32 251-260 [DOI] [PubMed] [Google Scholar]
- 23.Rizzuto, R., Bastianutto, C., Brini, M., Murgia, M., and Pozzan, T. (1994) J. Cell Biol. 126 1183-1194 [DOI] [PMC free article] [PubMed] [Google Scholar]
- 24.Berridge, M. J. (1993) Nature 361 315-325 [DOI] [PubMed] [Google Scholar]
- 25.Bowman, E. J., Siebers, A., and Altendorf, K. (1988) Proc. Natl. Acad. Sci. U. S. A. 85 7972-7976 [DOI] [PMC free article] [PubMed] [Google Scholar]
- 26.Nelson, N., and Harvey, W. R. (1999) Physiol. Rev. 79 361-385 [DOI] [PubMed] [Google Scholar]
- 27.Walker, J. E., and Dickson, V. K. (2006) Biochim. Biophys. Acta. 1757 286-296 [DOI] [PubMed] [Google Scholar]
- 28.Cox, D. A., and Matlib, M. A. (1993) J. Biol. Chem. 268 938-947 [PubMed] [Google Scholar]
- 29.Abad, M. F., Di Benedetto, G., Magalhaes, P. J., Filippin, L., and Pozzan, T. (2004) J. Biol. Chem. 279 11521-11529 [DOI] [PubMed] [Google Scholar]
- 30.Kendall, J. M., Sala-Newby, G., Ghalaut, V., Dormer, R. L., and Campbell, A. K. (1992) Biochem. Biophys. Res. Commun. 187 1091-1097 [DOI] [PubMed] [Google Scholar]
- 31.Kass, G. E., Duddy, S. K., Moore, G. A., and Orrenius, S. (1989) J. Biol. Chem. 264 15192-15198 [PubMed] [Google Scholar]
- 32.Thastrup, O., Cullen, P. J., Drobak, B. K., Hanley, M. R., and Dawson, A. P. (1990) Proc. Natl. Acad. Sci. U. S. A., 87 2466-2470 [DOI] [PMC free article] [PubMed] [Google Scholar]
- 33.Rizzuto, R., and Pozzan, T. (2006) Physiol. Rev. 86 369-408 [DOI] [PubMed] [Google Scholar]
- 34.Niikura, K., Takano, M., and Sawada, M. (2004) Br. J. Pharmacol. 142 558-566 [DOI] [PMC free article] [PubMed] [Google Scholar]
- 35.Lazarow, P. B. (1989) Curr. Opin. Cell Biol. 1 630-634 [DOI] [PubMed] [Google Scholar]
- 36.Pizzo, P., Fasolato, C., and Pozzan, T. (1997) J. Cell Biol. 136 355-366 [DOI] [PMC free article] [PubMed] [Google Scholar]
- 37.Serowy, S., Saparov, S. M., Antonenko, Y. N., Kozlovsky, W., Hagen, V., and Pohl, P. (2003) Biophys. J. 84 1031-1037 [DOI] [PMC free article] [PubMed] [Google Scholar]
- 38.Douma, A. C., Veenhuis, M., Waterham, H. R., and Harder, W. (1990) Yeast 6 45-51 [DOI] [PubMed] [Google Scholar]
- 39.Imanaka, T., Shiina, Y., Moriyama, Y., Ohkuma, S., and Takano, T. (1993) Biochem. Biophys. Res. Commun. 195 1027-1034 [DOI] [PubMed] [Google Scholar]
- 40.Jankowski, A., Kim, J. H., Collins, R. F., Daneman, R., Walton, P., and Grinstein, S. (2001) J. Biol. Chem. 276 48748-48753 [DOI] [PubMed] [Google Scholar]
- 41.Coakley, R. J., Taggart, C., McElvaney, N. G., and O'Neill, S. J. (2002) Blood 100 3383-3391 [DOI] [PubMed] [Google Scholar]
- 42.Heming, T. A., Traber, D. L., Hinder, F., and Bidani, A. (1995) J. Exp. Biol. 198 1711-1715 [DOI] [PubMed] [Google Scholar]
- 43.Llopis, J., McCaffery, J. M., Miyawaki, A., Farquhar, M. G., and Tsien, R. Y. (1998) Proc. Natl. Acad. Sci. U. S. A. 95 6803-6808 [DOI] [PMC free article] [PubMed] [Google Scholar]
- 44.Dansen, T. B., Wirtz, K. W., Wanders, R. J., and Pap, E. H. (2000) Nat. Cell Biol. 2 51-53 [DOI] [PubMed] [Google Scholar]
- 45.Nicolay, K., Veenhuis, M., Douma, A. C., and Harder, W. (1987) Arch. Microbiol. 147 37-41 [DOI] [PubMed] [Google Scholar]
- 46.van Roermund, C. W., de Jong, M., Ijlst, L., van Marle, J., Dansen, T. B., Wanders, R. J., and Waterham, H. R. (2004) J. Cell Sci. 117 4231-4237 [DOI] [PubMed] [Google Scholar]
- 47.Baron, K. T., and Thayer, S. A. (1997) Eur. J. Pharmacol. 340 295-300 [DOI] [PubMed] [Google Scholar]
- 48.Kim, P. K., Mullen, R. T., Schumann, U., and Lippincott-Schwartz, J. (2006) J. Cell Biol. 173 521-532 [DOI] [PMC free article] [PubMed] [Google Scholar]
- 49.Southall, T. D., Terhzaz, S., Cabrero, P., Chintapalli, V. R., Evans, J. M., Dow, J. A., and Davies, S. A. (2006) Physiol. Genomics 26 35-45 [DOI] [PubMed] [Google Scholar]


