

Abstract
The antithrombotic activity of low molecular weight heparins (LMWHs) is largely associated with the antithrombin (AT)-binding pentasaccharide sequence AGA*IA (GlcNNAc/NS,6S-GlcA-GlcNNS,3,6S-IdoUA2S-GlcNNS,6S). The location of the AGA*IA sequences along the LMWH chains is also expected to influence binding to AT. This study was aimed at investigating the role of the structure and molecular conformation of different disaccharide extensions on both sides of the AGA*IA sequence in modulating the affinity for AT. Four high purity octasaccharides isolated by size exclusion chromatography, high pressure liquid chromatography, and AT-affinity chromatography from the LMWH enoxaparin were selected for the study. All the four octasaccharides terminate at their nonreducing end with 4,5-unsaturated uronic acid residues (ΔU). In two octasaccharides, AGA*IA was elongated at the reducing end by units IdoUA2S-GlcNNS,6S (OCTA-1) or IdoUA-GlcNNAc,6S (OCTA-2). In the other two octasaccharides (OCTA-3 and OCTA-4), AGA*IA was elongated at the nonreducing side by units GlcNNS,6S-IdoUA and GlcNNS,6S-GlcA, respectively. Extensions increased the affinity for AT of octasaccharides with respect to pentasaccharide AGA*IA, as also confirmed by fluorescence titration. Two-dimensional NMR and docking studies clearly indicated that, although elongation of the AGA*IA sequence does not substantially modify the bound conformation of the AGA*IA segment, extensions promote additional contacts with the protein. It should be noted that, as not previously reported, the unusual GlcA residue that precedes the AGA*IA sequence in OCTA-4 induced an unexpected 1 order of magnitude increase in the affinity to AT with respect to its IdoUA-containing homolog OCTA-3. Such a residue was found to orientate its two hydroxyl groups at close distance to residues of the protein. Besides the well established ionic interactions, nonionic interactions may thus contribute to strengthen oligosaccharide-AT complexes.
Heparins and low molecular weight heparins (LMWHs)3 are the most common anticoagulant and antithrombotic drugs used in cardiovascular medicine (1). One of the primary mechanisms by which heparin species express their anticoagulant action is through binding antithrombin (AT). The specific heparin sequence involved in this binding corresponds to the pentasaccharide GlcNNAc/NS,6S-GlcA-GlcNNS,3,6S-IdoUA2S-GlcNNS,6S (AGA*IA) that, inducing a conformational change in the protein, activates AT and accelerates ∼300-600-fold the inhibition of factor Xa (2, 3). Additional glucosamine and uronic acid residues, mainly constituted by GlcNNS,6S-IdoUA2S disaccharide repeating units, are thought not to significantly interact with AT and are not strictly required to achieve AT-mediated inhibition of factor Xa (4, 5). In fact, the synthetic pentasaccharide fondaparinux, consisting of the methyl glycoside of the AGA*IA variant where the first GlcN residue is N-sulfated, is in itself an effective antithrombotic drug (3, 6). LMWHs, successfully used as antithrombotic agents, are composed of numerous heparin fragments, a consistent proportion of which (about 20% of total) contains the AT-binding sequence AGA*IA, and endowed with high affinity for AT (7). Advances in analytical and separation methods have permitted the isolation and sequencing of a number of these “active” components of LMWHs and to assess that the AGA*IA sequences are located at different sites along the oligosaccharide chains (7, 8). The increasing interest in the development of “tailored” LMWHs and very low molecular weight heparins stimulates studies aimed at a better understanding at the molecular level the mechanisms of interaction between AT and AGA*IA-containing oligosaccharides. Earlier studies on tetrasaccharides sequences adjacent to the antithrombin-binding site have demonstrated two possible variants of AT-binding sequences, suggesting a possible role of the extensions of these sequences on binding to AT (9). Longer AT-binding sequences, such as decasaccharides, were also previously isolated (8). The influence of the position of the pentasaccharide sequence along the oligosaccharide chains together with the knowledge of the role of the residues prolonging the active sequence toward both its reducing and nonreducing side are among the major goals of current heparin research (10). Although the active pentasaccharide AGA*IA is taken as paradigm for a unique heparin sequence targeting a specific protein (i.e. AT) (3), different mechanisms have been proposed for its interaction with AT in terms of position and conformation of sugar residues. The possibility of a shift along the AT D-helix for sequences longer than pentasaccharide was taken into consideration (11). Independent crystallographic and NMR studies on the structure of complexes of AT with AGA*IA and AGA*IA-containing oligosaccharides suggested that the position of the pentasaccharide in the protein binding region is unique (10, 12-15). These studies provided information on both the ring conformation of the monosaccharide residues and the geometry of the glycosidic linkages of the AT-bound pentasaccharide. In particular, it was shown that the 2-O-sulfated iduronic acid residue in the pentasaccharide, which in the free state in water solution is in equilibrium between two equienergetic conformations (1C4, and 2SO) (16), adopts the 2SO conformation when AGA*IA is bound to AT. Shifting toward this conformation, facilitated by the presence of the 2-OSO3 group, enhances the contacts between the AGA*IA and basic amino acid residues in the AT binding region (15).
In this study, four high purity octasaccharides isolated by size exclusion and AT-affinity chromatography from the LMWH enoxaparin were selected. Like all fragments generated by β-elimination cleavage of heparin chains (7, 17), all four octasaccharides terminate at the nonreducing end with 4,5-unsaturated uronic acid residues (ΔU). In two octasaccharides, AGA*IA was found to be elongated toward the reducing end by the disaccharide units IdoUA2S-GlcNNS,6S (OCTA-1) and IdoUA-GlcNNAc,6S (OCTA-2). In the other two octasaccharides (OCTA-3 and OCTA-4), AGA*IA was found to be elongated toward the nonreducing end by GlcNNS,6S-IdoUA and GlcNNS,6S-GlcA units, respectively. Earlier NMR studies on the interaction of OCTA-1 and OCTA-3 with AT suggested a possible role of both the reducing and nonreducing end extensions in favoring binding to the protein, and supported a specific binding between the pentasaccharide and the AT-binding site (10). In this work the interaction of OCTA-1 and OCTA-3 with AT was analyzed in greater detail, and the study was extended to the two novel octasaccharides (OCTA-2 and OCTA-4) described above. The structures of the four octasaccharides are shown in Fig. 1. Affinity chromatography on immobilized AT showed the following relative binding strength: OCTA-3 < OCTA-1 < OCTA-2 ≪ OCTA-4. The highest affinity of OCTA-4 was confirmed also by fluorescence titration experiments. Furthermore, when this measurement is performed in 0.5 m NaCl (i.e. at the same ion strength used for the NMR studies; see “Experimental Procedures”), OCTA-4 was shown to bind AT with 1 order of magnitude higher affinity than its homolog OCTA-3. Saturation transfer difference (STD) experiments confirmed the specificity of the AGA*IA sequence for the AT binding. The conformational and AT binding properties of these octasaccharides were also investigated by NMR (transferred-NOESY) spectroscopy and docking simulations. The structural properties of the four octasaccharides have been correlated with the affinity to AT determined by affinity chromatography on a preparation that contains about 95% of active protein as judged by active site titration (18) and interpreted in terms of both ionic and nonionic interactions.
FIGURE 1.

Structure of octasaccharides OCTA-1, OCTA-2, OCTA-3, and OCTA-4. The AGA*IA sequence is highlighted in the dashed frame. Reducing end AGA*IA extensions of OCTA-1 and OCTA-2 (I″-A″) differ in degree of sulfation being trisulfated in OCTA-1 (IdoUA2S-GlcNNS,6S, in blue) and monosulfated in OCTA-2 (IdoUA-GlcNNAc,6S, in yellow). Nonreducing end AGA*IA extensions of OCTA-3 (in blue) and OCTA-4 (in yellow) differ from each other in the structure of their uronic acid residues, which are the common iduronic acid (I′) in OCTA-3 and the unusual glucuronic acid (G′) in OCTA-4.
EXPERIMENTAL PROCEDURES
Materials—Enoxaparin and fondaparinux were supplied by Sanofi-Aventis (Vitry sur Seine, France). Antithrombin was purchased from Biogenic (Perols, France).
General Procedure for Octasaccharide Isolation, Purification, and Sequencing—Octasaccharides 1-4 (Fig. 1) were obtained by combining AT affinity chromatography and cetyltrimethylammonium-strong anion-exchange (CTA-SAX) chromatography on a semi-preparative scale, starting from octasaccharide gel permeation chromatography (GPC) fractions of enoxaparin. GPC of enoxaparin and the desalting conditions of the selected fractions were performed as described previously (19). The octasaccharide fraction was chromatographed on an AT-Sepharose column (40 × 5 cm) with a stepwise gradient of NaCl. The column was prepared by coupling human AT (1 g) to CNBr-activated Sepharose 4B (Sigma) according to Höök et al. (20). The low affinity portion was eluted from the column with a 0.25 m NaCl solution buffered at pH 7.4 with 1 mm Tris-HCl at 6 ml/min. The high affinity octasaccharide fractions were eluted with a step gradient of NaCl (range between 0.25 and 3 m
NaCl, 1 mm Tris-HCl, pH 7.4). The NaCl gradient was monitored by conductivity measurements, and the octasaccharides in the effluents were detected by UV at 232 nm. Octasaccharides eluted in affine fractions with conductivities between 30 and 85 mS/cm were gathered, desalted on Sephadex G-10, and used as starting material for the purification of OCTA-3. Octasaccharides eluted between 85 and 115 mS/cm were used for the purification of OCTA-1. Octasaccharides eluted between 115 and 150 mS/cm were gathered and used to purify OCTA-2. Fractions eluted for conductivities over 145 mS/cm were used after desalting to purify OCTA-4. The final purification of all the octasaccharides was achieved using CTA-SAX chromatography. CTA-SAX semi-preparative columns (25 × 5 cm or 25 × 2.2 cm) were prepared as described in Ref. 19 and filled with Hypersil BDS C18 (5 μm particle size). Mobile phases for oligosaccharide separation were aqueous sodium methanesulfonate (Interchim) at concentrations varying between 0 and 2.5 m. The pH was adjusted to 2.5 by addition of diluted methanesulfonic acid. Separations were achieved at 40 °C. Salt concentration in the mobile phase was increased linearly from 0 to 2.5 m over 60 min. Flow rate was 40 ml/min for 25 × 3-cm columns, and UV detection at 234 nm was used. Collected fractions were neutralized and desalted on Sephadex G-10 after a preliminary treatment on Mega Bondelut C18 cartridges (Varian). Sequencing of the octasaccharides was performed by a combination of controlled and exhaustive cleavage with heparitinases and HPLC analysis of fragments as reported previously (19).
Separation of the Octasaccharide High Affinity Fractions and Fractionation with Ion-exchange Chromatography—An octasaccharide mixture, obtained by solubilizing a mixture of about 500 μg of each crude octasaccharide, was analyzed by CTA-SAX to obtain the chromatographic T = 0 prior to the affinity experiment (data not shown). The mixture of the four octasaccharides was injected on an AT-Sepharose column (40 × 1.6 cm). The low affinity portion was eluted from the column with a 62.5 mm NaCl solution buffered at pH 7.4 with 1 mm Tris-HCl, and the high affinity octasaccharide fraction was eluted with a step gradient of NaCl (in a range between 0.21 and 3 m NaCl in 1 mm Tris-HCl, pH 7.4), with flow rate of 1 ml/min. Fractions (7 ml) were sampled and injected at 1 ml/min on a Carbopack AS11 column (25 × 0.21 cm) (Dionex) in 2.5 mm NaH2PO4, pH 2.8 buffer. Bound oligosaccharides were eluted with a linear gradient of NaClO4 (up to 0.6 m). Double UV detection was monitored at 232 nm and at 202-247 nm. The N-acetylated oligosaccharide selective signal, 202-247 nm, is the subtraction of UV signal 247 from 202 nm, as described previously (19).
Fluorescence Titration—The equilibrium dissociation constant Kd for the interaction between AT and the four octasaccharides, or fondaparinux, was assessed at 25 °C in 0.05 m HEPES containing 0.5 m NaCl, the salt concentration used in NMR experiments. Kd was obtained by monitoring the enhancement of the intrinsic fluorescence of the serpin upon its reaction with increasing concentrations of the products, a procedure often used (21-25). The same procedure was also used to determine Kd for the OCTA-4 or fondaparinux and OCTA-4:AT pairs in the presence of 0.1 and 0.25 m NaCl.
The fluorescence intensities measurements (λex = 280 nm,
λem = 340 nm) were performed using an RF5000 Shimadzu
fluorospectrophotometer equipped with a thermostated cell holder. A typical
fluorescence equilibrium titration experiment was done as follows: an aliquot
of the buffered AT stock solution was diluted to the appropriate final
concentration (0.042, 0.103, or 0.276 μm) into the reaction
buffer contained in a 1 × 1-cm path quartz cuvette (final volume = 2.5
ml), and the fluorescence intensity was read at 340 nm prior to successive
additions of small volumes (0.5-4.0 μl) of the studied oligosaccharide
solution. Before addition of AT, the apparatus was set to zero by reading
against the buffer alone. The titrant concentrations were corrected for
dilution when the cumulative volume of the aliquots was >35 μl (about
1.4% of the total volume). The best estimate of Kd was
determined by fitting the fluorescence data to the quadratic equilibrium
binding Equation 1,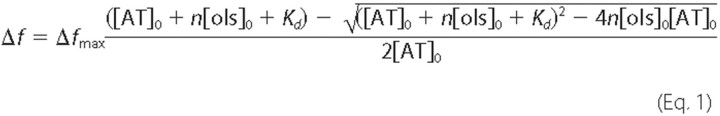
where [AT]0 and [ols]0 stand for the AT and oligosaccharide initial concentration, respectively. Δf and Δfmax are the absolute change of fluorescence intensity (f-f0) for a given oligosaccharide concentration and that of the maximum fluorescence intensity change ((f-f0)max), respectively. n is the binding stoichiometry (the ratio of the concentration of the high affinity species present in the reaction mixture versus the total concentration of the studied product). Here the value of this parameter was set to 1 because the analyzed solutions were considered to contain a single product, each molecule of which is capable of binding to one molecule of AT. Nonlinear regression analysis was done with the GraFit software (Erithacus Software).
NMR Spectra—All one- and two-dimensional NMR spectra were measured at 35 °C, at 600 MHz with a Bruker Avance 600 spectrometer equipped with a high sensitivity 5-mm TCI cryoprobe. To reduce the water humping, particularly strong in cryoprobes, 3-mm NMR tubes were used instead 5-mm tubes reducing the volume from 0.6 to 0.2 ml. For proton detection, between 150 and 250 μg of octasaccharide samples were dissolved in 2H2O (99.9%) and freeze-dried to remove residual water. After exchanging the samples three times, samples were dissolved in 0.2 ml of 10 mm phosphate buffer (0.5 m NaCl, pH 7.4) with 3 mm EDTA in 2H2O (99.996%). For the binding studies, samples were prepared by dissolving 1 mg of AT and 150-250 μg of each octasaccharide sample in the phosphate buffer so as to reach a 1:3.5 AT/octasaccharide molar ratio (10). In OCTA-1 some spectra were needed to be repeated with a smaller AT/octasaccharide ratio (1:5), to reduce the signal overlapping affecting the quantitative analysis.
Proton spectra were recorded with presaturation of the residual water signal, with a recycle delay of 12 s and 256 scans. Bidimensional double-quantum filter correlation spectroscopy (DQF-COSY) and two-dimensional TOCSY spectra were acquired using 32 scans per series of 2 K × 512 W data points with zero filling in F1 (4 K × 2 K), and a shifted (π/3) squared cosine function was applied prior to Fourier transformation. All two-dimensional nuclear Overhauser enhancement spectroscopy (NOESY) and two-dimensional transferred NOESY experiments were performed in a similar way. A total of 48 scans was collected for each free-induction decay (matrix 2048 × 512 points) and data were zero-filled to 4 K × 2 K points before Fourier transformation. Mixing time values of 100, 200, and 300 ms were used.
One-dimensional STD Experiments—Samples were prepared dissolving octasaccharides in the same buffer described previously. Between 0.4 and 0.5 mg of each sample was dissolved in a 3.4-4.2 × 10⁻⁶ mm protein solution reaching a ligand/AT ratio of 50:1. The AGA*IA/AT sample was prepared dissolving 0.5 mg of pentasaccharide in a 8.9 × 10⁻⁶ mm protein solution, maintaining the same ligand/AT ratio.
The pulse sequence used for the monodimensional STD NMR experiments includes a 30-ms spin-lock pulse to eliminate the broad resonances of the protein. A train of 40 Gaussian-shaped pulses of 50 ms each was applied to produce selective saturation. Because H5 of IdoUA residues shifts very close to water, signal solvent suppression was not included in the pulse sequence. The on-resonance irradiation was performed at the low field protein resonances (≈7.2 ppm), whereas the off-resonance control irradiation was performed at 24 ppm. The STD spectrum was obtained by phase cycling subtraction of the on-resonance and off-resonance data acquired in inter-leaved mode. The number of scans and dummy scans were 2048 and 16, respectively.
Computational Studies on Octasaccharide-AT Complexes—Flexible docking calculations of octasaccharides 1-4 onto AT were performed by AutoDock 3.0 program (26), following the procedure described for rigid docking (10). Each simulation was performed using 30 genetic algorithm runs and 3000 generations for each run. Eight torsions were allowed to move (see “Results”). Resulting ensembles of 30 conformations were then clustered using a root mean square deviation tolerance of 0.5 Å.
Theoretical tr-NOEs were computed on selected octasaccharide models by the CORCEMA program (27). All AT protons within 15 Å from ligands were included in the calculation, as possibly interacting with ligand protons.
For each octasaccharide, the experimental Kd value measured in a 0.5 m NaCl solution was used for CORCEMA simulation to compare theoretical tr-NOEs with experimental ones at the same buffer solution. koff values were then estimated to obtain the best agreement with experimental NOEs (koff OCTA-1, OCTA-2, and OCTA-3, 8 s-1; koff OCTA-4, 6 s-1).
A ligand/protein ratio of 3.5:1 was set for OCTA-2, -3, and -4, and a ratio of 5:1 was set for OCTA-1. The correlation time of AT was considered as isotropic and estimated from published data (τAT, 46 ns) (15), whereas an average correlation time value characteristic of oligosaccarides having similar structure was used for octasaccharides (τoctasaccharide, 0.9 ns) (28).
The fitting between experimental and theoretical NOEs was evaluated by
computing R factors according with the Equation
2,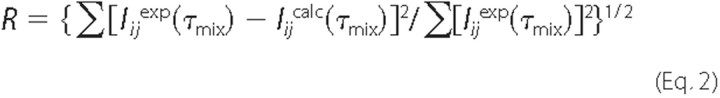
where Iijexp indicates the experimental cross-peak intensities; Iijcalc indicates the calculated cross-peak intensities, and τmix indicates the mixing times.
RESULTS
Isolation and Structural Characterization of Octasaccharides—OCTA-1 and OCTA-3 were isolated and characterized as described previously (10). OCTA-2 and OCTA-4 were similarly obtained, by combining AT affinity and CTA-SAX chromatography, starting from the octasaccharide GPC fraction of enoxaparin, as described under “Experimental Procedures.” The structures of the four octasaccharides are reported in Fig. 1. Originally, the structures of the OCTA-2 and -4 were determined by sequencing methodology involving a controlled digestion of the sample with heparitinase followed by HPLC analysis according to the procedure described by Mourier and Viskov (19) (data not shown). Briefly, OCTA-2 was sequenced in two steps. First, digestion with heparinase 1 gave a mixture of two tetrasaccharides, ΔU-GlcNNAc,6S-GlcA-GlcNNS,3,6S and ΔU2S-GlcNNS,6S-IdoUA-GlcNNAc,6S. A second exhaustive digestion, with a mixture of heparinases 1-3, yielded tetrasaccharide ΔU-GlcNNAc,6S-GlcA-GlcNNS,3,6S and the two disaccharides ΔU-GlcNNAc,6S and ΔU2S-GlcNNS,6S, generated by digestion of the tetrasaccharide ΔU2S-GlcNNS,6S-IdoUA-GlcNNAc,6S. The saccharidic order in the sequence was ascertained by the UV spectrum (characteristic of ΔU2S residues) and by the chromatographic profile of anomers, peculiar of N-acetylated reducing end (19).
Sequencing of OCTA-4 provided a HPLC pattern very similar to that of OCTA-3. However, digestion of OCTA-4 with heparinase 1 yielded hexasaccharide ΔU2S-GlcNNS,6S-GlcA-GlcNNAc,6S-GlcA-GlcNNS,3,6S and the disaccharide ΔU2S-GlcNNS,6S. In a similar experiment, ΔU2S-GlcNNS,6S-IdoUA-GlcNNAc,6S-GlcA-GlcNNS,3,6S and ΔU2S-GlcNNS,6S were obtained by digestion of OCTA-3 with heparinase 1. OCTA-3 and OCTA-4 showed different retention times in both HPLC (not shown) and AT affinity columns (Fig. 2). In addition, hexasaccharides ΔU2S-GlcNNS,6S-IdoUA-GlcNNAc,6S-GlcA-GlcNNS,3,6S and ΔU2S-GlcNNS,6S-GlcA-GlcNNAc,6S-GlcA-GlcNNS,3,6S are eluted at different retention times. After the second digestion experiment with a mixture of heparinases 1-3, OCTA-3 and OCTA-4 yielded the same fragments, i.e. tetrasaccharide ΔU-GlcNNAc,6S-GlcA-GlcNNS,3,6S and disaccharide ΔU2S-GlcNNS,6S, indicating that OCTA-3 and OCTA-4 differ in the structure of the uronic acid residue at the AGA*IA nonreducing end extension.
FIGURE 2.

AT affinity chromatography of reconstituted mixture of crude octasaccharides. SAX chromatography on Carbopack AS11 column was made at various conductivities of the step gradient to monitor the relative affinity of the octasaccharides. Eluents were detected at two different wavelengths as described under “Experimental Procedures.” Peaks of major octasaccharides (OCTA-1 to OCTA-4) are indicated.
OCTA-2 and OCTA-4 structures (Fig. 1) were confirmed by NMR spectroscopy. Both proton (Table 1) and carbon resonances (supplemental Table S1) were assigned by one-dimensional and two-dimensional NMR homonuclear and hetero-nuclear spectra (1H, DQF-COSY, TOCSY, and HSQC, data not shown). Proton and carbon chemical shifts are in full agreement with the proposed structures (Fig. 1). Expansions of proton spectra are shown in supplemental Fig. S1 and S2.
TABLE 1.
600-MHz proton chemical shifts of OCTA-2 (top) and OCTA-4 (bottom) residues
Proton spectra were measured at T = 35 °C in 10 mm phosphate buffer, pH 7.4, and 0.5 m NaCl. Standard errors, 1H ± 0.001 ppm. Three bond proton-proton coupling constants (3JHH) are indicated in parenthesis. Standard error on all couplings ±0.1 Hz. Residues bearing to AGA*IA sequence are in boldface. ND, not detectable 3JHH.
| ΔU | A | G | A* | I | A | I″ | A″ | |
|---|---|---|---|---|---|---|---|---|
| H1 | 5.194 | 5.439 | 4.633 | 5.509 | 5.228 | 5.374 | 5.038 | 5.231/4.773a |
| 3JH1-H2 | (6.0 Hz) | (3.9 Hz) | (8.1 Hz) | (3.6 Hz) | ND | ND | (<1 Hz) | |
| H2 | 3.854 | 3.976 | 3.411 | 3.482 | 4.358 | 3.292 | 3.80 | 3.950 |
| 3JH2-H3 | (9.0 Hz) | (10.6 Hz) | (10.4 Hz) | |||||
| H3 | 4.265 | 3.829 | 3.721 | 4.403 | 4.204 | 3.674 | 4.149 | 3.830 |
| H4 | 5.855 | 3.881 | 3.819 | 4.000 | 4.164 | 3.812 | 4.108 | 3.736 |
| 3JH3-H4 | (3.6 Hz) | |||||||
| H5 | 4.067 | 3.791 | 4.168 | 4.829 | 4.000 | 4.791 | 4.187 | |
| 3JH4-H5 | (3.0 Hz) | ND | ||||||
| H6a | 4.46b | 4.51b | 4.47b | 4.34b | ||||
|
H6b
|
4.21b |
4.28b |
4.26b |
4.3b |
||||
|
ΔU2S |
A′
|
G′
|
A |
G |
A* |
I |
A |
|
| H1 | 5.541 | 5.593 | 4.627 | 5.447 | 4.647 | 5.527 | 5.232 | 5.470 |
| 3JH1-H2 | (3.8 Hz) | (7.8 Hz) | (3.8 Hz) | (7.9 Hz) | (3.9 Hz) | (3.4 Hz) | ||
| H2 | 4.658 | 3.341 | 3.434 | 3.961 | 3.418 | 3.491 | 4.359 | 3.304 |
| 3JH2-H3 | (10.5 Hz) | (9.4 Hz) | (9.3 Hz) | (10.6 Hz) | (10.3 Hz) | |||
| H3 | 4.357 | 3.682 | 3.881 | 3.868 | 3.733 | 4.411 | 4.211 | 3.737 |
| H4 | 6.028 | 3.870 | 3.832 | 3.767 | 3.836 | 4.007 | 4.185 | 3.816 |
| 3JH3-H4 | (4.6 Hz) | |||||||
| H5 | 4.029 | 3.834 | 4.080 | 3.796 | 4.188 | 4.798 | 4.155 | |
| 3JH4-H5 | (3.0 Hz) | |||||||
| H6a | 4.381 | 4.484 | 4.524 | 4.456 | ||||
| H6b | 4.242 | 4.237 | 4.302 | 4.327 |
Referred to a A″ β-anomer.
The standard error is 1H ±0.01 ppm.
Relative Affinities for AT—To determine the relative affinities for AT of OCTA-1 to OCTA-4, a mixture of high affinity octasaccharides were analyzed by CTA-SAX HPLC. As illustrated in Fig. 2, OCTA-1 and -3 co-eluted in the beginning of the NaCl step gradient. However, the fraction with conductivity of 111.4 mS/cm contains only traces of OCTA-3. This fraction also contains significant amounts of OCTA-2, which was only completely eluted at conductivities between 149 and 176 mS/cm. At 149 mS/cm, OCTA-4 began to be eluted from the AT column, and its presence was still observed at 214.4 mS/cm, which corresponds to about 3 m NaCl. The final affinity order in these experiments was OCTA-3 < OCTA-1 < OCTA-2 ≪ OCTA-4. The affinity of OCTA-4 toward AT was unexpectedly strong.
Kd Values for Oligosaccharide-AT Complexes—The interaction of the four octasaccharides and fondaparinux, the reference compound, with AT was studied by equilibrium titrations. The substantial increase of the intrinsic protein fluorescence (±33.3%) that resulted from complex formation was used as the signal. Kd was determined from the experimental data sets (oligosaccharide concentration: fluorescence intensity pairs) by a least square fit based on Equation 1 (data not shown). The value of Kd and its standard error for each AT-oligosaccharide complex and for the various NaCl concentrations are summarized in Table 2. The binding of fondaparinux to AT was investigated in the presence of 0.1, 0.25, and 0.5 m NaCl yielding Kd values of 0.024, 0.242, and 4.75 μm, respectively, a salt concentration dependence substantially in agreement with the data reported by Olson et al. (22). In the presence of 0.5 m NaCl (the salt concentration used in the NMR studies), OCTA-1, OCTA-2, and OCTA-3 bound the serpin with a moderately higher affinity than fondaparinux (Table 2), whereas OCTA-4 bound AT with a 20-fold lower Kd (0.24 μm). This latter interaction was also investigated in the presence of 0.1 and 0.25 m NaCl. We found Kd values of 1.5 and 13.0 nm, respectively, here again 2 values lower by more than 1 order of magnitude than those measured for the binding of fondaparinux to AT (Table 2).
TABLE 2.
Equilibrium dissociation constant for the various oligosaccharide-AT interactions
| Oligosaccharide | [NaCl] | Kd |
|---|---|---|
| m | m | |
| OCTA-1 | 0.5 | 3.10 ± 0.12 × 10⁻⁶ |
| OCTA-2 | 0.5 | 3.30 ± 0.15 × 10⁻⁶ |
| OCTA-3 | 0.5 | 2.74 ± 0.09 × 10⁻⁶ |
| OCTA-4 | 0.1 | 1.50 ± 0.14 × 10⁻⁹ |
| 0.25 | 1.30 ± 0.20 × 10⁻⁸ | |
| 0.5 | 2.40 ± 0.11 × 10⁻⁷ | |
| Fondaparinux | 0.1 | 2.40 ± 0.30 × 10⁻⁸ |
| 0.25 | 2.40 ± 0.15 × 10⁻⁷ | |
| 0.5 | 4.75 ± 0.23 × 10⁻⁶ |
The plots of log Kd versus log[Na+] shown in Fig. 3 illustrate the Na+ concentration dependence of OCTA-4 and fondaparinux-AT interactions. Assuming that fondaparinux and OCTA-4 behave as polyelectrolytes in solution, we analyzed the effect of Na+ concentration on their binding to AT according to the theory of macromolecule-polyelectrolyte interactions. This approach, used by Record et al. (29) to investigate ligand nucleic acid interaction in the presence of monovalent ions, was also used by others to investigate the effect of the salt concentration on the binding properties of heparin or pentasaccharide to antithrombin (22, 30, 31), thrombin (32), fibroblast growth factor (33), or peptide (34). Complex formation between a polyelectrolyte with bound counterions (Na+) such as an oligosaccharide (fondaparinux or OCTA-4) and a protein (AT) is accompanied by an entropically favorable release of Na+ from the oligosaccharide chain by cationic residues located within the binding site of the protein. Although this process (the polyelectrolyte effect (29)) accounts for the ionic component of the global interaction of AT with the oligosaccharide, its nonionic component results from hydrogen bonding and/or hydrophobic interactions. For these systems the whole interaction is described by Equation 3, which relates the observed equilibrium dissociation constant Kd to the Na+ concentration (29),
 |
(Eq.3) |
where Kdn-i is the equilibrium dissociation constant characterizing the nonionic component at 1 m NaCl; Z is the number of ionic interactions (or ion pairs) formed between oligosaccharide and AT, and ψ is the fraction of Na+ counterion bound to oligosaccharide per unit of charge. ψ, a parameter related to the axial charge density of the polyelectrolyte, was determined to be 0.8 for heparin (30, 32). Equation 3 predicts a linear dependence of log Kd on log [Na+], and Z can thus be derived from the slope of the plot, whereas log Kdn-i represents its intercept with the y axis. From the theoretical straight lines generated by linear regression using the data of Fig. 3, we found that between 4 and 5 ionic interactions are involved in the binding to AT of OCTA-4 (Z = 4.7 ± 0.6). A similar result was found for fondaparinux, the reference product (Z = 4.5 ± 0.6), in agreement with the literature (22). From the y intercepts of the plots, we found that the nonionic contribution to the binding of fondapariux to AT is characterized by Kdn-i = 42.6 μm, in reasonable agreement with published data (31). In contrast, Kdn-i = 1.8 μm for the interaction of OCTA-4 with AT, a 22-fold lower value than for fondaparinux, indicates that the nonionic contributions to the protein binding are significantly enhanced in the case of OCTA-4. Due to Kd values for the complex of OCTA-4 with AT = 1.5 nm at 0.1 m NaCl and pH 7.4, we calculated from the ratio log Kdn-i/log Kd that the nonionic interactions account for about 65% of the total free energy of binding in these conditions.
FIGURE 3.

Dependence on ion Na+ concentration of the equilibrium dissociation constant, Kd, of complex between AT and OCTA-4 (▪) and pentasaccharide (fondaparinux) (□), determined by fluorescence titration. The contribution of ionic interactions to the binding is very similar in both penta- and octasaccharide (Z = 4.5 ± 0.6 and 4.7 ± 0.6, respectively), whereas the contribution of nonionic interactions is much bigger in octasaccharide (Kdn-i penta- = 42.6 μm; Kdn-i octa- = 1.8 μm).
Molecular Conformation of the Oligosaccharides—As reported previously for OCTA-1 and OCTA-3 (10), the conformation of OCTA-2 and OCTA-4 in buffer solution was determined by analysis of 3JH-H (three-bond proton-proton coupling constants) and NOEs. 3JH-H couplings measured by one-dimensional 1H spectra (Table 1) indicated that all glucosamine and glucuronic acid residues were present in aqueous solution in the 4C1 conformation. In contrast, the conformations of the unsaturated terminal uronic acid residues (ΔU and ΔU2S) were influenced by 2-O-sulfation. Their measured 3JH-H values are consistent with a preferred 2H1 half-chair conformation for ΔU residue of OCTA-2 and a preferred 1H2 half-chair conformation for ΔU2S residue of OCTA-4 (35), similarly to what was observed for OCTA-1 and OCTA-3, respectively (10).
3JH-H couplings of the IdoUA2S within the pentasaccharide (I) indicate an equilibrium between 1C4 and 2SO forms in both octasaccharides. Measurement of 3JH-H couplings for I″ residue of OCTA-2 was not possible because of the large line width of its H1 signal and the overlap of the H5 signal with the β-forms of the reducing N-acetylated glucosamine.
Because 1C4 and 2SO conformations exhibit distinct H5-H2 distances (4.0 and 2.4 Å, respectively) (16), the corresponding NOEs can be considered as a marker for the 2SO conformation. Particularly, the ratio between H5 and H4 (showing the same distance in both 1C4 and 2SO geometries) and H5-H2 NOEs can be related to the relative percentage of the two conformers. An H5-H2 NOE having smaller intensity than its corresponding H5-H4 NOE was measured for the I moiety in both OCTA-2 and OCTA-4 (Table 3), indicating that this residue is present in solution in equilibrium between the 1C4and 2SO conformations. On the contrary, no H5-H2 correlation was detected for I″ in OCTA-2, confirming that this moiety is present in solution in a pure 1C4 form. Iduronic acid residue regions of the two-dimensional NOESY spectra of OCTA-2 and OCTA-4 are shown in supplemental Fig. S3.
TABLE 3.
H5-H2 and H5-H4 NOE magnitudes (%) of iduronic acid residues of OCTA-2 and OCTA-4, in their free state, measured at 35 °C in phosphate buffer 10 mm, pH 7.4, and 0.5 m NaCl at three mixing time values
| Mixing | OCTA-2 | OCTA-4 | |
|---|---|---|---|
| ms | |||
| H5-H2 I | 100 | 1.0 | 1.5 |
| 200 | 2.5 | 1.7 | |
| 300 | 3.6 | 3.4 | |
| H5-H4 I | 100 | 3.0 | 2.8 |
| 200 | 5.4 | 5.2 | |
| 300 | 8.4 | 7.6 | |
| H5-H2 I″ | 100 | 0 | |
| 200 | 0 | ||
| 300 | 0 | ||
| H5-H4 I″ | 100 | 1.8 | |
| 200 | 2.6 | ||
| 300 | 4.3 |
STD Experiments—To identify the ligand epitope binding, one-dimensional STD experiments (36, 37) were performed on both the pentasaccharide fondaparinux and the four octasaccharides in the presence of AT (about 50-fold excess of the ligand). The STD spectra in comparison with their corresponding reference spectra are shown in Figs. 4 and 5. The STD signals of AGA*IA residues are the most intense ones, whereas signals of residues belonging to the reducing and nonreducing end extensions are weaker or almost disappear from the spectra. Because H2 of the trisulfated glucosamine (GlcNNS,3,6S) residue is not affected by signal overlapping in all the spectra, it was chosen as reference peak. The STD intensity of anomeric and H2 signals of AGA*IA ranges from 80 to 120% in all octasaccharides. The relative STD intensity of each AGA*IA signal remains constant independently from the structure of the octasaccharides (e.g. it is 90-100% for both H1 of I and H2 of G) (Fig. 6), as expected when their pentasaccharide sequence is located in the same position within the AT-binding site.
FIGURE 4.

Partial 1H NMR spectra of the complex OCTA-1/AT and OCTA-2/AT (molar ratio 50:1) at 35 °C and 600 MHz. a, STD; b, reference 1H spectrum. Spectra were recorded with on resonance irradiation at 7.2 ppm and a saturation time of 2 s. Asterisks indicate signals selectively weakened in STD spectra. (ANAc = GlcNNAc,6S of AGA*IA sequence).
FIGURE 5.

Partial 1H NMR spectra of the complex OCTA-3/AT and OCTA-4/AT (molar ratio 50:1) at 35 °C and 600 MHz. a, STD; b, reference 1H spectrum. i indicates impurity. Spectra were recorded as indicated in Fig. 4 legend.
FIGURE 6.

Relative intensities of STD proton signals, normalized to that of the corresponding H2 of residue A* of sequence AGA*IA showing that the pentasaccharide protons receive the largest amount of saturation transfer. Asterisks indicate signals overlapping in the corresponding proton spectrum.
Relatively intense signals (40-60%) were observed also for H1 and H4 of the unsaturated uronate residue in the STD spectrum of the OCTA-1, indicating that this residue is close to the binding region. On the contrary, both H1 and H2 of A″ show weak STD signals, indicating a larger distance of this residue from AT. Moreover, the H1 signal of I″ is almost absent in the STD spectrum, whereas the H5 signal of the same residue is relatively intense, suggesting that this proton is oriented toward the protein surface. Because signals of the α- and β-forms of the reducing N-acetylglucosamine of OCTA-2 overlap with the anomeric signal of I and the H5 of I″, respectively, it is not possible to define the position of this residue relative to the AT-binding site. As observed for OCTA-1, the presence of signals of H4 and H1 of the ΔU residue indicates that this residue receives a part of the saturation because of its proximity to the binding region. An opposite situation was observed for OCTA-3 and OCTA-4, where very weak signals belonging to the nonreducing end disaccharides (H1/H4 of ΔU2S and H1/H2 of A′) indicate that this part of the oligosaccharide chains is not located in the proximity of the binding region. On the contrary, the STD intensities of H2 of G′ of the OCTA-4 and H1 of I′ of the OCTA-3 suggest a contribution of these residues to the binding. The STD signal of H2 of G′ suggests an orientation of the corresponding residue having hydroxyl groups oriented toward AT.
Conformations of AT-bound Octasaccharides—Similarly to what was observed for OCTA-1 and OCTA-3 (10), the 1H NMR spectra of OCTA-2 and OCTA-4 in their complexes with AT, compared with the corresponding ones in the free state (supplemental Figs. S1 and S2), show small shifts of the proton resonances and increased line width, arising from the higher correlation times induced by protein binding. This indicates an interaction between the octasaccharides and AT in an equilibrium regulated by intermediate dynamic exchange. The evidence of the intermolecular interaction was supported by the increased NOE magnitudes induced by AT (supplemental Tables S2-S5). Notably, only a weaker increment is detectable in OCTA-1 because the quantitative analysis of its transferred-NOESY spectra needed to be performed using a smaller protein/ligand ratio (see “Experimental Procedures”).
Iduronic acid conformations were investigated by analyzing intra-residue tr-NOE effects (supplemental Fig. S3) because the increased line width of bound spectra does not allow measurement of 3JH-H. A significant enhancement of H5-H2/H5-H4 NOE ratio of the I residue was observed for both OCTA-2 and OCTA-4. This indicates that the conformation of such moiety is driven toward the 2SO form by the presence of AT, as observed in all AGA*IA-containing oligosaccharides so far described (10, 12, 15). In contrast, the I″ residue of OCTA-2 does not show an H5-H2 tr-NOE signal, indicating that I″ maintains its 1C4 conformation in the presence of AT. In OCTA-4, G′ maintains its 4C1conformation as confirmed by its 3JH1-H2 that assumes the same value measured in the free state (8 Hz).
Computational Studies on Octasaccharide-AT Complexes—The earlier conformational studies on OCTA-1 and OCTA-3 in their complex with AT performed by rigid docking simulations were refined in the present work by performing flexible runs and extended to OCTA-2 and OCTA-4. Ring conformations were set as indicated previously (10). Eight selected glycosidic torsions in each octasaccharide were allowed to move freely. On the basis of STD results, glycosidic linkage geometries of residues inside the AGA*IA sequence were taken as invariable in all the analyzed ligands and they were kept fixed during docking runs. Conversely, glycosidic torsions ϕ and ψ (defined as: ϕ = H1-C1-O1-C4; ψ = C1-O1-C4-H4) between the moieties external to AGA*IA (i.e. ΔU-A, A-I″, I″-A″ in OCTA-1 and OCTA-2; ΔU2S-A′, A′-I′/G′, I′/G′-A in OCTA-3 and OCTA-4) were allowed to move. The glycosidic linkage of the AGA*IA disaccharide moieties nearest to the extension (I-A in OCTA-1 and OCTA-2 and A-G in OCTA-3 and OCTA-4) was also allowed to move, because its geometry is expected to affect the conformation of the extension.
At least 8 of 30 AT-binding structures with AGA*IA in the same position found in the pentasaccharide-AT x-ray complex (12) were calculated by the docking simulation of each octasaccharide. From all the simulated docking oligosaccharide/protein ensembles, the structure that was able to better fit the experimental STD data was selected. In all analyzed ligands, the models maintaining AGA*IA in its original position show essentially the same distances between protons of the AGA*IA sequence and AT residues. In contrast, ligand-protein distances involving proton residues of both reducing and nonreducing end extensions are, on average, larger and different among the four octasaccharides (supplemental Table S6). These findings are in good agreement with experimental data, indicating that STD effects involving AGA*IA residues have similar magnitudes in all the analyzed octasaccharides, whereas smaller STD magnitudes were detected on proton signals of residues corresponding to both reducing and nonreducing end extensions.
In both OCTA-3 and OCTA-4, from all the simulated docking oligosaccharide/protein ensembles, two main clusters of structures can be identified. Models belonging to the first cluster show I′/G′ residues with their 2-OH and 3-OH groups oriented toward the AT surface (Fig. 7). In models of the second cluster, the orientation of these groups is completely reversed by a drastic change of I′/G′-A glycosidic linkage, driving the carboxylic group toward AT surface (supplemental Fig. S4). Consequently, in the latter cluster, the orientation of ΔU2S and A′ residues is also reversed. Comparison with STD data indicates that models of the first cluster are the only ones able to interpret experimental data. Indeed, such models account for interactions between AT and H2 and H1 of both G′/I′ and the A′ residues, whereas in models of the second cluster these protons are far from the AT surface.
FIGURE 7.

Models of OCTA-3/AT (a) and OCTA-4/AT (b) complexes obtained by flexible docking simulations, superimposed to x-ray pentasaccharide (10) (black wires). ϕ and ψ torsions of ΔU2S-A′, A′-I′/G′, I′/G′-A, and A-G glycosidic linkages were allowed to move freely during docking simulations. Protein side chains of amino acid residues involved in binding with AGA*IA extensions are shown (blue tubes). Polar hydrogens of ligand are omitted.
The nonreducing end extension residues of OCTA-3 and OCTA-4 models belonging to the first cluster show essentially the same pattern of distances between their protons and AT residues (supplemental Table S6). The short distances between H2 of their A1′ and Arg-132 and Lys-133 account for the occurrence of ionic interactions between the N-sulfate group of A′ residue and such amino acids. Short distances between hydroxyl groups of G′/I′ moieties and Lys-125, Lys-129, and Arg-132 can also be detected, suggesting that nonionic interactions involving these groups could occur in both octasaccharides (Table 4). Notably, the two octasaccharides differ only in the epimerization and conformation of the uronic acid preceding the AGA*IA sequence, which is that of G′ glucuronic acid in OCTA-4 and I′ iduronic acid in OCTA-3. The selected model of OCTA-3, having I′ in skew-boat conformation, shows a slight increment of the distance from the protein surface of OH-2 and OH-3 of I′, as well as of H2 of A1′ (Table 4 and supplemental Table S6).
TABLE 4.
Selected ligand-protein distances (in Å) measured on models of OCTA-1, -2, -3 and -4/AT complexes obtained by flexible docking simulations (models are shown in Figs. 7 and 8)
Values are referred to distances between the oxygen atom of the indicated hydroxyl group and the heteroatom of the indicated AT residue nearest to such oxygen. Only distances smaller than 7 Å are shown.
| Ligand atom | AT residue | OCTA-1 | OCTA-2 | Ligand atom | AT residue | OCTA-3 | OCTA-4 |
|---|---|---|---|---|---|---|---|
| OH2ΔU | Lys-125 | 5.6 | 5.7 | OH2 I′/G′ | Lys-125 | 5.7 | 5.1 |
| Arg-129 | Arg-129 | 6.6 | |||||
| Arg-132 | 5.7 | 4.4 | Arg-132 | 4.1 | 3.5 | ||
| OH3ΔU | Arg-132 | 4.2 | 4.3 | OH3 I′/G′ | Arg-132 | 4.2 | 3.3 |
| OH3 I″ | Glu-113 | 5.2 | 5.4 |
The docking output models both OCTA-1 and OCTA-2, maintaining AGA*IA in its original position (Fig. 8) shows distances between H1 and H5 atom of I″ moieties and the Glu-113 residue (about 7.0 Å) (supplemental Table S6) accounting for the small STD effects experimentally detected on signals of these protons. Moreover, shorter distances between H1 and H4 atoms of the ΔU moiety and the AT surface were measured in these models and found to be in agreement with the observed STD effects. Both octasaccharides show OH-2 and OH-3 of the ΔU residue close to Lys-125 and Arg-132, indicating possible nonionic interactions between these hydroxyl groups and AT (Table 4).
FIGURE 8.

Models of OCTA-1/AT (a) and OCTA-2/AT (b) complexes obtained by flexible docking simulations, superimposed to x-ray pentasaccharide (10) (black wires).ϕ andψ torsions of ΔU-A, I-A, A-I″, and I″-A″ glycosidic linkages were allowed to move freely during docking simulations. Protein side chains of amino acid residues involved in binding with AGA*IA extensions are shown (blue tubes). Polar hydrogens of ligand are omitted.
Theoretical tr-NOEs were computed on octasaccharide models by the CORCEMA program, evaluating full relaxation and exchange matrix. Following the procedure previously adopted for the AGA*IA pentasaccharide (15), we evaluated the agreement between theoretical and experimental tr-NOEs by calculating R factors. To evaluate the ability of our models to interpret the position of the ligand in the heparin-binding site of AT regardless of ligand internal conformation, tr-NOEs of H1-H2 protons cross-relaxing within glucosamine residues were first analyzed. Models in Figs. 7 and 8 showed a good fitting between theoretical and experimental intra-residue tr-NOEs (R factors ranged from 0.05 to 0.30; see Table 5). H1-H2 tr-NOEs were then also computed on a model of OCTA-1 moved up by a disaccharide unit from the normal AT-binding site (supplemental Fig. S5). This type of shifted structures was also found using rigid docking simulation of OCTA-1, and it corresponds to one possible docking to AT described for an heptasaccharide containing AGA*IA at its nonreducing end (11). However, tr-NOEs computed on this shifted model gave significantly higher R factors (from 0.23 to 0.40; see Table 5) with respect to those found for models preserving the AGA*IA original position. This confirms that the CORCEMA program can discriminate among differently shifted ligands and that, in all the analyzed octasaccharides, the models maintaining the AGA*IA sequence in its original placement best fit the experimental data.
TABLE 5.
H1-H2 tr-NOE values of glucosamine residues of OCTA-1, OCTA-2, OCTA-3, and OCTA-4 in their complex with AT for three different mixing times
Theoretical NOEs were computed on models shown in Figs. 7 and 8 (OCTA-1 shifted model is shown in supplemental Fig. S5). The R factor is also given. (ANAc = GlcNNAc,6S of AGA*IA sequence). NI, signal not integrated because of strong signal overlapping; ND, not determined R factor.
|
Experimental |
Calculated |
R |
|||||
|---|---|---|---|---|---|---|---|
| 100 ms | 200 ms | 300 ms | 100 ms | 200 ms | 300 ms | ||
| OCTA-1 | |||||||
| ANAc | 5.4 | 9.9 | 14.8 | 6.0 | 9.7 | 13.6 | 0.07 |
| A* | 7.0 | 11.3 | 17.8 | 5.5 | 8.7 | 12.2 | 0.30 |
| A | NI | NI | NI | 4.3 | 7.2 | 9.7 | ND |
|
A″
|
7.9
|
10.3
|
14.4
|
7.6
|
12.4
|
17.6
|
0.22
|
| OCTA-2 | |||||||
| ANAc | 7.6 | 8.8 | 14.5 | 7.4 | 11.6 | 16.0 | 0.15 |
| A* | 5.8 | 11.4 | 16.3 | 7.1 | 10.8 | 14.6 | 0.10 |
| A | 2.2 | 6.8 | 10.7 | 6.2 | 9.7 | 12.9 | 0.27 |
|
A″
|
NI
|
NI
|
NI
|
10.7
|
16.8
|
23.5
|
ND
|
| OCTA-3 | |||||||
| A′ | 5.8 | 11.9 | 18.3 | 9.3 | 14.4 | 19.9 | 0.13 |
| ANAc | 6.5 | 12.9 | 18.3 | 7.1 | 10.9 | 14.9 | 0.18 |
| A* | 6.2 | 11.8 | 18.2 | 6.0 | 9.3 | 12.7 | 0.29 |
|
A
|
4.0
|
7.8
|
13.3
|
6.6
|
10.3
|
14.2
|
0.15
|
| OCTA-4 | |||||||
| A′ | 8.1 | 12.9 | 18.4 | 8.6 | 12.8 | 17.4 | 0.05 |
| ANAc | 5.1 | 10.6 | 15.0 | 7.2 | 10.8 | 14.7 | 0.05 |
| A* | 4.5 | 8.3 | 12.8 | 4.9 | 7.0 | 10.1 | 0.20 |
|
A
|
5.5
|
7.2
|
10.6
|
5.1
|
9.6
|
10.8
|
0.14
|
| OCTA-1 shifted | |||||||
| ANAc | 5.4 | 9.9 | 14.8 | 4.2 | 7.6 | 11.3 | 0.23 |
| A* | 7.0 | 11.3 | 17.8 | 3.8 | 6.9 | 10.8 | 0.40 |
| A | NI | NI | NI | 3.9 | 6.5 | 6.5 | ND |
| A″ | 7.9 | 10.3 | 14.4 | 8.8 | 13.7 | 20.4 | 0.40 |
Inter-residue tr-NOEs between protons cross-relaxing across the glycosidic bonds were also analyzed. Models in Figs. 7 and 8 give relatively good R factors ranging from 0.10 to 0.62 (supplemental Tables S2-S5). Such models thus need to be refined by further calculation, to reach a complete satisfactory agreement with the experimental data. However, because small variations of ϕ and ψ glycosidic torsions give rise to strong variations of inter-glycosidic proton distances (and consequently in theoretical tr-NOE magnitudes), no dramatic change in octasaccharide geometry is expected to occur during the optimization. Therefore, the models so far obtained provide useful indications on the “true” octasaccharide geometry (Table 6).
TABLE 6.
ϕ, ψ dihedral angles at the glycosidic linkages measured on models of OCTA-1, -2, -3 and -4/AT complexes obtained by flexible docking simulations (models are shown in Figs. 7 and 8)
Glycosidic linkages within AGA*IA sequence are highlighted in bold boxes.

DISCUSSION
In this work, the structure of two novel AT-binding octasaccharides (OCTA-2 and OCTA-4) isolated from enoxaparin have been characterized by sequence analysis and NMR spectroscopy. Their AT binding properties and molecular conformations in the absence and presence of AT have been compared with those of previously described OCTA-1 and OCTA-3 (10). In OCTA-4, the AGA*IA sequence is preceded by a glucuronic acid (G′) residue instead of iduronic acid that normally occurs in most common heparins and low molecular weight heparins (5).
Fluorescence titrations performed in 0.5 m NaCl indicated that at this salt concentration the affinity to AT of octasaccharides 1-4 is characterized by equilibrium dissociation constants 2-20-fold lower than those measured for the pentasaccharide-AT complex, OCTA-4 forming the tightest complex with the serpin-Kd = 0.24 μm. Affinity chromatography on immobilized AT of an octasaccharide mixture indicated the following order of elution: OCTA-3 < OCTA-1 < OCTA-2 ≪ OCTA-4. These results confirmed that both reducing and nonreducing end AGA*IA extensions contribute to binding to AT. Moreover, they confirmed that the different affinity of AGA*IA-containing oligomers depends on the structure of these extensions.
Despite the strong evidence accumulated on the specificity of heparin-AT binding, (3, 10, 15), recent studies suggested other possible assemblies between the negatively charged heparin chains and AT (38, 39). In these latter studies, the possibility has been considered that sulfated residues in heparin sequences, different from that of the AT-binding site, may activate AT through nonspecific interactions. The STD analysis carried out in this study, and for the first time applied to glycosaminoglycan-protein complexes, indicates that all the octasaccharide-AT complexes show the whole pattern of contacts identified in the pentasaccharide-AT complex, further supporting the specificity of binding. This study also suggests that, to a lesser extent, additional contacts involving reducing and nonreducing extensions of the AGA*IA sequence contribute to the binding. In fact, STD experiments indicate that the sequence AGA*IA lies closer to the AT-binding site than its reducing or nonreducing end extensions. All analyzed compounds showed either comparable STD effects on AGA*IA signals.
tr-NOEs experiments indicated also that the bound conformation of the AGA*IA sequences in the four octasaccharides was essentially the same as that assumed in the pentasaccharide, including the 2SO skew-boat conformation for the I residue. tr-NOE analysis also indicated that in the presence of AT both the 2-O-sulfated residue I″ in OCTA-1 (10) and the non-sulfated I″ residue of OCTA-2 adopt the 1C4 conformation. These findings suggest that the 1C4 conformation of the iduronate residue located immediately after the AGA*IA sequence could enhance the AT affinity of AGA*IA containing oligosaccharides, either by optimizing contacts between AGA*IA and AT or promoting additional contacts involving the AGA*IA reducing extension. On the other hand, the I′ residue of OCTA-3, despite lacking in 2-O-sulfation, is known to be driven to the 2SO form by the presence of AT (10), whereas G′ of OCTA-4 maintains its 4C1 conformation. We can thus speculate that 4C1 and 2SO conformations of the GlcA and IdoUA residues, respectively, preceding the AGA*IA sequence could enhance the AT affinity of AGA*IA-containing oligosaccharides, whereas the 1C4 chair form does not optimize contacts with the protein.
Model outputs from flexible docking simulations, with the AGA*IA sequence maintaining the same position adopted in pentasaccharide/AT structures, can interpret both STD and tr-NOE data. In such models the distances between protons of the AGA*IA sequence and AT residues are quite similar, whereas ligand-protein distances involving residues at the extensions are, on the average, larger and different among the four octasaccharides (supplemental Table S6). Moreover, in all octasaccharide-AT complexes, glycosidic linkages within the AGA*IA sequence show essentially the same geometry, supporting the concept that this sequence interacts with AT with high specificity (Table 5). In all octasaccharide-AT complex models, short distances were found between uronic acid OH groups of both reducing and nonreducing end AGA*IA extensions and AT, accounting for the occurrence of nonionic interaction that could contribute to enhance the affinity of the octasaccharide with respect to the pentasaccharide (Table 3).
The higher nonionic contribution to AT affinity of OCTA-4 (Kdn-i = 1.8 μm), with respect to the pentasaccharide (Kdn-i = 42.6 μm) (Fig. 3), can be attributed to the stronger nonionic interactions between AT and OH-2 and OH-3 groups of G′ residue. Besides nonionic contacts with Lys-125 and Arg-129, the proposed model (Fig. 7) shows particularly short distances between these hydroxyl groups and Arg-132 (Table 4).
These observations support the idea put forward in a recent study (31), indicating that nonionic interactions can play important roles in the binding of charged saccharides to proteins and further emphasize the importance of characterizing these binding components. The presence of iduronic acid instead of glucuronic acid at the nonreducing extension of OCTA-3 reduces the affinity by 1 order of magnitude. The conformational flexibility of iduronic acid may affect the binding efficacy of the octasaccharide both in terms of entropic and enthalpic contributions and by increasing intermolecular distances between I′ hydroxyl groups and AT as proposed in our model. Such hypothesis needs to be confirmed by further studies using isothermal titration calorimetry and designed AT mutants.
The occurrence of a GlcA residue near AGA*IA in OCTA-4 deserves a special comment. In fact, IdoUA residues are the prevalent uronic acids in this position near the active site of heparin for AT (3). Because relatively higher amounts of 2-O-sulfated GlcA were found in enoxaparin as compared with unfractionated heparin (40), the present finding suggests that GlcA could be generated by C5-epimerization of IdoUA residues under the basic conditions used for the preparation of enoxaparin. Studies are underway to validate this hypothesis. The extension role of the active pentasaccharide sequence on AT binding properties of heparin oligosaccharides has to be considered in the design of a new generation of tailored low and very low molecular weight heparins. The type of depolymerization process applied to complex heparin chains may generate many structural variants that influence the AT binding properties and regulate the interaction with several other proteins as well.
Supplementary Material
Acknowledgments
We thank Dr. Davide Vecchietti (G. Ronzoni Institute, Milan, Italy) for the fruitful collaboration in protein purification and sample preparations.
The costs of publication of this article were defrayed in part by the payment of page charges. This article must therefore be hereby marked “advertisement” in accordance with 18 U.S.C. Section 1734 solely to indicate this fact.
The on-line version of this article (available at http://www.jbc.org) contains supplemental Tables S1-S6 and Figs. S1-S5.
Footnotes
The abbreviations used are: LMWHs, low molecular weight heparins; AT, antithrombin; CTA-SAX, cetyltrimethylammonium-strong anion-exchanger; GlcNNAc, N-acetyl-α-d-glucosamine; GlcNNAc,6S (or ANAc) N-acetylated, 6-O-sulfated GlcN; GlcNNS,6S (or A), N,6-O-disulfated GlcN; GlcNNS,3,6S (or A*), N,3,6-O-trisulfated GlcN; GPC, gel permeation chromatography; IdoUA2S (or I), 2-O-sulfated IdoUA; AGA*IA, pentasaccharide sequence of GlcNNAc,6S-GlcA-GlcNNS,3,6S-IdoUA2S-GlcNNS,6S; ΔU, 4,5-unsaturated uronic acid; ΔU2S, 2-O-sulfated, 4,5-unsaturated uronic acid; A′, GlcNNS,6S of nonreducing end AGA*IA extension; A″, GlcNNS,6S/GlcNNAc,6S of reducing end AGA*IA extension; I′, IdoUA of nonreducing end AGA*IA extension; G′, GlcA of nonreducing end AGA*IA extension; I″, IdoUA/IdoUA2S of reducing AGA*IA extension; 3JH-H, three-bond proton-proton coupling constant; NOE, nuclear Overhauser effect; tr-NOE, transferred NOE; NOESY, NOE spectroscopy; STD, saturation transfer difference; mS, millisiemens; HPLC, high pressure liquid chromatography.
References
- 1.Hoppensteadt, D., Iqbal, O., and Fareed, J. (2005) in Chemistry and Biology of Heparin and Heparan Sulfate (Garg, H. G., Linhardt, R. J., and Hales, C. A., eds) pp. 583-606, Elsevier Ltd., Oxford, UK
- 2.Thunberg, L., Bäckström, G., and Lindahl, U. (1982) Carbohydr. Res. 100 393-410 [DOI] [PubMed] [Google Scholar]
- 3.Petitou, M., and van Boeckel, C. A. A. (2004) Angew. Chem. Int. Ed. 43 3118-3133 [DOI] [PubMed] [Google Scholar]
- 4.Casu, B. (2005) in Chemistry and Biology of Heparin and Heparan Sulphate (Garg, H. G., Linhardt, R. J., and Hales, C. A., eds) pp. 1-28, Elsevier Ltd., Oxford, UK
- 5.Casu, B., and Lindahl, U. (2001) Adv. Carbohydr. Chem. Biochem. 57 159-206 [DOI] [PubMed] [Google Scholar]
- 6.de Kort, M., Buijsman, R. C., and van Boeckel, C. A. (2005) Drug Discov. Today 10 769-779 [DOI] [PubMed] [Google Scholar]
- 7.Linhardt, R. J., and Gunay, N. S. (1999) Semin. Thromb. Hemostasis 25 5-16 [PubMed] [Google Scholar]
- 8.Toida, T., Hileman, R. E., Smith, A. E., Vlahova, P. I., and Linhardt, R. J. (1996) J. Biol. Chem. 271 32040-32047 [DOI] [PubMed] [Google Scholar]
- 9.Loganathan, D., Wang, H. M., Mallis, L. M., and Linhardt, R. J. (1990) Biochemistry 29 4362-4368 [DOI] [PubMed] [Google Scholar]
- 10.Guerrini, M., Guglieri, S., Beccati, D., Torri, G., Viskov, C., and Mourier, P. (2006) Biochem. J. 399 191-198 [DOI] [PMC free article] [PubMed] [Google Scholar]
- 11.Belzar, K. J., Dafforn, T. R., Petitou, M., Carrell, R. W., and Huntington, J. A. (2000) J. Biol. Chem. 275 8733-8741 [DOI] [PubMed] [Google Scholar]
- 12.Jin, L., Abrahams, J. P., Skinner, R., Petitou, M., Pike, R. N., and Carrell, R. W. (1997) Proc. Natl. Acad. Sci. U. S. A. 94 14683-14688 [DOI] [PMC free article] [PubMed] [Google Scholar]
- 13.Johnson, D. J., Li, W., Adams, T. E., and Huntington, J. A. (2006) EMBO J. 25 2029-2037 [DOI] [PMC free article] [PubMed] [Google Scholar]
- 14.Li, W., Johnson, D. J., Esmon, C. T., and Huntington, J. A. (2004) Nat. Struct. Mol. Biol. 11 857-862 [DOI] [PubMed] [Google Scholar]
- 15.Hricovini, M., Guerrini, M., Bisio, A., Torri, G., Petitou, M., and Casu, B. (2001) Biochem. J. 359 265-272 [DOI] [PMC free article] [PubMed] [Google Scholar]
- 16.Ragazzi, M., Ferro, D. M., and Provasoli, M. (1986) J. Comput. Chem. 7 105-112 [DOI] [PubMed] [Google Scholar]
- 17.Casu, B., and Torri, G. (1999) Semin. Thromb. Hemostasis 25 17-26 [PubMed] [Google Scholar]
- 18.Boudier, C., and Bieth, J. G. (2001) Biochemistry 40 9962-9967 [DOI] [PubMed] [Google Scholar]
- 19.Mourier, P. A. J., and Viskov, C. (2004) Anal. Biochem. 332 299-313 [DOI] [PubMed] [Google Scholar]
- 20.Höök, M., Björk, I., Hopwood, J., and Lindahl, U. (1976) FEBS Lett. 66 90-93 [DOI] [PubMed] [Google Scholar]
- 21.Olson, S., and Shore, J. (1981) J. Biol. Chem. 256 11065-11072 [PubMed] [Google Scholar]
- 22.Olson, S., Björk, I., Sheffer, R., Craig, P., Shore, J., and Choay, J. (1992) J. Biol. Chem. 267 12528-12538 [PubMed] [Google Scholar]
- 23.Huntington, J. A., Olson, S. T., Fan, B., and Gettins, P. G. W. (1996) Biochemistry 35 8495-8503 [DOI] [PubMed] [Google Scholar]
- 24.Desai, U. R., Petitou, M., Bjork, I., and Olson, S. T. (1998) J. Biol. Chem. 273 7478-7487 [DOI] [PubMed] [Google Scholar]
- 25.Lin, P., Sinha, U., and Betz, A. (2001) Biochim. Biophys. Acta 1526 105-113 [DOI] [PubMed] [Google Scholar]
- 26.Morris, G. M., Goodsell, D. S., Halliday, R. S., Huey, R., Hart, W. E., Belew, R., and Olson, A. J. (1998) J. Comput. Chem. 19 1639-1662 [Google Scholar]
- 27.Moseley, H. N. B., Curto, E. V., and Krishna, N. R. (1995) J. Magn. Reson. 108 243-261 [DOI] [PubMed] [Google Scholar]
- 28.Angulo, J., Hricovíni, M., Gairi, M., Guerrini, M., de Paz, J. L., Ojeda, R., Martín-Lomas, M., and Nieto, P. M. (2005) Glycobiology 15 1008-1015 [DOI] [PubMed] [Google Scholar]
- 29.Record, M. T., Jr., Lohman, M. L., and De Haseth, P. (1976) J. Mol. Biol. 107 145-158 [DOI] [PubMed] [Google Scholar]
- 30.Olson, S. T., and Bjork, I. (1991) J. Biol. Chem. 266 6353-6364 [PubMed] [Google Scholar]
- 31.Hjelm, R., and Schedin-Weiss, S. (2007) Biochemistry 46 3378-3384 [DOI] [PubMed] [Google Scholar]
- 32.Olson, S. T., Halvorson, H. R., and Björk, I. (1991) J. Biol. Chem. 266 6342-6352 [PubMed] [Google Scholar]
- 33.Thompson, L. D., Pantoliano, M. W., and Springer, B. A. (1994) Biochemistry 33 3831-3840 [DOI] [PubMed] [Google Scholar]
- 34.Hileman, R. E., Jennings, R. N., and Linhardt, R. J. (1998) Biochemistry 37 15231-15237 [DOI] [PubMed] [Google Scholar]
- 35.Ragazzi, M., Ferro, D. R., Provasoli, A., Pumilia, P., Cassinari, A., Torri, G., Guerrini, M., Casu, B., Nader, H. B., and Dietrich, C. P. (1993) J. Carbohydr. Chem. 12 523-535 [Google Scholar]
- 36.Mayer, M., and Meyer, B. (1999) Angew. Chem. Int. Ed. 38 1784-1788 [DOI] [PubMed] [Google Scholar]
- 37.Mayer, M., and Meyer, B. (2001) J. Am. Chem. Soc. 123 6108-6117 [DOI] [PubMed] [Google Scholar]
- 38.Seyrek, E., Dubin, P. L., and Henriksen, J. (2007) Biopolymers 86 249-259 [DOI] [PubMed] [Google Scholar]
- 39.Verli, H., and Guimarães, J. A. (1997) J. Mol. Graph. Model. 15 18-369346820 [Google Scholar]
- 40.Guerrini, M., Guglieri, S., Naggi, A., Sasisekharan, R., and Torri, G. (2007) Semin. Thromb. Hemostasis 33 478-487 [DOI] [PubMed] [Google Scholar]
Associated Data
This section collects any data citations, data availability statements, or supplementary materials included in this article.