Abstract
The actin filament is quite dynamic in the cell. To determine the relationship between the structure and the dynamic properties of the actin filament, experiments using actin mutants are indispensable. We focused on Gln137 to understand the relationships between two activities: the conformational changes relevant to the G- to F-actin transition and the activation of actin ATPase upon actin polymerization. To elucidate the function of Gln137 in these activities, we characterized Gln137 mutants of human cardiac muscle α-actin. Although all of the single mutants, Q137E, Q137K, Q137P, and Q137A, as well as the wild type were expressed by a baculovirus-based system, only Q137A and the wild type were purified to high homogeneity. The CD spectrum of Q137A was similar to that of the wild type, and Q137A showed the typical morphology of negatively stained Q137A F-actin images. However, Q137A had an extremely low critical concentration for polymerization. Furthermore, we found that Q137A polymerized 4-fold faster, cleaved the γ-phosphate group of bound ATP 4-fold slower, and depolymerized 5-fold slower, as compared with the wild-type rates. These results suggest that Gln137 plays dual roles in actin polymerization, in both the conformational transition of the actin molecule and the mechanism of ATP hydrolysis.
Actin is ubiquitously distributed in eukaryotic cells and plays central roles in physiological activities, such as muscle contraction, cell motility, and cell division. Actin polymerizes from the monomeric form (G-actin) to the filamentous form (F-actin) (1). F-actin and the polymerization process itself perform a variety of physiological functions in the cell. For example, actin-based motility is driven by the polymerization-depolymerization cycle, which is regulated by many actin-binding proteins (2, 3).
When an actin molecule is incorporated into a filament, it immediately hydrolyzes bound ATP to form ADP-Pi-actin by cleaving the γ-phosphate group of the ATP. Subsequently, the actin releases the product Pi, but the ADP remains bound. The ADP-actin gradually dissociates from the end of F-actin. The dissociated G-actin exchanges the bound nucleotide from ADP to ATP (4). Although G-actin has ATPase activity, the rate of the ATPase is enhanced by about 7,000-fold by the polymerization process (5). The actin ATPase controls the depolymerization process, and thereby functions as an intrinsic timer of filaments (6). The polymerization and depolymerization processes are thought to be associated with conformational transitions of the actin molecule. However, the mechanism that couples the chemical reaction of the ATPase and the conformational changes remains elusive.
Previous studies on the conformational changes of actin subunits have been limited to those induced by Pi release within the filament. The Pi release reportedly changes the conformation of subdomain 2 and thereby destabilizes the actin-actin contacts in the filament, resulting in dissociation of the actin subunit (7-9). The underlying conformational changes were proposed to be the coil-to-helix transition of the DNase I binding loop, which was deduced from the crystal structures of ADP- and AMPPNP2-G-actin labeled with tetramethylrhodamine (10, 11). However, another crystallographic study with recombinant nonpolymerizable G-actins provided no direct support for the previously suggested transition (12).
Very little is known about the mechanism of the activation of actin ATPase induced by polymerization. First, the crystal structure of ATP-G-actin revealed that the side chain of Gln137 positions a water molecule at a location suitable for an in-line attack to the γ-phosphate group of the bound ATP (13, 14). This water molecule is supposed to attack the γ-phosphate group, by analogy to GTP cleavage in small G-proteins (15). Second, our modeling of the F-actin atomic structure, based on x-ray fiber diffraction, revealed that the overall shape of the actin subunit in F-actin is flatter than in G-actin (16).3 This conformational change occurs by a propeller-like motion of the small domain (consisting of subdomains 1 and 2) relative to the large domain (subdomains 3 and 4) around the axis passing through subdomains 1 and 3. This rotation causes the main chain to bend around residue Gln137 (Fig. 1, A and B). Based on these findings, we hypothesized that Gln137 should be involved in both the polymerization and ATPase processes.
FIGURE 1.
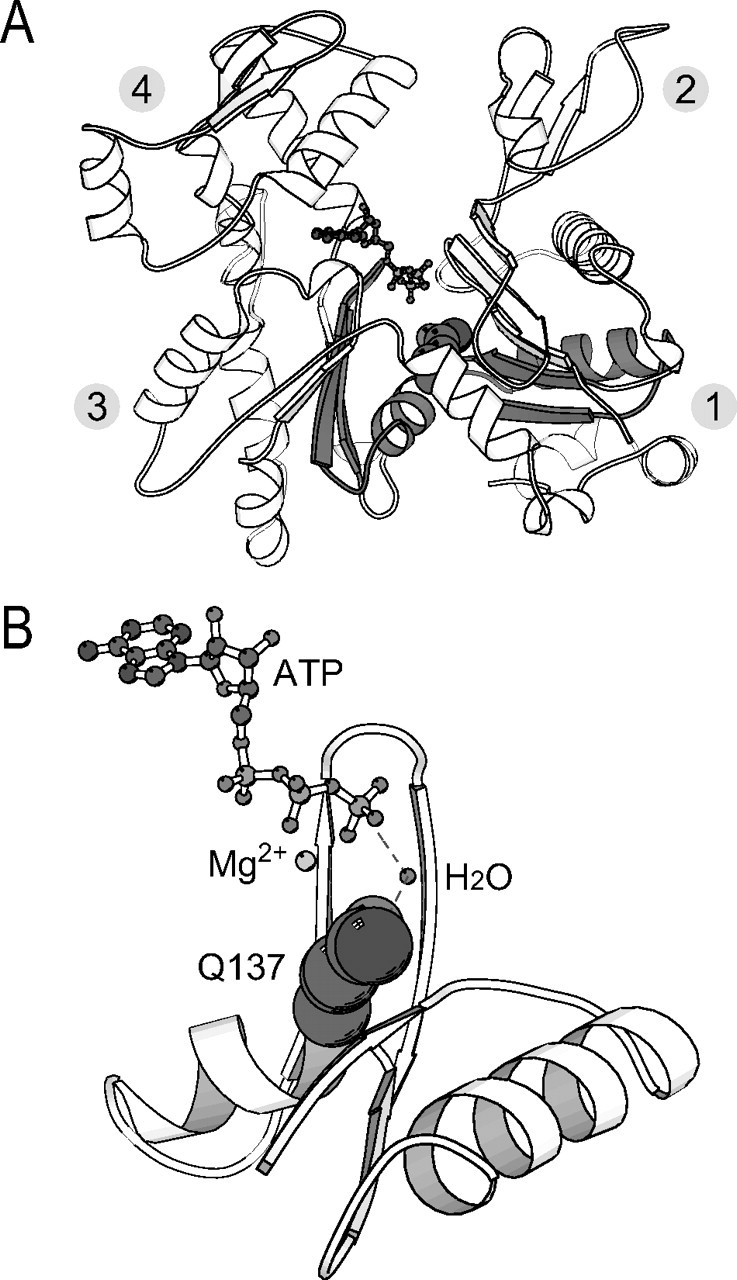
Location of the mutated residue Gln137 in actin. A, overall crystal structure of ATP-G-actin (Protein Data Bank code 1YAG). Gln137 and ATP are indicated by space-filling and ball-and-stick representations, respectively. Subdomains 1-4 are indicated by the corresponding number. B, side view image of the colored region in A. The Mg2+ and the water molecule at the position suitable for an in-line attack to the γ-phosphate group of the bound ATP are indicated. These images were created with MOLSCRIPT (39, 40).
In this study, we characterized Gln137 mutant actins to clarify the relationship between the conformational changes of the actin subunits and the activation of the ATPase. We used recombinant human cardiac muscle α-actin, prepared by a baculovirus-based expression system. Among the expressed single mutants, Q137E, Q137K, Q137P, Q137A, and the wild type (WT), Q137A and WT were purified to high homogeneity. Our analyses of Q137A revealed that its polymerization rate is much faster, whereas its ATP cleavage rate is much slower, as compared with the WT rates. These results suggest that Gln137 has dual roles in polymerization.
EXPERIMENTAL PROCEDURES
Construction of Transfer Vectors—The transfer vector for the expression of the WT human cardiac muscle α-actin, which has a Strep-Tag II affinity tag (WSHPQFEK) at the N terminus followed by a Factor Xa protease recognition sequence (IEGR), was constructed as follows: the corresponding amino acid sequence at the N terminus is “MGWSHPQFEKGGIEGRDDEE” (the additional sequence is underlined). The WT coding sequence was generated by PCR, using the human cardiac muscle α-actin gene (Toyobo) as the template. The sequences of the PCR primers used are shown in supplemental Table S1. The PCR product was first digested by the NcoI and BamHI restriction enzymes and was inserted into the NcoI and BamHI sites of pVL-L21 to construct pVL1392-L21-WT, in which L21 is an enhancer sequence (17). The transfer vectors for the expression of the actin single mutants Q137E, Q137K, Q137P, and Q137A were generated using a QuikChange II site-directed mutagenesis kit (Stratagene). The pVL1392-L21-WT transfer vector was used as the template. The sequences of the mutagenic primers used are shown in supplemental Table S2.
Expression and Purification of Recombinant Actins—The generation and amplification of the recombinant baculovirus and the expression of the recombinant actin were performed basically as described previously (17). The large scale expression of the recombinant actin was performed by using a Cell Master Controller (Wakenyaku). At 60 h post-infection of the recombinant baculovirus at a multiplicity of infection of 2-5, the infected Sf9 cells were collected and lysed in extraction buffer (1 m Tris-HCl, pH 7.2, 0.6 m KCl, 0.5 mm MgCl2, 0.5 mm ATP, 1 mm DTT, 4% Triton X-100, 1 mg/ml Tween 20, and Complete EDTA-free protease inhibitor mixture (Roche Applied Science)) (18-20). The cell lysate was sonicated and then was clarified by centrifugation at 25,000 × g for 30 min, followed by 186,000 × g for 1 h, and the supernatant thus obtained was dialyzed against Strep-Tactin buffer (20 mm Tris-HCl, pH 8.0, 0.2 mm CaCl2, 0.2 mm ATP, and 0.2 mm DTT). The dialyzed lysate was clarified by centrifugation at 25,000 × g for 30 min, followed by 186,000 × g for 1 h, and the supernatant thus obtained was purified by affinity chromatography, using Strep-Tactin Superflow (Qiagen). The eluted fraction was mixed with an equal volume of 2 m Tris G-buffer (2 m Tris-HCl, pH 7.2, 0.2 mm CaCl2, 0.2 mm ATP, and 0.2 mm DTT). The mixture was concentrated using a column VIVASPIN filter (Sartorius) and was subjected to gel filtration chromatography on a HiLoad 26/60 Superdex 200 pg column (GE Healthcare) equilibrated with 1 m Tris G-buffer (1 m Tris-HCl, pH 7.2, 0.2 mm CaCl2, 0.2 mm ATP, and 0.2 mm DTT). The recombinant actin fraction was polymerized by the addition of 100 mm KCl and 2 mm MgCl2 and then was dialyzed against F-buffer (10 mm Tris-HCl, pH 7.2, 100 mm KCl, 2 mm MgCl2, 0.5 mm ATP, and 1 mm DTT). The F-actin was then collected by centrifugation at 415,000 × g for 1 h. The F-actin pellet was dissolved in G-buffer (10 mm Tris-HCl, pH 8.0, 0.2 mm CaCl2, 0.5 mm ATP, and 1 mm DTT) and was then dialyzed against G-buffer. The dialyzed solution was centrifuged at 545,000 × g for 1 h, and the resulting supernatant fraction was used as purified recombinant actin. The concentration of G-actin was determined from the absorbance at 290 nm, using an extinction coefficient of E290 = 0.63 ml mg-1 cm-1 (21).
Purification of Tissue-purified Actins—The tissue-purified skeletal muscle and cardiac muscle α-actins were prepared from the acetone powders of rabbit back and leg muscle and bovine cardiac muscle, respectively (22). The prepared actin was further purified by gel filtration chromatography in G-buffer.
CD Spectropolarimetry—CD spectra were measured with 5 μm actin in a solution containing 5 mm Tris-HCl, pH 8.0, 0.1 mm CaCl2, 0.25 mm ATP, and 0.5 mm DTT, by using a J-725 spectropolarimeter (Jasco). The thermal melting of G-actin was monitored by the ellipticity at 222 nm in the temperature range from 25 to 70 °C, with a constant rate of temperature increase (1 °C/min). The apparent melting temperature (Tm) was defined as the inflection point of the profile.
Electron Microscopy—Actin (12.5 μm) was polymerized by the addition of concentrated polymerization solution, as described under “Polymerization Assay,” except that the final solution also contained 33 mm imidazole-HCl, pH 7.4. The polymerized actin at the early steady state of polymerization was negatively stained with uranyl acetate. Before staining, the polymerized actin was mixed with tobacco mosaic virus, to make the staining homogeneous. Electron micrographs were recorded on SO163 film (Eastman Kodak Co.) at a magnification of 40,000, by using a JEM-2010HC electron microscope (JEOL) at 100 kV. The film was digitized with a PhotoScan2000 scanner (Z/I Imaging).
Polymerization Assay—Polymerization was initiated by the addition of a 20-fold concentrated polymerization solution, to make final concentrations of 100 mm KCl, 2 mm MgCl2, and 0.5 mm ATP in the preincubated actin solution at 25 °C. The amount of F-actin was monitored by the intensities of light scattering to 90° at 660 nm, by using an F-4500 fluorescence spectrophotometer (Hitachi). The maximal rate of apparent elongation was determined as an inflection point of the time course of light scattering.
The vertical axis units of the light scattering time course were converted from “the arbitrary units of light scattering” to “the concentration of F-actin” with reference to the relationships between the scattering intensity and the amount of F-actin; by using the results obtained from tissue-purified actins, the light scattering value of G-actin extrapolated to 25 μm, and the steady state values of F-actin at 25 μm were calibrated to 0 and (25 - Cc) μm of F-actin, respectively.
The critical concentration for polymerization (Cc) was determined as the point of intersection in the linear plots of light scattering values of G- or F-actin versus the actin concentration. For this measurement, actin, in the solution conditions of G- or F-actin at concentrations between 0 and 10 μm, was incubated for 1 h at room temperature and then overnight at 4 °C.
Pi Release upon Actin Polymerization—The time course of the amount of Pi released from F-actin upon polymerization was measured by using an EnzChek phosphate assay kit (Molecular Probes), as described previously (23). Actin was polymerized at 25 μm, as described under “Polymerization Assay,” in the presence of 2-amino-6-mercapto-7-methylpurine riboside and purine nucleoside phosphorylase, and the absorbance at 360 nm was monitored with a DU650 spectrophotometer (Beckman Coulter). The two absorbance values in the absence of actin and in the absence of both 2-amino-6-mercapto-7-methylpurine riboside and purine nucleoside phosphorylase were subtracted as the background.
ADP Generation upon Actin Polymerization—The total amount of ADP was measured by the reverse-phase HPLC method, as described previously (24). Actin was polymerized at 25 μm, as described under “Polymerization Assay,” for 45 min. The reaction was quenched by adding an equal volume of 0.6 m perchloric acid and was centrifuged at 10,000 × g for 10 min, and then the supernatant was applied to a COSMOSIL 5C18-MS reverse-phase column (Nacalai Tesque). The total amount of ADP generated upon polymerization was determined by subtracting the amount of ADP in the G-actin solution from that in the F-actin solution.
Depolymerization Assay—Depolymerization was initiated by the addition of 7.5 μm vitamin D-binding protein (Gc-globulin from Calbiochem) to 5 μm F-actin at the early steady state of polymerization (25). The mixture was incubated on ice and centrifuged at 100,000 × g for 30 min to pellet the F-actin. The pellet fractions were analyzed by SDS-PAGE, and the amount of F-actin was quantified by densitometry.
RESULTS
Expression and Purification of Recombinant Human Cardiac Muscle α-Actins in Insect Cells—Recombinant human cardiac muscle α-actins were expressed by using a baculovirus-based expression system in insect cells. Expression of the recombinant protein was enhanced by inserting the L21 enhancer sequence prior to the initiation codon (17). Using this expression system, all of the single mutants, Q137E, Q137K, Q137P, and Q137A, as well as the WT were expressed (data not shown). The recombinant actins were extracted with a high concentration of Tris (18-20) and were purified by affinity chromatography on a Strep-Tag II column. The endogenous insect actin was eliminated efficiently in this step. The eluted fraction after affinity chromatography still contained a substantial amount of cofilin, which may form a complex with actin in a one-to-one fashion (data not shown). This actin-cofilin complex was dissociated in the presence of 1 m Tris G-buffer, and the cofilin was removed efficiently by gel filtration chromatography (data not shown). Further purification was performed by a cycle of polymerization and depolymerization to eliminate defective recombinant actin.
Through these procedures, WT and Q137A were successfully purified to high homogeneity (Fig. 2). However, we did not succeed in purifying the other mutants; Q137K was not extracted by the solution containing a high concentration of Tris, and Q137E and Q137P were both degraded during the gel filtration chromatography (data not shown). The average yields of the recombinant actins were about 4 mg for WT and 2 mg for Q137A from 8 × 10⁹ cells/3.6 liters of culture. These yields were lower, as compared with the previous report (26). The N-terminal extension did not affect the solubility of recombinant actin in our actin expression system (data not shown).
FIGURE 2.
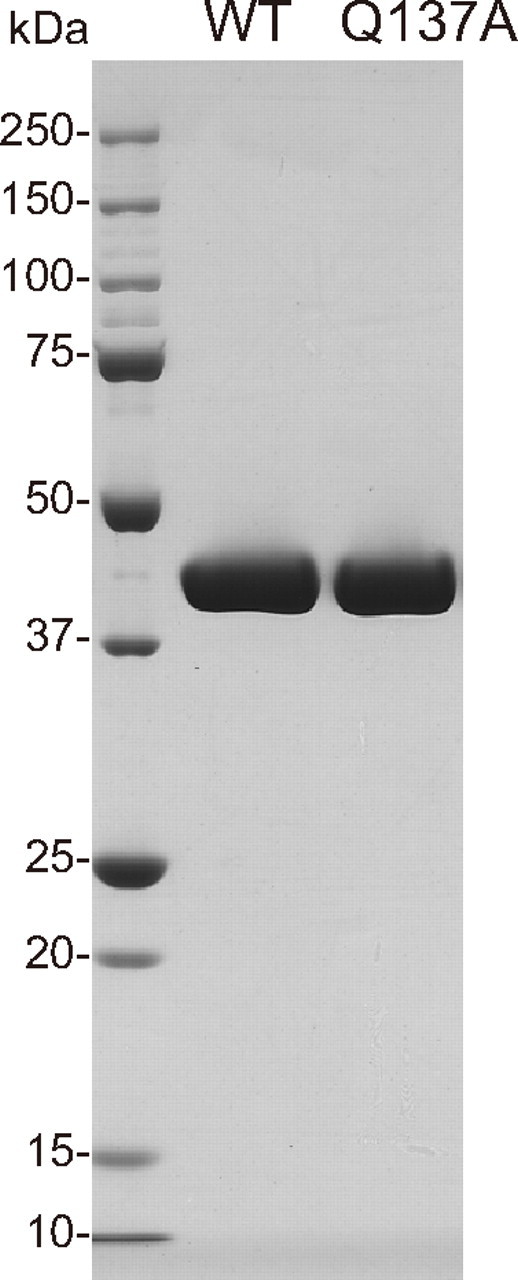
SDS-PAGE pattern of purified recombinant actins. Purified WT and Q137A are shown in the middle and right lanes, respectively. In the left lane are molecular mass standards in kDa.
Both the WT and Q137A actins have a 16-residue-long extension at the N terminus, composed of the Strep-Tag II and Factor Xa recognition sites, because the extension could not be cleaved by Factor Xa. All of the following analyses on the recombinant actins were therefore performed with these actin molecules with the N-terminal extension.
Effects of the Q137A Mutation on the Thermal Stability of G-actin and the F-actin Morphology—To determine whether the recombinant G-actins have the native fold, we measured CD spectra that reflect the content of the secondary structure. The temperature dependence of the CD spectra was also measured to analyze the thermal stability of G-actin. The profiles of the CD spectra of the WT and the tissue-purified actins at 25 °C were similar to each other (Fig. 3A), although the amplitude of the WT spectrum was slightly smaller than that of the tissue-purified actins. The thermal melting profiles showed that the melting temperature (Tm) of the WT was slightly higher, as compared with those of the tissue-purified actins (Fig. 3B and Table 1). These differences between the recombinant WT and tissue-purified actins may be due to the N-terminal extension in the recombinant actins. Despite these minor differences, the CD results indicated that these actins have almost the same fold. Therefore, the WT should be an adequate control in the following experiments. The CD spectra and Tm values of the recombinant Q137A actin were almost identical to those of the recombinant WT (Fig. 3, A and B, and Table 1). This indicates that the Q137A mutation does not grossly distort the actin molecule. Finally, we examined F-actin under an electron microscope. The negatively stained Q137A F-actin filaments were indistinguishable from those of the WT; these actin filaments shared the common characteristic F-actin morphology consisting of two twisted helical strands (Fig. 4). The crossover repeats of these F-actin filaments were 37-38 nm, with the usual S.D. (Table 2). These results indicate that Q137A and WT form normal actin filaments.
FIGURE 3.
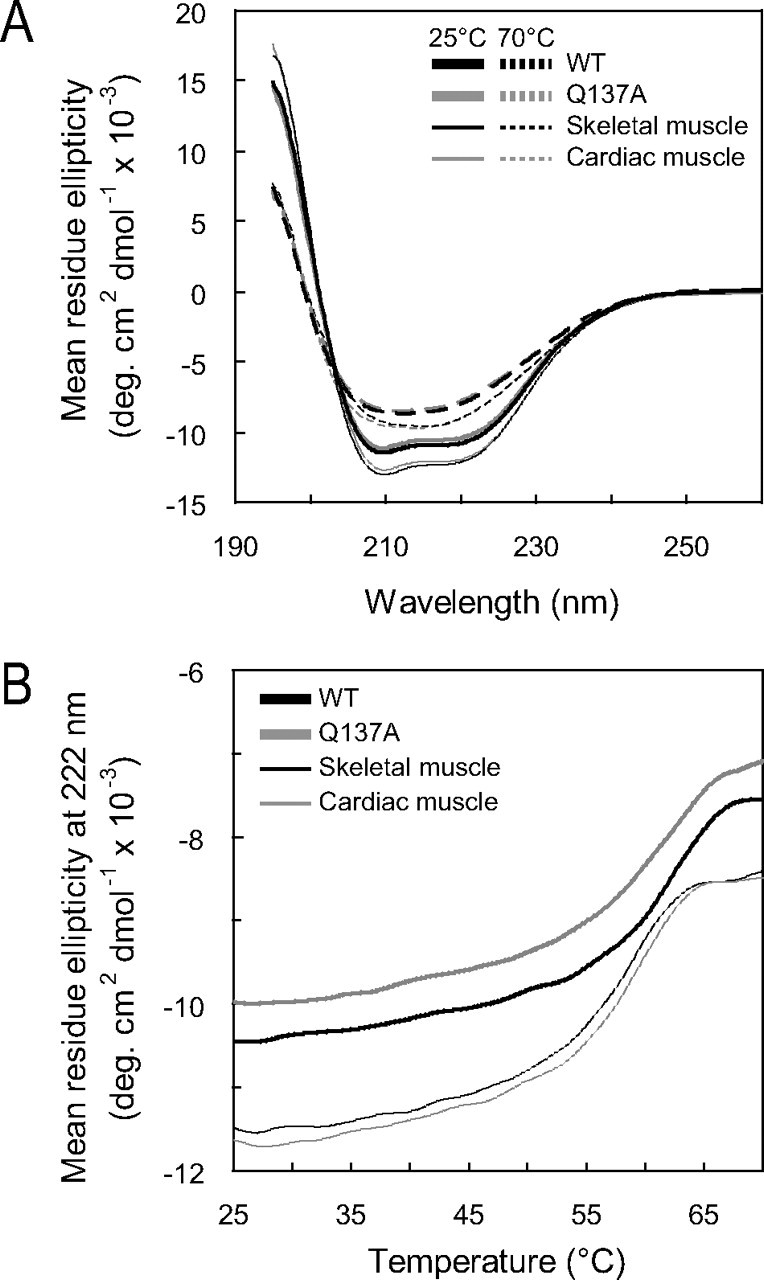
CD spectra and thermal stability of G-actin. A, CD spectra of G-actins measured at 25 and 70 °C (solid and dashed curves, respectively). B, thermal melting profiles of G-actins monitored by the ellipticity at 222 nm, at temperatures increasing from 25 to 70 °C at a constant rate of 1 °C/min. Recombinant (thick curves, WT, black; Q137A, gray) and tissue-purified actins (thin curves, skeletal muscle, black; cardiac muscle, gray) are shown. Samples contained 5 μm actin, 5 mm Tris-HCl, pH 8.0, 0.1 mm CaCl2, 0.25 mm ATP, and 0.5 mm DTT. Each profile was obtained after averaging the measurements of at least two independent preparations. Tm values are shown in Table 1.
TABLE 1.
Apparent Tm of G-actin
The apparent Tm of G-actin was defined as an inflection point of the profile, as shown in Fig. 3B. For each actin species, the determinations were repeated (the number given in parentheses), and the values were averaged to obtain the mean ± S.D.
| Actin | Tm (°C) |
|---|---|
| WT | 62.2 ± 0.6 (n = 11) |
| Q137A | 61.5 ± 1.0 (n = 11) |
| Skeletal muscle | 58.7 ± 0.8 (n = 10) |
| Cardiac muscle | 59.3 ± 0.5 (n = 9) |
FIGURE 4.
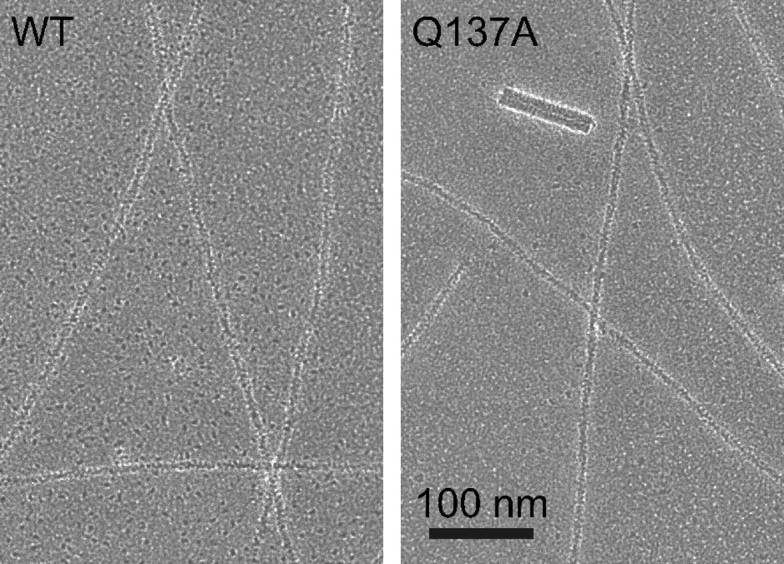
Electron micrographs of negatively stained F-actin. The polymerized WT and Q137A at the early steady state of polymerization were negatively stained with uranyl acetate. Samples contained 12.5 μm actin, 100 mm KCl, 2 mm MgCl2, 0.5 mm ATP, and 33 mm imidazole-HCl, pH 7.4, in G-buffer. Electron micrographs were recorded at a magnification of 40,000. The thick particle in the right panel is a tobacco mosaic virus particle, which was included to make the staining homogeneous. Crossover repeats of F-actins are shown in Table 2.
TABLE 2.
Crossover repeat of F-actin
The negatively stained F-actin images were used for the calculation of the crossover repeats. For each actin species, the crossover repeats were measured from the number of repeats (given in parentheses), and the values were averaged to obtain the mean ± S.D.
| Actin | Crossover repeat (nm) |
|---|---|
| WT | 38.2 ± 1.6 (n = 92) |
| Q137A | 37.4 ± 1.1 (n = 93) |
| Skeletal muscle | 38.0 ± 1.5 (n = 59) |
| Cardiac muscle | 36.9 ± 1.5 (n = 81) |
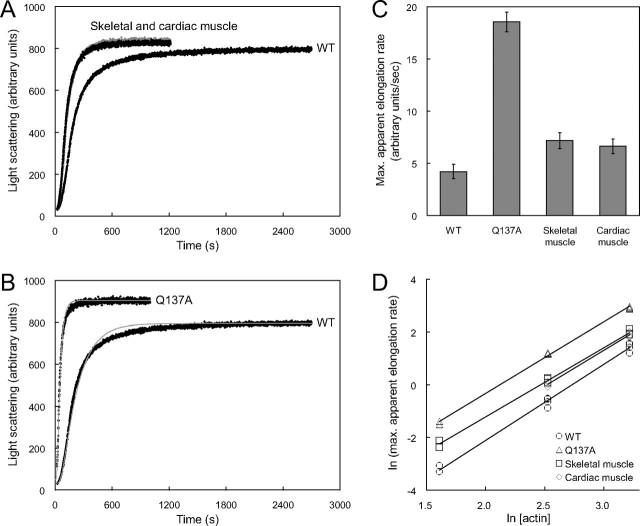
Polymerization of Q137A—To clarify the role of the Gln137 residue in the polymerization process, we first determined the critical concentration (Cc) for polymerization, a measure of the thermodynamic stability of the F-actin state. The Cc of Q137A was substantially lower, as compared with both values from the WT and tissue-purified actins (Table 3). This indicates that the Q137A mutation stabilizes the F-actin state. We next followed the time course of polymerization, by measuring the light scattering at 660 nm, upon the initiation of polymerization by adding MgCl2 and KCl to a 25 μm G-actin solution. The time course of light scattering of the WT was similar to that of the tissue-purified actins, consisting of an initial short lag phase, followed by a rising phase, and a stationary phase (Fig. 5A). These apparently correspond to the nucleation process, including the exchange of divalent cations from Ca2+ to Mg2+ (27), the elongation process, and the steady states of polymerization, respectively. As compared with the tissue-purified actins, the maximal rate of apparent elongation of the WT decreased to 60% (Fig. 5C), whereas the steady state level was identical (Fig. 5A). This reduced elongation rate of the WT may also be due to the N-terminal extension in the recombinant actin.
TABLE 3.
Critical concentration for actin polymerization
Various concentrations of actin at 0-10 μm were incubated in the solution conditions of G- or F-actin. The Cc was defined as the horizontal intersection point of each linear plot of light scattering versus actin concentration. For each actin species, determinations were repeated (the number given in parentheses), and the values were averaged to obtain the mean ± S.D.
| Actin | Cc (μm) |
|---|---|
| WT | 0.71 ± 0.11 (n = 4) |
| Q137A | 0.14 ± 0.13 (n = 4) |
| Skeletal muscle | 0.55 ± 0.21 (n = 4) |
| Cardiac muscle | 0.76 ± 0.08 (n = 4) |
FIGURE 5.
Actin polymerization kinetics. A and B, time courses of the light scattering of WT, Q137A, and tissue-purified actins (skeletal muscle, black; cardiac muscle, gray) were followed after the initiation of polymerization. The solution for the polymerization measurements contained 25 μm actin, 100 mm KCl, 2 mm MgCl2, and 0.5 mm ATP in G-buffer, at 25 °C. The light scattering to 90° was measured at 660 nm. The time courses indicated were obtained by averaging four measurements each for WT and skeletal muscle actin, and three measurements each for Q137A and cardiac muscle actin. For each actin species, at least three independent preparations were used. C, maximal rate of apparent elongation. The maximal rate was determined by using the time course of light scattering measured in A and B. Bars indicate ± S.D. D, relationship between the maximal rates of apparent elongation and the concentration of actin. The time courses of light scattering were measured at actin concentrations of 5, 12.5, and 25 μm and are shown in supplemental Fig. S1. The maximal rates of apparent elongation are plotted versus the actin concentrations in a double logarithmic plot. WT (○), Q137A (▵), skeletal muscle (□), and cardiac muscle (□) actin are shown.
The mutant Q137A polymerized about 4-fold more rapidly, as compared with the WT (Fig. 5C). Consequently, the elongation of Q137A was almost completed within 3 min, whereas the WT was still only halfway to full polymerization (Fig. 5B). The steady state level of Q137A was slightly higher than that of the WT (Fig. 5B). This may be accounted for by minor differences in the length distributions of Gln137 F-actin compared with the WT. Possible contribution of the filament bundling may also not be excluded. Although the lag phase of Q137A was hardly distinguishable at an actin concentration of 25 μm (Fig. 5B), the lag phase was clearly observed in the assay with a low actin concentration, 5 μm actin (supplemental Fig. S1). This suggests that Q137A also polymerizes through the normal processes, consisting of nucleation and elongation. To confirm this, we estimated the size of the nucleus from the slope of double logarithmic plots of the maximal rate of apparent elongation versus the actin concentration (28). The slopes were almost identical among all of the actin species measured, and the size of the nucleus was calculated to be 3.2-3.8 (Fig. 5D). This was consistent with the values reported previously (28). Furthermore, we analyzed the time course of light scattering by using the nucleation-elongation model described by Tobacman and Korn (29) to estimate the apparent nucleation rate constant (knuc) and the filament elongation rate constant (k+). The mean values of the estimated rate constants of Q137A were both higher than those of the WT: knuc (s-1 m-3 × 10⁶, WT = 1.4 ± 0.2, Q137A = 4.2 ± 1.2 and k+ (s-1 m-1 × 10⁸), WT = 3.5 ± 3.7, Q137A = 27.2 ± 7.0 (supplemental Table S3). These results indicate that Q137A polymerizes rapidly through the normal polymerization processes.
ATPase Activity of Q137A—Next, we measured the time course of Pi release upon polymerization to clarify the influence of the Q137A mutation on the rate of ATP hydrolysis. The WT and tissue-purified actins yielded the similar Pi release time courses consisting of three phases, as in the light scattering time course (Fig. 6A). For each actin species, the concentration of released Pi in the early steady state, at around 45 min (2700 s) after the initiation of polymerization, was close to the actin concentration applied (25 μm) (Fig. 6C). With Q137A, the maximal rate of Pi release decreased by about 4-fold, as compared with the WT (Fig. 6B). Consequently, the amount of Pi released at 45 min after the initiation of polymerization was only half that for the WT (Fig. 6C). These results indicate that the Q137A mutation reduces the rate of the ATPase, which may be caused by slower ATP cleavage and/or Pi release. To distinguish between the two possibilities, we quenched the actin by adding perchloric acid at 45 min after the initiation of polymerization and measured the total amount of ADP. The total amount of ADP, bound to and dissociated from the actin molecule, thus obtained was close to the amount of Pi released from Q137A upon polymerization as follows: [ADP] = 14.7 ± 4.1 μm versus [Pi] = 13.5 ± 3.0 μm (Fig. 6C). This indicates that the reduced ATPase rate of Q137A is because of slower ATP cleavage and not because of slower Pi release.
FIGURE 6.
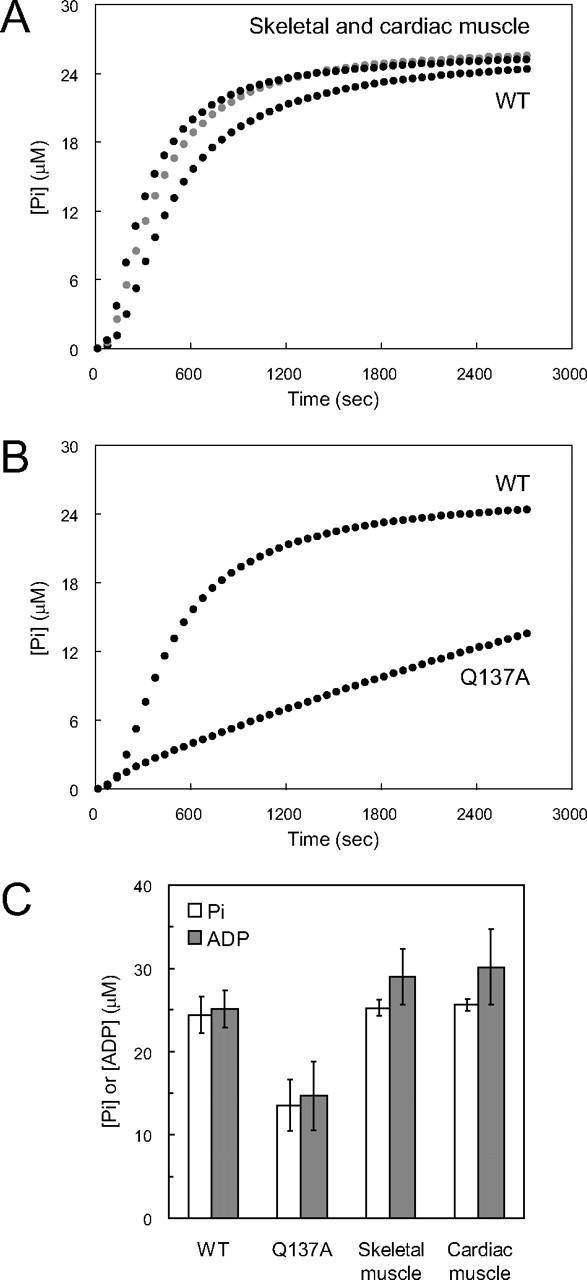
Actin ATPase rate during polymerization. A and B, time courses of Pi release from WT, Q137A, and tissue-purified actins (skeletal muscle, black; cardiac muscle, gray) during polymerization. The concentrations of Pi released from actin solutions at 25 μm were measured with an EnzChek phosphate assay kit. The solution conditions for polymerization were the same as those in the experiments described in Fig. 5. The indicated time courses were obtained by averaging three measurements for WT and tissue-purified actins and four measurements for Q137A. For each actin species, at least two independent preparations were used. C, concentrations of Pi released and total ADP at 45 min after initiation of polymerization. The actin concentration was 25 μm. The concentrations of Pi released correspond to those at the ends of the curves in A and B. The total ADP concentration was measured by reverse-phase HPLC and averaged over six measurements for WT and cardiac muscle actin, four for Q137A, and eight for skeletal muscle actin. For each actin species, at least two independent preparations were used. Bars indicate ± S.D.
Relationship between F-actin Elongation and Pi Release in the Polymerization Process—To determine the relationship between F-actin elongation and Pi release, the time course of light scattering was superimposed on that of Pi release. The units of the vertical axis for the light scattering time course were converted to the concentration of F-actin. The WT and tissue-purified actins shared a common pattern in that the elongation is followed by the Pi release, after a short delay (Fig. 7, A and B). With these actin species, when the polymerization reaches nearly the steady state level (at about 10 min under the present experimental conditions), at least three-quarters of the actin subunits in F-actin are ADP-actin. In contrast, with Q137A at the corresponding time point (at about 3 min), only about 10% of the actin subunits in F-actin are ADP-actin, and the majority remains as ATP-actin (Fig. 7C).
FIGURE 7.
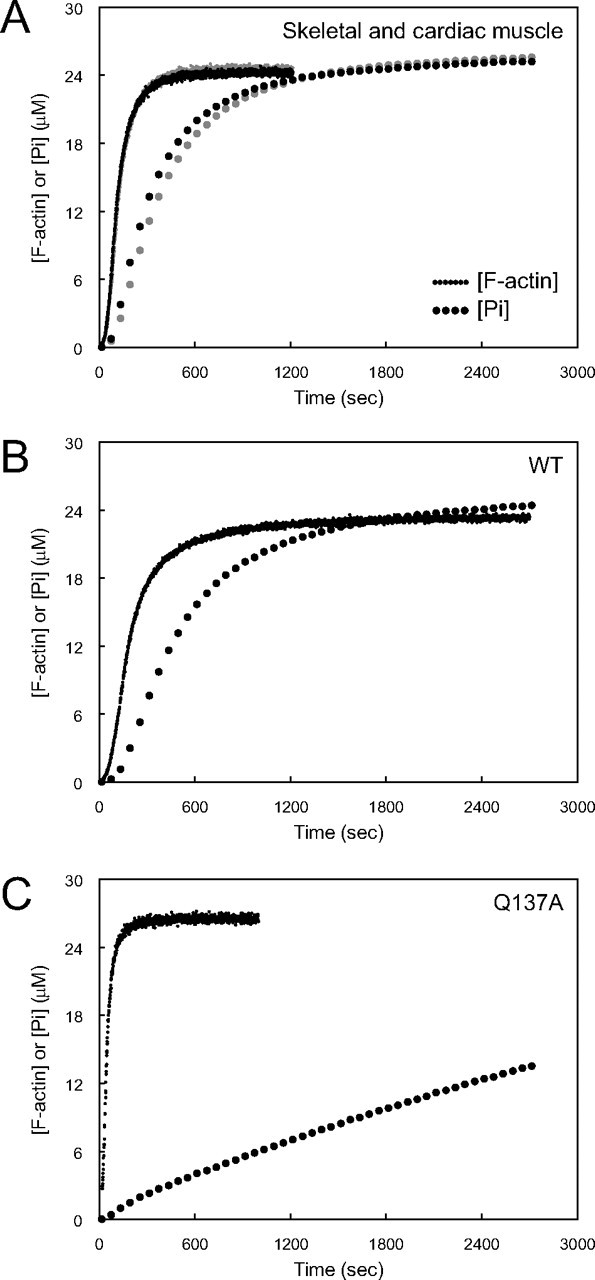
Relationships between the time courses of polymerization and Pi release. A, skeletal muscle actin is shown in black, and cardiac muscle actin is shown in gray; B, WT; C, Q137A. In each panel, the time course of light scattering (continuous curve) shown in Fig. 5, A and B, and the time course of Pi release (dotted curve) shown in Fig. 6, A and B, are superposed. The units of the vertical axis for the light scattering time course were converted to the concentration of F-actin.
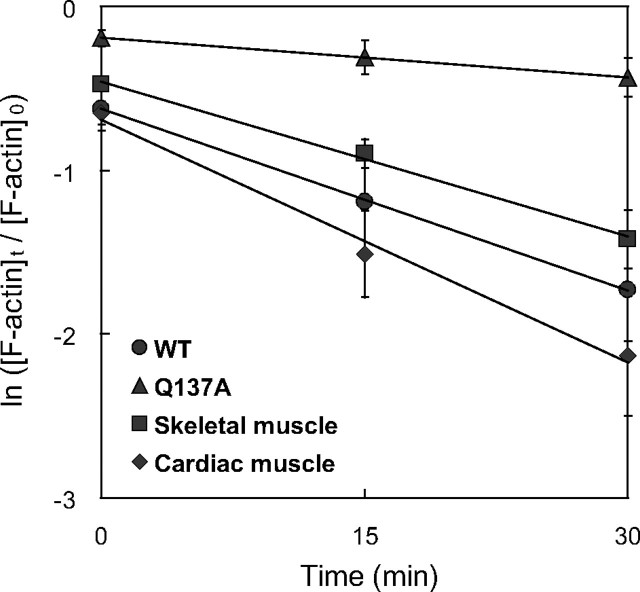
Depolymerization of Q137A—Because Q137A F-actin is composed predominantly of ATP-actin, as described above, we expected that Q137A F-actin would depolymerize more slowly than WT F-actin. This is because the dissociation of ATP-F-actin is slower than that of ADP-F-actin (30). To investigate this possibility, we measured the apparent depolymerization rate of F-actin in the presence of vitamin D-binding protein. Vitamin D-binding protein sequesters free actin monomers so that no back reaction (polymerization) occurs in the present experiments, and it has no effect on the depolymerization rate (25). For all of the actin species tested, the depolymerization showed first-order reaction kinetics (Fig. 8). In the cases of the WT and tissue-purified actins, at 30 min after the initiation of depolymerization, the amounts of F-actin decreased to 10-20% of the initial level. In contrast, with Q137A, 70% of the actin still remained in F-actin at the same time point. This indicates that Q137A has a reduced apparent rate of depolymerization, which is consistent with its lower Cc.
FIGURE 8.
Time course of apparent F-actin depolymerization. Depolymerization was initiated by the addition of 7.5 μm vitamin D-binding protein into a solution containing 5 μm F-actin at the early steady state of polymerization, and the reaction was incubated on ice. The concentration of F-actin was determined by densitometry of the pellet fraction obtained by ultracentrifugation. [F-actin]0 and [F-actin]t indicate the concentration of F-actin before and at time t after the initiation of depolymerization, respectively. Each data point was obtained after averaging five measurements for WT (•), Q137A (▴), and cardiac muscle actin (□), or three measurements for skeletal muscle actin (•). Bars indicate ± S.D.
DISCUSSION
The actin ATPase drives the dynamics of polymerization and depolymerization (2, 3). Therefore, it is important to understand the mechanism of the actin ATPase and its regulation. Previous mutation experiments identified some residues important for the post-ATPase phase. Val159 is involved in sensing the γ-phosphate group of bound ATP (31), and Ser14 links Pi release to the conformational change of the DNase I binding loop (32). This study has, for the first time, presented evidence that Gln137 plays crucial roles in the cleavage of the γ-phosphate group; the substitution of Gln137 to Ala considerably reduces the cleavage rate of bound ATP.
The most remarkable finding in this study is that the mutation Q137A changes both the rate of actin elongation and the rate of ATP cleavage, and the directions of these changes are opposite each other. In the crystal structure of G-actin, the Gln137 residue is located on the base of the nucleotide binding cleft, and its side chain points toward the back wall of the cleft (residues Thr106-Leu110). The amino group of the Gln137 side chain contacts the hydroxyl group of Thr106 on the back wall. On the other hand, the carbonyl group of the Gln137 side chain anchors the water molecule that participates in the hydrogen bond network among the water molecules and hydrophilic side chains in the cleft (13, 14). The acceleration of the elongation may be accounted for as follows. Actin polymerization is accompanied by the flattening of the actin conformation via the propeller-like relative rotation of the two major domains on either side of the nucleotide binding cleft (16).3 The rotation occurs by bending the main chain around Gln137 and Tyr337. The rotation is associated with shear between the two major domains. The interface between the two major domains is divided into two parts, a main contact far from the filament axis, and a minor contact near the filament axis. The main contact of the interface is essentially formed between the hydrophobic residues of the central helix (Gln137-Ser145) and a sheet of three β-strands (Asn296-Ser300, Gly150-Ser155, and Thr160-Ile165) of subdomain 3. This part of the interface seems to be too tight to undergo a change in association with the G- to F-actin transformation. On the other hand, in the minor part of the interface, the loop Pro109-Asn111 undergoes substantial deformation and partially detaches from an adjacent β-strand (Met176-Leu178) of subdomain 3. The deformation of the loop seems to be tightly coupled with the polymerization, and the free-energy barrier of the transformation must affect the elongation rate. The substitution of Gln137 to Ala, with a short side chain, would generate more space around the loop and thus facilitate the deformation, resulting in the acceleration of elongation.
On the other hand, the acceleration of elongation is associated with the deceleration of ATP cleavage. This indicates that the Gln137 residue has separate, specific roles in the ATPase mechanism. Previous reports pointed out that the side chain of Gln137 positions a water molecule at an appropriate location for the in-line nucleophilic attack of the γ-phosphate group of bound ATP, at least in G-actin, and the water molecule would shift to even more suitable locations in F-actin (13, 14). The short side chain of Ala137 cannot position a water molecule at an appropriate location in either G-actin or F-actin, and thus Q137A has a slower ATPase rate.
The next question is how the conformational transition and the ATP cleavage are coupled to each other. Because the elongation is followed by ATP cleavage, with some delay in the cases of the recombinant WT and tissue-purified actins, and because the elongation is associated with the deformation of the loop at the interface (Pro109-Asn111), it is possible that the conformational changes required for the acceleration of ATP cleavage are propagated from the backside of the actin molecule, including the loop Pro109-Asn111 (16).3 This is reminiscent of the activation mechanism of the DnaK ATPase, an Hsp70 homologue with an actin fold (33). However, it should be noted that there are some differences in the ATP-binding sites between actin and DnaK. For example, the water molecule that attacks the γ-phosphate group is positioned by the side chain of Lys70, which extends from the backside in DnaK (33).
With Q137A, the 4-fold acceleration of elongation and the 4-fold deceleration of the ATPase would have interesting consequences. These two factors together could cause the formation of a long “ATP-cap” (34), i.e. a segment of Q137A F-actin consisting almost completely of ATP-actin. Although our knowledge of the structural details of ATP-F-actin is quite important for our understanding of the dynamics of the F-actin filament, the structure of the proposed ATP-F-actin (the ATP-cap) has never been elucidated, mainly because of the temporal nature of the ATP-cap. All of the reported F-actin structures are believed to be those of ADP-F-actin. The long lifetime and/or the long size of the ATP-cap of Q137A actin would make the ATP-cap of Q137A an attractive specimen for the detailed structural analysis of ATP-F-actin. In the microtubule, three proto-filament conformations, consisting of the α- and β-tubulin heterodimers, have been identified, and the transitions between them probably drive the dynamic instability of the microtubule (35, 36). The quasi-straight proto-filament in the GTP-bound form assembles into a sheet, which is further integrated as the straight proto-filament into the fast growing end of the microtubule, forming the “GTP-cap.” The subsequent hydrolysis of GTP to GDP shifts the equilibrium toward the curved proto-filament, which disrupts the microtubule.
The baculovirus-based actin expression system using insect cells has the following advantage. In this system, both the endogenous and recombinant actins are expressed, and therefore, the insect cell can survive even if the mutant actin behaves abnormally. By contrast, the Q137A mutant was lethal in the yeast actin expression system (37). Yeast has only a single actin gene, which is altered in the mutagenesis experiments, and thus it is probably lethal if the expressed actin is seriously defective.
The recombinant WT actin in this study has the extra N-terminal extension to the tissue-purified actin. Although recombinant WT actin polymerizes significantly more slowly than the tissue-purified actin, this difference is so much smaller than the difference between the Q137A and the WT that the results obtained from the present construct are interpretable. Expression without the N-terminal extension causes additional problems. On one hand, endogenous actin in the Sf9 cell should be co-purified, making the preparation heterogeneous. On the other hand, actin expressed without the N-terminal extension (with a tag at the C terminus) had acetyl-Cys-Asp- at the N terminus (data not shown), which is known to be an intermediate in the actin class II processing (38), and it is different from the tissue-purified actin. The dissimilar N terminus may alter the polymerization rate, as the present N-terminal extension does. All together, the present construct may be one of proper choices for the baculovirus-based actin expression, at least at the present level of protein yield. How the N-terminal extension results in the reduced polymerization rate remains obscure. This may occur through some conformational changes of actin or via incomplete methylation of His73; His73 was partially methylated in our actin preparation (data not shown).
Supplementary Material
Acknowledgments
We thank Dr. Ken-Ichi Sano for technical advice regarding the baculovirus-based expression system, Dr. Masayuki Kajitani for providing tobacco mosaic virus, and Dr. Fumio Oosawa and Dr. Koshin Mihashi for discussions and comments on the manuscript.
The costs of publication of this article were defrayed in part by the payment of page charges. This article must therefore be hereby marked “advertisement” in accordance with 18 U.S.C. Section 1734 solely to indicate this fact.
The on-line version of this article (available at http://www.jbc.org) contains supplemental Tables S1-S3, Fig. S1, and an additional reference.
Footnotes
The abbreviations used are: AMPPNP, adenosine 5′-(β,γ-imino)triphosphate; WT, wild type; DTT, dithiothreitol; HPLC, high pressure liquid chromatography.
T. Oda, M. Iwasa, T. Aihara, Y. Maéda, and A. Narita, submitted for publication.
References
- 1.Oosawa, F., and Asakura, S. (1975) Thermodynamics of the Polymerization of Protein, Academic Press, Inc., New York
- 2.Pollard, T. D., Blanchoin, L., and Mullins, R. D. (2000) Annu. Rev. Biophys. Biomol. Struct. 29 545-576 [DOI] [PubMed] [Google Scholar]
- 3.Carlier, M. F., and Pantaloni, D. (2007) J. Biol. Chem. 282 23005-23009 [DOI] [PubMed] [Google Scholar]
- 4.Korn, E. D., Carlier, M. F., and Pantaloni, D. (1987) Science 238 638-644 [DOI] [PubMed] [Google Scholar]
- 5.Pollard, T. D., and Weeds, A. G. (1984) FEBS Lett. 170 94-98 [DOI] [PubMed] [Google Scholar]
- 6.De La Cruz, E. M., Mandinova, A., Steinmetz, M. O., Stoffler, D., Aebi, U., and Pollard, T. D. (2000) J. Mol. Biol. 295 517-526 [DOI] [PubMed] [Google Scholar]
- 7.Orlova, A., and Egelman, E. H. (1993) J. Mol. Biol. 232 334-341 [DOI] [PubMed] [Google Scholar]
- 8.Strzelecka-Golaszewska, H., Moraczewska, J., Khaitlina, S. Y., and Mossakowska, M. (1993) Eur. J. Biochem. 211 731-742 [DOI] [PubMed] [Google Scholar]
- 9.Moraczewska, J., Strzelecka-Golaszewska, H., Moens, P. D., and dos Remedios, C. G. (1996) Biochem. J. 317 605-611 [DOI] [PMC free article] [PubMed] [Google Scholar]
- 10.Otterbein, L. R., Graceffa, P., and Dominguez, R. (2001) Science 293 708-711 [DOI] [PubMed] [Google Scholar]
- 11.Graceffa, P., and Dominguez, R. (2003) J. Biol. Chem. 278 34172-34180 [DOI] [PubMed] [Google Scholar]
- 12.Rould, M. A., Wan, Q., Joel, P. B., Lowey, S., and Trybus, K. M. (2006) J. Biol. Chem. 281 31909-31919 [DOI] [PubMed] [Google Scholar]
- 13.Matsuura, Y., Stewart, M., Kawamoto, M., Kamiya, N., Saeki, K., Yasunaga, T., and Wakabayashi, T. (2000) J. Mol. Biol. 296 579-595 [DOI] [PubMed] [Google Scholar]
- 14.Vorobiev, S., Strokopytov, B., Drubin, D. G., Frieden, C., Ono, S., Condeelis, J., Rubenstein, P. A., and Almo, S. C. (2003) Proc. Natl. Acad. Sci. U. S. A. 100 5760-5765 [DOI] [PMC free article] [PubMed] [Google Scholar]
- 15.Vetter, I. R., and Wittinghofer, A. (2001) Science 294 1299-1304 [DOI] [PubMed] [Google Scholar]
- 16.Oda, T., Stegmann, H., Schroder, R. R., Namba, K., and Maéda, Y. (2007) Adv. Exp. Med. Biol. 592 385-401 [DOI] [PubMed] [Google Scholar]
- 17.Sano, K., Maeda, K., Oki, M., and Maéda, Y. (2002) FEBS Lett. 532 143-146 [DOI] [PubMed] [Google Scholar]
- 18.Pinder, J. C., Sleep, J. A., Bennett, P. M., and Gratzer, W. B. (1995) Anal. Biochem. 225 291-295 [DOI] [PubMed] [Google Scholar]
- 19.Schafer, D. A., Jennings, P. B., and Cooper, J. A. (1998) Cell Motil. Cytoskeleton 39 166-171 [DOI] [PMC free article] [PubMed] [Google Scholar]
- 20.Joel, P. B., Fagnant, P. M., and Trybus, K. M. (2004) Biochemistry 43 11554-11559 [DOI] [PubMed] [Google Scholar]
- 21.Houk, T. W., Jr., and Ue, K. (1974) Anal. Biochem. 62 66-74 [DOI] [PubMed] [Google Scholar]
- 22.Spudich, J. A., and Watt, S. (1971) J. Biol. Chem. 246 4866-4871 [PubMed] [Google Scholar]
- 23.Melki, R., Fievez, S., and Carlier, M. F. (1996) Biochemistry 35 12038-12045 [DOI] [PubMed] [Google Scholar]
- 24.Samizo, K., Ishikawa, R., Nakamura, A., and Kohama, K. (2001) Anal. Biochem. 293 212-215 [DOI] [PubMed] [Google Scholar]
- 25.Weber, A., Pennise, C. R., and Pring, M. (1994) Biochemistry 33 4780-4786 [DOI] [PubMed] [Google Scholar]
- 26.Bookwalter, C. S., and Trybus, K. M. (2006) J. Biol. Chem. 281 16777-16784 [DOI] [PubMed] [Google Scholar]
- 27.Gershman, L. C., Newman, J., Selden, L. A., and Estes, J. E. (1984) Biochemistry 23 2199-2203 [DOI] [PubMed] [Google Scholar]
- 28.Nishida, E., and Sakai, H. (1983) J. Biochem. (Tokyo) 93 1011-1020 [DOI] [PubMed] [Google Scholar]
- 29.Tobacman, L. S., and Korn, E. D. (1983) J. Biol. Chem. 258 3207-3214 [PubMed] [Google Scholar]
- 30.Pollard, T. D. (1986) J. Cell Biol. 103 2747-2754 [DOI] [PMC free article] [PubMed] [Google Scholar]
- 31.Belmont, L. D., Orlova, A., Drubin, D. G., and Egelman, E. H. (1999) Proc. Natl. Acad. Sci. U. S. A. 96 29-34 [DOI] [PMC free article] [PubMed] [Google Scholar]
- 32.Orlova, A., Chen, X., Rubenstein, P. A., and Egelman, E. H. (1997) J. Mol. Biol. 271 235-243 [DOI] [PubMed] [Google Scholar]
- 33.Vogel, M., Bukau, B., and Mayer, M. P. (2006) Mol. Cell 21 359-367 [DOI] [PubMed] [Google Scholar]
- 34.Carlier, M. F., Pantaloni, D., and Korn, E. D. (1984) J. Biol. Chem. 259 9983-9986 [PubMed] [Google Scholar]
- 35.Ravelli, R. B., Gigant, B., Curmi, P. A., Jourdain, I., Lachkar, S., Sobel, A., and Knossow, M. (2004) Nature 428 198-202 [DOI] [PubMed] [Google Scholar]
- 36.Wang, H. W., and Nogales, E. (2005) Nature 435 911-915 [DOI] [PMC free article] [PubMed] [Google Scholar]
- 37.Belmont, L. D., Patterson, G. M., and Drubin, D. G. (1999) J. Cell Sci. 112 1325-1336 [DOI] [PubMed] [Google Scholar]
- 38.Sheff, D. R., and Rubenstein, P. A. (1992) J. Biol. Chem. 267 20217-20224 [PubMed] [Google Scholar]
- 39.Kraulis, P. J. (1991) J. Appl. Crystallogr. 24 946-950 [Google Scholar]
- 40.Esnouf, R. M. (1997) J. Mol. Graph. Model 15 112-134 [DOI] [PubMed] [Google Scholar]
Associated Data
This section collects any data citations, data availability statements, or supplementary materials included in this article.


