

Abstract
Both adipocyte hyperplasia and hypertrophy are determinant factors for adipocyte differentiation during the development of obesity. p21WAF1/CIP1, a cyclin-dependent kinase inhibitor, is induced during adipocyte differentiation; however, its precise contribution to this process is unknown. Using both in vitro and in vivo systems, we show that p21 is crucial for maintaining adipocyte hypertrophy and obesity-induced insulin resistance. The absence of p21 in 3T3-L1 fibroblasts by RNA-mediated interference knockdown or in embryonic fibroblasts from p21-/- mice impaired adipocyte differentiation, resulting in smaller adipocytes. Despite normal adipose tissue mass on a normal diet, p21-/- mice fed high energy diets had reduced adipose tissue mass and adipocyte size accompanied by a marked improvement in insulin sensitivity. Knockdown of p21 in enlarged epididymal fat of diet-induced obese mice and also in fully differentiated 3T3-L1 adipocytes caused vigorous apoptosis by activating p53. Thus, p21 is involved in both adipocyte differentiation and in protecting hypertrophied adipocytes against apoptosis. Via both of these mechanisms, p21 promotes adipose tissue expansion during high fat diet feeding, leading to increased downstream pathophysiological consequences such as insulin resistance.
The process of adipocyte differentiation has been extensively characterized in cultures of preadipocyte clonal cell lines such as mouse 3T3-L1 and 3T3-F442A (1, 2). Adipogenesis requires a sequence of events including growth arrest of proliferating preadipocytes, coordinated reentry into the cell cycle with limited clonal expansion, and growth arrest before terminal differentiation during which lipid accumulation occurs. Thus, it is reasonable to assume that factors involved in cell cycle regulation may have important roles in the adipocyte differentiation process. Cell cycle progression in mammals is governed by various complexes of cyclins and cyclin-dependent kinases (CDKs)2 as well as their inhibitors, of which p21 and p27 are the most widely studied. It was previously suggested that expression of p21 and p27 is changed during the adipogenesis (3). p21 has been reported to be induced by Foxo1 and has been implicated in entry of adipocytes into the clonal expansion phase of adipogenesis; meanwhile, p27 is critical for adipocyte hyperplasia (3-5). The expression of both p21 and p27 is altered during adipocyte differentiation; however, their precise role in adipogenesis, especially at the time of terminal differentiation, remains unclear.
Obesity is caused by over-nutrition and decreased physical activity and is characterized by excess storage of lipids in adipose tissue, which can be accounted for by both adipocyte hyperplasia and hypertrophy. Obesity often precedes insulin resistance and precipitates type 2 diabetes and cardiovascular diseases (6). Impaired adipocyte differentiation is also related to insulin resistance. Based upon the potential roles of CDK inhibitors in cell cycle progression and apoptosis, it is reasonable to speculate that CDK inhibitors could be involved in obesity and insulin resistance through regulation of adipocyte differentiation and adipose tissue growth.
p21WAF1/CIP1 is the major CDK inhibitor and halts the cell cycle at G1 (Refs. 7-10; for review, see Refs. 11 and 12). p21 is a well known target of p53, a stress response. In addition to causing G1 arrest, p21 protects cells from apoptosis (12). We recently found that p21 is a direct gene target of SREBPs, crucial transcription factors involved in lipogenesis and adipogenesis (13, 14). We also reported that p21 expression was highly up-regulated in hypertrophic adipose tissue and in the liver in models of obesity (15, 16). These data prompted us to explore the role of p21 in adipocyte differentiation and hypertrophy and to determine the involvement of p21 in obesity and insulin resistance.
EXPERIMENTAL PROCEDURES
Cell Culture and Adipocyte Differentiation—3T3-L1 cells (ATCC) were maintained in high glucose Dulbecco's modified Eagle's medium (Invitrogen) with 10% fetal calf serum in 5% CO2. Cells were seeded at 2.5 × 10⁵ cell/6-cm collagen-coated dishes (BD Biosciences) (day 4) and cultured to confluence (day 2). After 2 days, cells were replaced with differentiation induction medium A (5 μg/ml insulin, 1 μm dexamethasone, and 0.5 mm isobutylmethylxanthine) (day 0). After 48 h cells were changed to differentiation induction medium B (5 mg/ml insulin) (day 2). Medium was renewed every other day.
Preparation of Recombinant Adenovirus—cDNAs encoding the full-length fragment of mouse p21Waf1/Cip1 were integrated into adenoviral vectors. RNAi adenovirus vectors, RNAi-LacZ (LacZi), p21 RNAi-137 (137i), and p21 RNAi-275 (275i) were constructed with BLOCK-iT™ U6 RNAi Entry Vector kit and BLOCK-iT™ Adenoviral RNAi Expression system (Invitrogen). Each adenoviral vector was propagated in 293A cells and purified by cesium chloride density centrifugation (17, 18).
Oil Red O Stain—Cells were fixed with 10% formalin in phosphate-buffered saline for 10 min at 37 °C and stained with Oil Red O for 60 min at room temperature. Cells were washed with distilled water, and the retained dye was eluted by isopropanol (19).
Mice—This project was approved by The Animal Care Committee of University of Tsukuba and performed under its guidelines. The p21waf1/Cip1 knock-out mice (B6;129S2-Cdkn1atm1Tyj/J) were originally purchased from CLEA Japan Inc. and The Jackson Laboratory, provided by Dr. Tyler Jacks (20) and were backcrossed onto the C57BL/6J background within our colony for five or more generations. Mice were genotyped by PCR according to methods provided by The Jackson Laboratory. Mice were maintained on a normal chow diet for a 14-h light/10-h dark cycle. For diet-induced obesity, the mice were fed on a high fat high sucrose (HFHS) diet as previously described (21) at 10 weeks of age for 6 (or indicated) weeks. We performed weekly collections of blood for metabolic analysis (measurement of blood glucose, insulin, triglyceride, total cholesterol, and free fatty acid) and measured body weight. They were subjected to intravenous glucose tolerance tests 4 weeks after the HFHS diet started, insulin tolerance tests 5 weeks after the diet started, dual energy x-ray absorptiometry (DEXA) analysis, and sacrifice at 6 weeks. Tissue samples were fixed in 10% formalin for microscopy analysis and preserved in liquid N2 for the Northern blot analysis.
DEXA Analysis—PIXImus2 DEXA (GE Medical Systems LUNAR) was used to measure lean body tissue and percent fat mass (22).
Determination of Adipocyte Number and Size—Epididymal fat pads from normal mice (∼50 mg) and HFHS-fed mice (∼150 mg) were fixed in osmium tetroxide-collidine buffer for 3 days. Adipocytes of diameter from 25 to 125 μm in normal mice or from 25 to 250 μm in HFHS mice were collected by filtration through 25-, 125-, and 250-μm nylon screens. Size and number of adipocytes were measured with a Z-2 Coulter counter for normal mice and a Multisizer 3 Coulter counter for HFHS mice (Beckman Coulter) as previously described (22-24).
Metabolic Studies—Glucose tolerance tests were performed on male mice fasted overnight (9-12 h). Glucose solutions were injected at 2 g/kg of body weight via tail vein. Blood glucose and insulin were measured 0, 5, 15, 30, and 60 min after injection. Insulin tolerance tests were performed on male mice fasted for 3 h. Mice were intraperitoneally injected with human regular insulin at 0.5 units/kg or 0.75 units/kg of body weight (Humulin R 40 units/ml, Eli Lilly), and blood glucose was measured 0-120 min after injection with ANTSENSE II (Horiba Ltd.). Plasma glucose, triglyceride, cholesterol, and non-esterfied fatty acids were determined with Glu ICII, TG IE, T-Cho IE, and non-esterfied fatty acid IC kits from WAKO. Plasma insulin and leptin were determined with the mouse insulin enzyme-linked immunosorbent assay (ELISA) kit (TMB) (AKRIN-011T, Shibayagi) and the mouse leptin ELISA kit (Morinaga Institute of Biological Science, Inc.), respectively.
Northern Blot Analysis—Total RNA was prepared from livers, white adipose tissue, brown adipose tissue, muscle, and cultured cells using TRIzol reagent (Invitrogen). For Northern blot analysis, equal aliquots of total RNA from 5-6 mice and culture cells were pooled (5-10 μg of total RNA), denatured with formaldehyde and formamide, subjected to electrophoresis in a 1% agarose gel, and transferred to Hybond N membranes (Amersham Biosciences) for hybridization. cDNA probes were labeled with [α-32P]dCTP (3,000-10,000 cpm) using Rediprime™ Random Prime Labeling System (Amersham Biosciences). The filters were hybridized with the radiolabeled probe in Rapid-hyb buffer (Amersham Biosciences) at 65 °C and washed in 0.1 × SSC, 0.1% SDS at 65 °C. Blots were exposed to Kodak BIOMAX MS1 (Eastman Kodak Co.) and BAS 2500 with BAStation software (Fuji Photo Film).
Cell Proliferation Assay—For determination of cell proliferation, a 5-bromo-2′-deoxyuridine labeling and detection kit I was used according to the manufacturer's instructions (Roche Applied Science).
Apoptosis Assay—For the assessment of apoptosis, the In Situ Cell Death Detection kit (Roche Applied Science) was used. The test principle of this kit was labeling DNA strand breaks by terminal deoxynucleotidyltransferase, which catalyzes the polymerization of labeled nucleotides to free 3′-OH DNA ends in a template-independent manner (TUNEL reaction).
Immunoblot Analysis—Cells were harvested in 1% Triton X-100 buffer (25 mm Hepes (pH 7.9), 50 mm KCl, 5 mm EDTA, 5 mm MgCl2, 1% Triton X-100, 1 mm dithiothreitol, and protease inhibitor (Roche Applied Science)). Protein concentrations were determined using the BCA protein assay kit (Pierce). Samples were fractionated on 8, 12, or 15% SDS-PAGE followed by transfer to Immobilon Transfer membranes (Millipore). Blots were subsequently incubated in Tris-buffered saline-Tween overnight at 4 °C with 1:2000 anti-p21waf1, anti-p27Kip1, anti-C/EBPα, anti-C/EBPβ, anti-p53 (Santa Cruz) Ser-15 phosphorylation of p53, Ser-20 phosphorylation of p53, Ser-46 phosphorylation of p53 (Cell Signaling), and α-tubulin (Calbiochem). After incubation with horseradish peroxidase-conjugated secondary antibodies, blots were detected by ECL or ECL Advance Western blotting detection kit (Amersham Biosciences).
In Vivo Adenovirus Injection into White Adipose Tissue—After 3 weeks of HFHS feeding, mice were anesthetized by halothane before tissue dissection. The adenovirus (2.5 × 10¹¹ optical particle unit) was injected on each side of the epididymal fat pad (25).
Statistical Analysis—Data are expressed as the mean ± S.E. Statistical significance was assessed using the Student's t test. Data sets involving more than two groups are assessed by Dunnett's test (SAS Institute Inc.).
RESULTS
Effects of the Acute Absence of p21 on Adipocyte Differentiation in Vitro—3T3-L1 fibroblasts were differentiated into adipocytes, and p21 expression was assessed. Consistent with previous works, there was a rapid induction of p21 protein at the time of differentiation into adipocytes (Fig. 1A) (3). Expression of p21 was sustained at both the mRNA and protein levels during terminal differentiation and during the subsequent hypertrophic phase of lipid accumulation. To determine the effects of acute p21 deficiency, knockdown of p21 using two different adenoviral vectors with RNAi (137i and 275i) before induction of differentiation was performed (Fig. 1B). p21 deficiency caused a dose-dependent suppression of adipocyte differentiation as assessed by Oil Red O staining (Fig. 1C). The inhibition of p21 resulted in no changes in p27 levels (Fig. 1D). However, reduction in p21 levels was accompanied by reduced levels of C/EBPα and PPARγ, transcription factors involved in adipocyte differentiation, along with adipsin, a marker for adipogenesis (Fig. 1E). However, C/EBPβ, known to function at an initial stage of adipogenesis was rather enhanced by p21 inhibition, suggesting that the absence of p21 might impair the later stage of adipocyte differentiation (Fig. 1E).
FIGURE 1.
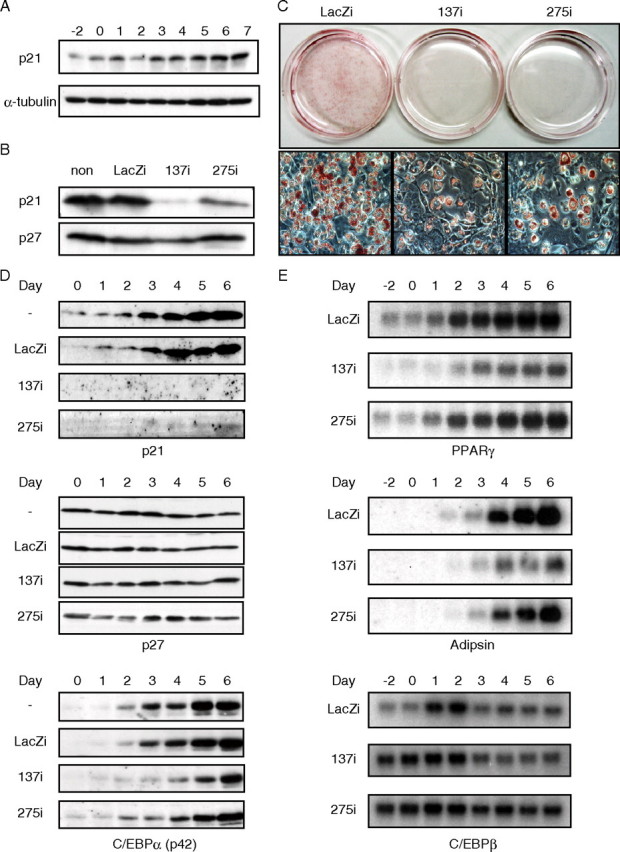
Inhibition of adipocyte differentiation in 3T3-L1 cells by knockdown of p21. A, changes of p21 protein in differentiating 3T3-L1 cells. Total cellular proteins were extracted from cells at the indicated days of differentiation and subjected to immunoblot analysis with antibodies against p21 and α-tubulin as a loading control. B, efficacy of p21 knockdown in 3T3-L1 preadipocytes infected with p21RNAi adenoviruses. Expression of p21 and p27 level is shown by immunoblotting 24 h after the infection of p21 RNAi adenovirus (137i or 275i) or LacZi adenovirus (LacZi) as a negative control. Note that 137i exhibits nearly complete suppression with a higher efficiency of p21 knockdown than 275i. C, effect of p21 gene knockdown on adipocytes differentiation. 3T3-L1 adipocytes were infected with adenoviruses at day 3. The Oil Red O staining of cells from day 6 post-differentiation induction is shown. D and E, time course analysis of protein (D) and mRNA (E) expression in 3T3-L1 cells after infection of p21 RNAi adenoviruses at day 3. Cellular total RNA (5 μg) and protein (80 μg) were subjected to SDS-PAGE followed by immunoblot analysis for p21, p27, and C/EBPα (D) and to Northern blot analysis for PPARγ, adipsin, and C/EBPβ (E), respectively.
Effects of the Chronic Absence of p21 during Adipocyte Differentiation in Vitro—To determine the effect of chronic absence of p21, mouse embryonic fibroblasts (MEFs) from p21-/- mice were induced to differentiate into adipocytes (supplemental Fig. A1). Before differentiation, p21-/- MEF cells exhibited an increased cell number and uptake of 5-bromo-2′-deoxyuridine as compared with p21+/+ control cells, indicating enhanced cell growth in the absence of p21 (supplemental Fig. A1, A and B). Upon induction of differentiation, p21-/- MEF cells began to differentiate sooner; however, at terminal differentiation the size of the resultant adipocytes was smaller than differentiated wild type p21+/+ MEFs (supplemental Fig. A1C). These data demonstrate that p21 contributes to, but is not indispensable, for adipocyte differentiation.
Metabolic Effects of the Chronic Absence of p21 in Vivo—Consistent with the results from cultured cells, adiposity of chow diet-fed p21-/- mice was normal. Growth curves were nearly identical between p21-/- and p21+/+ mice (supplemental Fig. A2A). Body weight, total fat weight (by DEXA), and adipocyte size did not significantly changed with only a minimal trend toward a decrease in p21-/- mice (supplemental Fig. A2, B and C, and A3, A-C). There were no significant changes in plasma glucose, insulin, lipids, or leptin levels (supplemental Table A1). Insulin sensitivity and secretion did not change in p21-/- mice as assessed by glucose and insulin tolerance tests (supplemental Fig. A2, D and E, and Table A1).
Next, the role of p21 in adipogenesis in diet-induced obesity was evaluated. Our preliminary data indicated that gene expression of p21 was highly induced by high fat diet, suggesting a role of this protein in the hypertrophic change of adipocytes (data not shown). When p21-/- mice were fed the HFHS diet, which rapidly induces obesity and insulin resistance, the degree of body weight gain was ameliorated compared with strain-matched C57BL/6 p21+/+ controls (Fig. 2A). The retarded body weight gain in p21-/- mice was due to decreased fat mass as estimated by DEXA (Fig. 2B). The weight of epididymal fat pads was also significantly decreased in p21-/- mice (Fig. 2C). Total fat weight of p21+/- mice was between those of p21+/+ and p21-/- mice, demonstrating the dose-dependent effect of p21 on adiposity (Fig. 2B). The size distribution of adipocytes from the epididymal adipose tissue, as estimated by a Coulter counter, also confirmed a significant decrease in the size of p21-/- adipocytes (Fig. 2D). Consistently, histological analysis of adipose tissue demonstrated that the marked enlargement of adipocytes in HFHS-fed mice was suppressed in p21-/- mice (Fig. 2E). The presence of large lipid vacuoles, which emerged in the cytosol of brown fat cells of HFHS diet-fed p21+/+ mice, was decreased in p21-/- mice (Fig. 2F). In fact, brown adipose tissue of p21-/- mice fed HFHS diets appeared similar to p21+/+ mice on a chow diet (compare Fig. 2F and supplemental Fig. A3D).
FIGURE 2.
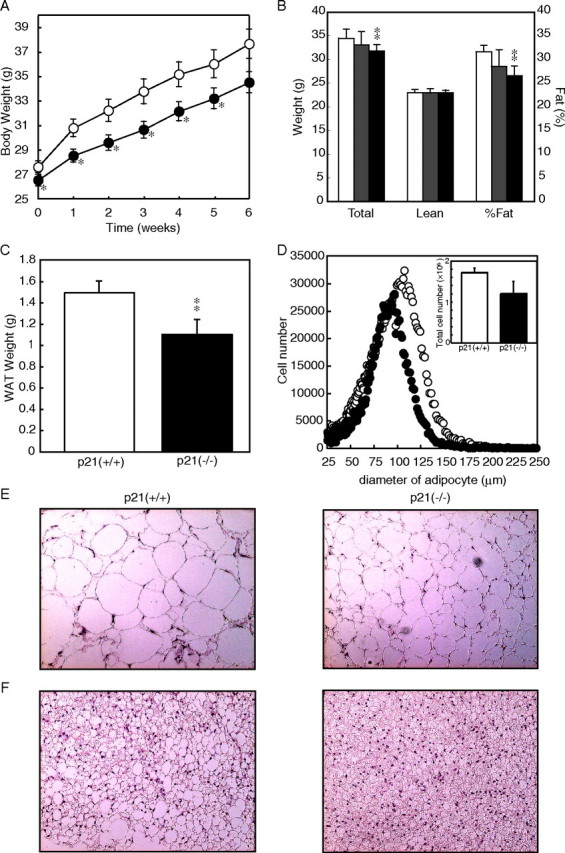
Prevention of diet-induced obesity in p21-/- mice. p21+/+, p21+/-, and p21-/- mice were placed on a high fat and high sucrose (HFHS) diet at 10 weeks of age for a total of 6 weeks. A, body weight curves on a HFHS diet. B, total and lean mass and % fat in p21+/+ (white bars), p21+/- (gray bars), and p21-/- (black bars) mice as estimated by DEXA. C, weight of epididymal fat pads in p21+/+ and p21-/- mice. WAT, white adipose tissue. D, size distribution and total cell number (inset) of adipocytes from white adipose tissue. E and F, microscopic examination of white (E) and brown (F) adipose tissues (hematoxylin/eosin stain). Values represent the means ± S.E. from 14 mice per group. p < 0.05 (*) and at p < 0.01 (**) for p21-/- compared with p21+/+ groups.
The amelioration of obesity was accompanied by marked improvement of insulin resistance (Fig. 3). Improved insulin sensitivity in HFHS-fed p21-/- mice was supported by decreased plasma insulin levels despite similar or slight trends of decreasing plasma glucose levels in fasted and fed conditions and in intravenous glucose tolerance tests (supplemental Table A2, Fig. 3, A and B). Insulin tolerance tests showed a more prominent decrease in plasma glucose levels after injection of insulin in p21-/- mice than in control mice (Fig. 3B). These data indicate that gene disruption of p21 causes a partial protection from diet-induced obesity and a marked improvement in insulin resistance. This protection from diet-induced obesity was not due to differences in food intake (2.95 ± 0.10 versus 2.86 ± 0.05 g/day for p21+/+ and p21-/- mice, respectively; n = 6; data were collected over a 4-week period).
FIGURE 3.
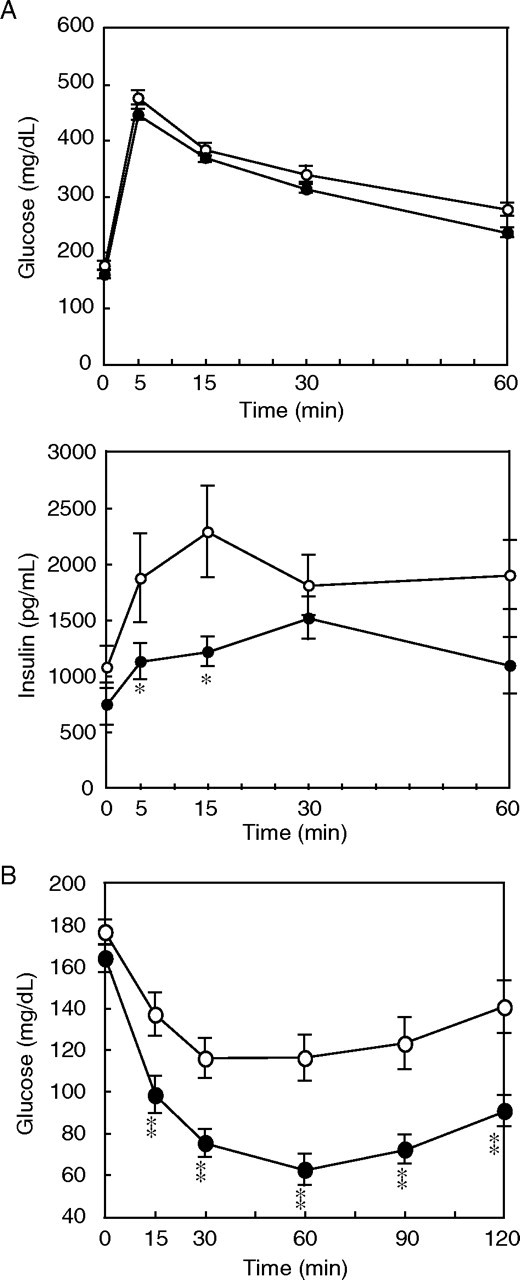
Protection of p21-/- mice from insulin resistance caused by diet-induced obesity. Glucose tolerance test (A) and insulin tolerance test (B) on p21+/+ (whitecircles) and p21-/- mice (blackcircles). Mice were fed the HFHS diet for 4 weeks and injected with 2 mg/kg d-glucose (A) or 0.75 units/kg insulin for 5 weeks under the HFHS diet condition (B). The panels show serum glucose concentration (upper panel of A and B) and insulin concentration (lower panel of A) at the indicated time (min). Values represent the means ± S.E. from 14 mice per group. p < 0.05 (*) and at p < 0.01 (**) for p21-/- compared with p21+/+ groups.
Gene Expression in Metabolic Tissues of p21-/- Mice—Expression of various genes in white adipose tissue of HFHS-fed p21+/+ and p21-/- mice were estimated by Northern blot analysis (Fig. 4A). Adipogenic transcription factors such as PPARγ, C/EBPα, and C/EBPβ were not different between p21+/+ and p21-/- mice. Expression of leptin and ADRP, known to be up-regulated in white adipose tissue in obesity, was suppressed in p21-/- mice on a HFHS diet, whereas adipsin, known to be suppressed in obesity, was up-regulated in p21-/- adipose tissues to varying degrees. As estimated by reverse transcription-PCR (supplemental Fig. A5A), decreased leptin and increased adiponectin were observed, consistent with amelioration of obesity in p21-/- mice on a HFHS diet (supplemental Fig. A5A). Expression of monocyte chemoattractant protein 1 and tumor necrosis factor α was also decreased, indicating that macrophage infiltration could be suppressed by the absence of p21 (supplemental Fig. A5B). PGC1α in brown adipose tissue, SCD-1 in the liver, and PPARδ in skeletal muscle are all known to be involved in energy consumption. These genes were decreased in diet-induced obesity in p21+/+ mice, and their levels were normalized in p21-/- mice, indicating a shift of energy balance toward to expenditure (Fig. 4B).
FIGURE 4.
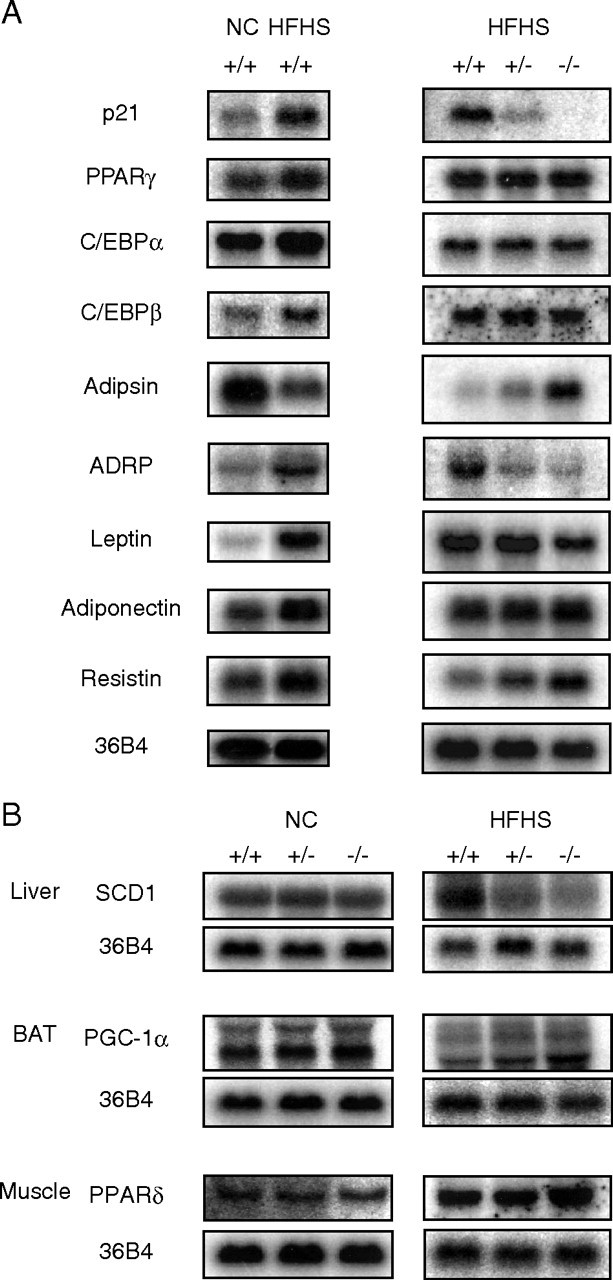
Gene expression of p21-/- mice on a HFHS diet. A, Northern blot analysis in epididymal fat pads in p21+/+ and p21-/- mice fed a HFHS diet for 6 weeks. Left panel, p21+/+ mice on a normal chow (NC) diet as a control and HFHS diet. Right panel, p21+/+, p21+/-, and p21-/- mice on a HFHS diet for 6 weeks. B, Northern blot analysis of livers, blown adipose tissues (BAT) and skeletal muscles in p21 knock-out mice was shown. Left panel, p21+/+, p21+/-, and p21-/- mice on a normal chow diet as a control. Right panel, p21+/+, p21+/-, and p21-/- mice fed a HFHS diet for 6 weeks. All mice were sacrificed at fasted state for 12 h. Total RNA was extracted from the organs of six mice. Equal aliquots of the RNA samples were pooled for each organ (10 μg) and subjected to Northern blot analysis for hybridization with the indicated cDNA probes (36B4 as a loading control).
Potential Involvement of Apoptosis in Mechanisms by Which p21 Deficiency Protects against Diet-induced Obesity—To determine the mechanism by which the absence of p21 protects against diet-induced obesity and insulin resistance, p21 was suppressed in 3T3-L1 cells after they had already differentiated into mature adipocytes. In contrast to infection of adenoviral RNAi before the differentiation protocol (Fig. 1, C-E), acute suppression of p21 at day 6 caused inhibition of lipid accumulation, detachment of the lipid-containing cells, and a marked change in color of the medium (Fig. 5A). TUNEL staining confirmed that these changes significantly involve apoptosis (Fig. 5, B and C). Supporting these observations, immunoblot analysis indicated that inhibition of p21 was followed by a time-dependent induction of caspase-3, the terminal player of apoptosis, but no change in expression of Bcl-2, a gene that plays a protective role from apoptosis (Fig. 6B). p53 phosphorylated at Ser-46, associated with apoptosis (26), was induced at day 8, 48 h after infection with p21RNAi adenovirus (Fig. 6B). These data suggest that p21 inhibition during the terminal differentiation of adipocytes could induce apoptosis, suppressing the hypertrophic changes required for completion of differentiation. p53, the most potent inducer of p21, is known to be activated in response to cellular stresses. p53 protein has been detected in 3T3-L1 cells and remains constant during intracellular accumulation of lipids in Fig. 6A, consistent with the previous report (27, 28). However, phosphorylation of p53 protein at Ser-15 and Ser-20 is the key process for p21 trans-activation (29, 30). In accordance with p21 induction, the phosphorylation of these sites was elevated during the adipocyte differentiation. In contrast, phosphorylation of p53 at Ser-46 was reported to be associated with apoptosis (26). This apoptosis-related change of p53 was induced at the late stage of differentiation in the 3T3-L1 adipocytes after the Ser-15 and Ser-20 phosphorylation (Fig. 6A).
FIGURE 5.
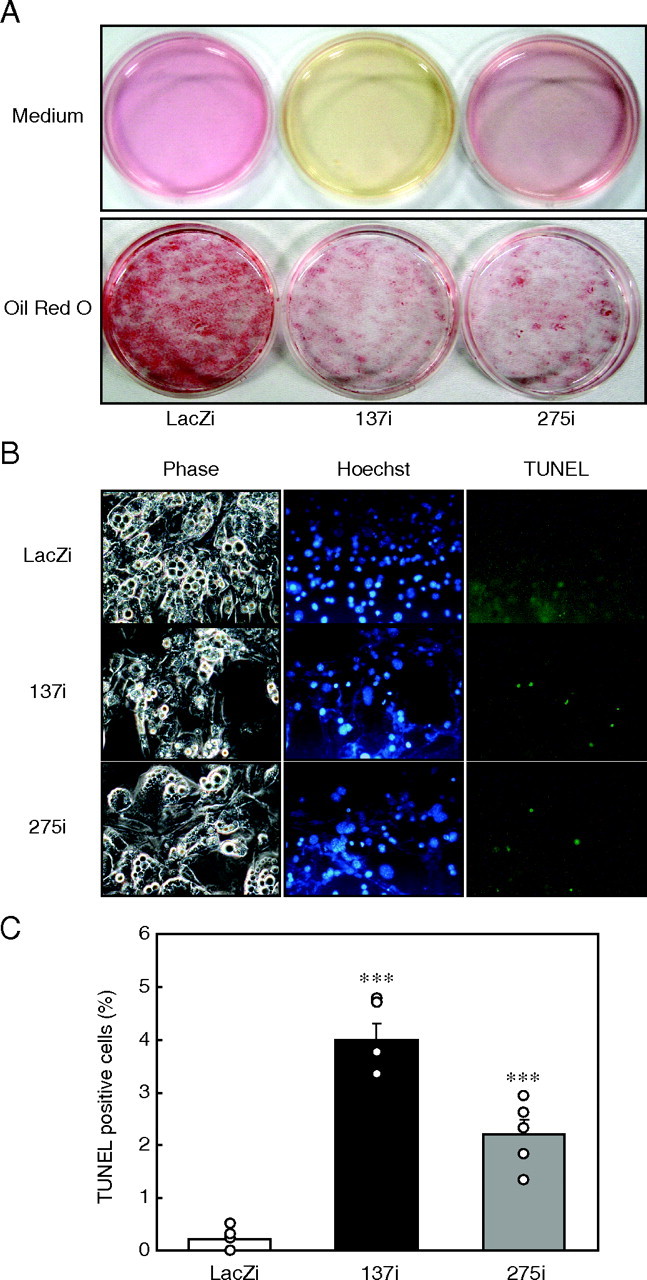
p21 gene knockdown induces apoptosis in 3T3-L1 adipocytes. A, 3T3-L1 cells were differentiated into adipocytes, and p21 RNAi adenovirus was infected at day 6. Media (upper panel) and Oil Red O staining of 3T3-L1 cells (lower panel) 4 days after infection of p21 RNAi (137i or 275i), or control LacZi adenovirus (day 10). B, apoptosis of 3T3-L1 adipocytes after p21 knockdown at day 10. Microscopic examinations of the cells with light phase contrast for morphology (phase (left)), Hoechst 33342 for nuclear staining (Hoechst (middle)), and TUNEL staining for apoptotic cells (TUNEL (right)) are shown at a magnification of ×400. C, emergence of apoptotic cells was determined by the ratio of TUNEL positive cells to Hoechst 33342-positive cells. Values represent the mean ± S.E. from six dishes per group. ***, at p < 0.0001 for 137i and 275i versus LacZi adenovirus-infected cells.
FIGURE 6.

Activation of caspase-3 by p21 knockdown in 3T3-L1 adipocytes after intrinsic activation of p21/p53. A, time-course changes of p53 and p21 activation in 3T3-L1 cells during adipocyte differentiation. 3T3-L1 fibroblasts were differentiated into adipocytes according to the standard protocol (see “Experimental Procedures”). The level of p53, p21 proteins, and phosphorylation (P) of p53 at Ser-15, Ser-20, and Ser-46 crucial for p21 transactivation were analyzed at the indicated days by immunoblot analysis. B, 3T3-L1 cells were induced to differentiate into adipocytes and infected with p21 RNAi adenovirus at day 6. Changes of p21, p53, Ser-46 phosphorylation of p53, caspase-3, Bcl-2, and α-tubulin (as a loading control) proteins in 3T3-L1 adipocytes at the indicated days after the induction for adipocyte differentiation were determined by immunoblot analysis.
To examine the involvement of apoptosis in the suppression of p21 in vivo, adenoviral RNAi for p21 was injected directly into epididymal adipose tissue of HFHS-fed mice. Significant inhibition of p21 expression was obtained 4 days after the infection (Fig. 7A), causing a trend to loss of body weight (Fig. 7B) accompanied by decreased glucose and insulin levels in insulin and glucose tolerance tests, respectively (Fig. 7, C and D). TUNEL staining demonstrated induction of adipocyte apoptosis by p21 knockdown (Fig. 7E). These data implicated that p21 could be induced by diet-induced obesity and contributes to protection from apoptosis during adipocyte hypertrophy.
FIGURE 7.
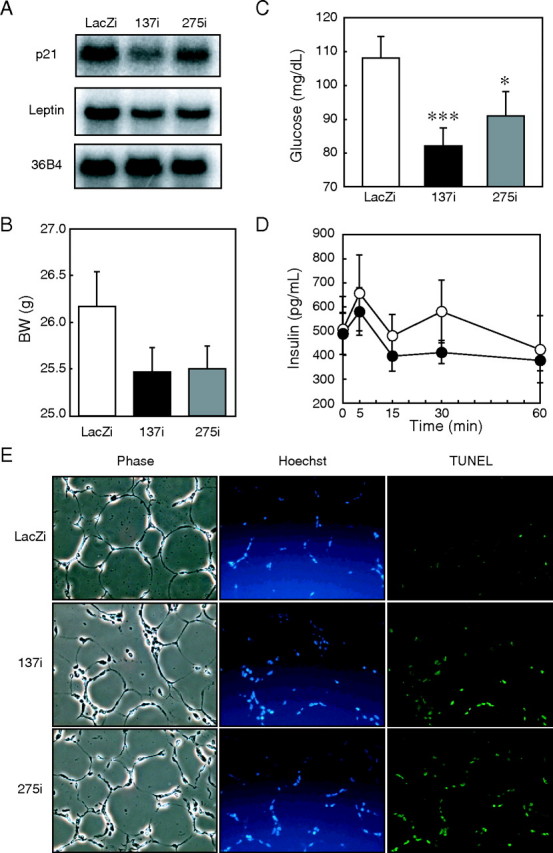
Local p21 knockdown in white adipose tissue from diet-induced obesity mice causes apoptosis. C57BL/6J mice (6 weeks of age) were fed a HFHS diet for 3 weeks. Adenoviral p21 RNAi (137i (black) or 275i (gray)) or LacZi (white) as a control was directly injected into epididymal white fat pads. After injection of adenovirus, these mice were fed a HFHS diet. Four days after the local infection, mice were sacrificed, and adipose tissues were collected. Total RNA of equally pooled aliquots (10 μg) extracted from the fat pads of six mice was subjected to Northern blot analysis for p21 and leptin (A). Body weights (BW), blood glucose concentrations 5 min after intraperitoneal injection of insulin 4 days after the local infection (C), and plasma insulin concentrations on an intravenous glucose tolerance test 6 days after the local infection (D) are shown in the diet-induced obesity mice after p21 knockdown in white adipose tissue (n = 12). Shown are TUNEL assays for apoptotic cells with light phase contrast microscopy and Hoechst 33342 staining for nuclear staining 4 days after the local infection (E). Values represent the means ± S.E. from 12 mice per group. p < 0.05 (*) and at p < 0.001 (***) for 137i and 275i versus LacZi adenovirus infected mice.
DISCUSSION
Role of p21 in Adipocyte Differentiation and Apoptosis—Our current study clearly demonstrates that p21 plays a crucial role in later stages of differentiation and hypertrophy of adipocytes. p21 is induced during adipogenesis and sustained during terminal differentiation. p21 knockdown experiments demonstrated that p21 contributes to but is not absolutely required for adipocyte differentiation. Emergence of vigorous apoptosis upon acute p21 knockdown during the terminal phase of 3T3-L1 differentiation and in hypertrophic adipose tissue during diet-induced obesity in mice reveals that p21 is crucial for adipocyte hypertrophy rather than for the initial stages of differentiation. In vivo, p21 was highly induced in enlarged adipose tissue of diet-induced obese mice, and its absence ameliorated obesity. In contrast to acute knockdown experiments of p21, apoptosis was not detected in adipose tissue from p21-/- mice on a HFHS diet or in p21-/- MEF throughout adipocyte differentiation (data not shown). We speculate that in the absence of p21, adipocytes might not become hypertrophic enough to cause apoptosis.
In normal physiology, it is conceivable that the increased accumulation of intracellular lipids, which occurs during differentiation, is a cellular stress to large adipocytes, leading to activation of the p53/p21 pathway. In this situation p21 might be required for survival of hypertrophic adipocytes. This potential of p21 is mediated through its anti-apoptotic actions rather than its growth arrest properties. It has long been speculated that adipocyte hypertrophy involves apoptosis (31, 32), but evidence of apoptosis was not appreciably observed. Our data provide evidence that in the presence of p21, hypertrophic adipocytes are relatively protected against apoptosis, possibly explaining this discrepancy.
Role of p53 in Sustained p21 Expression in Adipocytes—Previous studies have shown that the transcription factors Foxo1, SREBP-1c/ADD1, and C/EBP family are involved in adipocyte differentiation, and all three have strong transcriptional activity for the p21 promoter (4, 13, 33, 34). Each of these factors likely contributes to the induction of p21 during the initial stages of differentiation in normal adipocytes. Although expression of p53, a dominant regulator of p21, remains stable at both mRNA and protein levels during adipocyte differentiation, we found that Ser-15 and Ser-20 of p53, crucial sites for trans-activation of p21 (29, 35) were hyperphosphorylated during the later stages of differentiation. It can be speculated that sustained p21 expression during terminal differentiation or obesity-related activation is mediated through p53 activation. We previously observed that the p53/p21 pathway is activated in hypertrophied adipocytes, such as from leptin-deficient ob/ob mice, and also in fatty livers (15, 16). This is consistent with our current observation in adipose tissue of HFHS diet-induced obese mice. p53 is the key sensor of indications of cellular stress such as DNA damage and ultimately determines whether the cell will go through cell growth arrest or apoptosis. p21 is an established cell cycle arrest inducer but has been also implicated to be involved in inhibition of apoptosis (12). In 3T3L1 adipocytes, p53 activation, as indicated by phosphorylation at Ser-15 and Ser-20, could result from lipid accumulation. Furthermore, phosphorylation of p53 at Ser-46 at the later stage of differentiation indicated the potential risk of apoptosis (26) that was masked by p21. Our current data suggest that hypertrophic adipocytes in obesity are also under considerable stress and are vulnerable to apoptosis, which under normal conditions, could be inhibited by activation of p21. Thus, we postulate that p21 plays a role in adipogenesis by halting cell cycle but, more importantly, by preventing the apoptosis of hypertrophic adipocytes.
Effect of p21 on Obesity and Insulin Resistance—Of clinical relevance, amelioration of high fat diet-induced obesity in p21-/- mice was associated with improved insulin sensitivity. Adiposity in p21-/- mice was originally reported to be slightly increased as estimated by epididymal fat pads (22). The cause of this discrepancy with our data is currently unknown; however, we speculate that it could be strain and/or sex differences in which we used male p21-/- mice backcrossed to C57BL6 versus the original work on female mice on the undescribed back ground. We presume that p21 in adipocytes plays the major role in obesity and insulin resistance since even partial knockdown of p21 in epididymal fat pads effectively reproduced the apoptosis and decreased the size of adipocytes as observed in p21-/- mice on HFHS diet. Because decreased size of adipose tissue was associated with reduction in monocyte chemoattractant protein 1 and tumor necrosis factor α expression (supplemental Fig. A5B), macrophage infiltration and subsequent proinflammatory responses in obesity were suppressed in p21-/- mice. The absence of p21 in macrophages could contribute to inhibition of inflammation in adipose tissues as reported in atherosclerosis (36). There were only mild changes in the expression of genes related to energy metabolism in liver and skeletal muscle of p21-/- mice on HFHS diet, indicating that they are not the primary organs responsible for anti-obesity in the absence of p21. It should be noted that in brown adipose tissue, PGC1α was slightly restored in p21-/- mice. Diet-induced obesity is usually accompanied by fat accumulation and decreased burning function in this tissue (6), which was prevented in HFHS-fed p21-/- mice Considering the similar food intake between p21+/+ and p21-/- mice, it is possible that p21 deficiency contributed to amelioration of diet-induced obesity and insulin resistance at least partially by restoring the fat-burning function of brown fat tissue.
A New Link between Cell Growth and Metabolism—Our study provides evidence that factors responsible for the regulation of cell growth and survival are also involved in metabolism. A recent report on a direct interaction between p21 and Akt substantiates this novel link between a CDK inhibitor and metabolism (37). The p53/p21 pathway might play a determining role in the fate of hypertrophic adipocytes in situations of excess energy. In the context of obesity-related diseases including insulin resistance and diabetes, inhibition of p21 in adipocytes might have a therapeutic effect by suppressing adipose tissue expansion. However, it is also possible p21-mediated adipocyte differentiation is important for proper storage of excess lipids in adipose tissue, thereby protecting against ectopic lipid storage and insulin resistance. Further studies are needed to clarify the precise mechanism by which p53/p21 pathway is regulated and involved in obesity and insulin resistance in adipose tissue. Recent reports on another CDK inhibitor, p27, as well as Skp2, the F-box protein that controls ubiquitin-mediated degradation of p27, implicates the Skp2/p27 pathway in determining the cell number of adipocytes and pancreatic β cells (5, 22, 38-40). Mice that lack CDK4 develop insulin-dependent diabetes as a result of a reduction in islet mass, whereas deletion of p27 ameliorates hyperglycemia in diabetic mice by maintaining compensatory islet hyperplasia and hyperinsulinemia, suggesting that these factors are involved in cell cycle regulation and could also play a role in β cell mass and function (38, 41). However, p21 did not have a significant impact on β cell function in our study (supplemental Table A3) as recently reported (42). Taken together, these data implicate p21 in controlling adipocyte cell size and p27 in determining cell number, reflecting distinct regulations and adipose tissue growth by both of the major CDK inhibitors.
In conclusion, our data demonstrate that p21 plays dual roles in both adipocyte differentiation through cell cycle arrest and in adipocyte hypertrophy through its anti-apoptotic action. Via these mechanisms mutually connected, p21 supports adipose tissue expansion during obesity linking to insulin resistance. Our data suggest that a cell cycle regulator can be involved in a wide range of physiology and pathophysiology in adipocytes, providing a new link between cell growth and metabolism.
Supplementary Material
Acknowledgments
We are grateful to Drs. Hiroshi Sakaue and Takehiro Nakamura for analysis of adipocyte cell size by Coulter counter. We thank Yuko Tamai for management of mice.
This research was supported in part by Grant-in-Aid for Scientific Research and Scientific Research on Priority Areas, 2006, 1805200 from the Ministry of Education, Science, Sports, and Culture. The costs of publication of this article were defrayed in part by the payment of page charges. This article must therefore be hereby marked “advertisement” in accordance with 18 U.S.C. Section 1734 solely to indicate this fact.
The on-line version of this article (available at http://www.jbc.org) contains supplemental Figs. A1-A5 and Tables A1-A3.
Footnotes
The abbreviations used are: CDK, cyclin-dependent kinase; RNAi, RNA-mediated interference; MEF, mouse embryonic fibroblast; HFHS, high fat high sucrose; PPAR, peroxisome proliferator-activated receptor; DEXA, dual energy x-ray absorptiometry; TUNEL, terminal dUTP nick-end labeling; C/EBP, CCAAT/enhancer-binding protein.
References
- 1.Gregoire, F. M., Smas, C. M., and Sul, H. S. (1998) Physiol. Rev. 78783 -809 [DOI] [PubMed] [Google Scholar]
- 2.Rosen, E. D., and Spiegelman, B. M. (2000) Annu. Rev. Cell Dev. Biol. 16 145-171 [DOI] [PubMed] [Google Scholar]
- 3.Morrison, R. F., and Farmer, S. R. (1999) J. Biol. Chem. 27417088 -17097 [DOI] [PubMed] [Google Scholar]
- 4.Nakae, J., Kitamura, T., Kitamura, Y., Biggs, W. H., III, Arden, K. C., and Accili, D. (2003) Dev. Cell 4 119-129 [DOI] [PubMed] [Google Scholar]
- 5.Sakai, T., Sakaue, H., Nakamura, T., Okada, M., Matsuki, Y., Watanabe, E., Hiramatsu, R., Nakayama, K., Nakayama, K. I., and Kasuga, M. (2007) J. Biol. Chem. 2822038 -2046 [DOI] [PubMed] [Google Scholar]
- 6.Spiegelman, B. M., and Flier, J. S. (2001) Cell 104531 -543 [DOI] [PubMed] [Google Scholar]
- 7.Harper, J. W., Adami, G. R., Wei, N., Keyomarsi, K., and Elledge, S. J. (1993) Cell 75 805-816 [DOI] [PubMed] [Google Scholar]
- 8.el-Deiry, W. S., Tokino, T., Velculescu, V. E., Levy, D. B., Parsons, R., Trent, J. M., Lin, D., Mercer, W. E., Kinzler, K. W., and Vogelstein, B. (1993) Cell 75 817-825 [DOI] [PubMed] [Google Scholar]
- 9.Xiong, Y., Hannon, G. J., Zhang, H., Casso, D., Kobayashi, R., and Beach, D. (1993) Nature 366701 -704 [DOI] [PubMed] [Google Scholar]
- 10.Noda, A., Ning, Y., Venable, S. F., Pereira-Smith, O. M., and Smith, J. R. (1994) Exp. Cell Res. 211 90-98 [DOI] [PubMed] [Google Scholar]
- 11.Hunter, T. (1993) Cell 75 839-841 [DOI] [PubMed] [Google Scholar]
- 12.Polyak, K., Waldman, T., He, T. C., Kinzler, K. W., and Vogelstein, B. (1996) Genes Dev. 101945 -1952 [DOI] [PubMed] [Google Scholar]
- 13.Inoue, N., Shimano, H., Nakakuki, M., Matsuzaka, T., Nakagawa, Y., Yamamoto, T., Sato, R., Takahashi, A., Sone, H., Yahagi, N., Suzuki, H., Toyoshima, H., and Yamada, N. (2005) Mol. Cell. Biol. 258938 -8947 [DOI] [PMC free article] [PubMed] [Google Scholar]
- 14.Shimomura, I., Hammer, R. E., Richardson, J. A., Ikemoto, S., Bashmakov, Y., Goldstein, J. L., and Brown, M. S. (1998) Genes Dev. 123182 -3194 [DOI] [PMC free article] [PubMed] [Google Scholar]
- 15.Yahagi, N., Shimano, H., Matsuzaka, T., Najima, Y., Sekiya, M., Nakagawa, Y., Ide, T., Tomita, S., Okazaki, H., Tamura, Y., Iizuka, Y., Ohashi, K., Gotoda, T., Nagai, R., Kimura, S., Ishibashi, S., Osuga, J., and Yamada, N. (2003) J. Biol. Chem. 27825395 -25400 [DOI] [PubMed] [Google Scholar]
- 16.Yahagi, N., Shimano, H., Matsuzaka, T., Sekiya, M., Najima, Y., Okazaki, S., Okazaki, H., Tamura, Y., Iizuka, Y., Inoue, N., Nakagawa, Y., Takeuchi, Y., Ohashi, K., Harada, K., Gotoda, T., Nagai, R., Kadowaki, T., Ishibashi, S., Osuga, J., and Yamada, N. (2004) J. Biol. Chem. 27920571 -20575 [DOI] [PubMed] [Google Scholar]
- 17.Ide, T., Shimano, H., Yahagi, N., Matsuzaka, T., Nakakuki, M., Yamamoto, T., Nakagawa, Y., Takahashi, A., Suzuki, H., Sone, H., Toyoshima, H., Fukamizu, A., and Yamada, N. (2004) Nat. Cell Biol. 6351 -357 [DOI] [PubMed] [Google Scholar]
- 18.Nakagawa, Y., Shimano, H., Yoshikawa, T., Ide, T., Tamura, M., Furusawa, M., Yamamoto, T., Inoue, N., Matsuzaka, T., Takahashi, A., Hasty, A. H., Suzuki, H., Sone, H., Toyoshima, H., Yahagi, N., and Yamada, N. (2006) Nat. Med. 12 107-113 [DOI] [PubMed] [Google Scholar]
- 19.Okazaki, H., Osuga, J., Tamura, Y., Yahagi, N., Tomita, S., Shionoiri, F., Iizuka, Y., Ohashi, K., Harada, K., Kimura, S., Gotoda, T., Shimano, H., Yamada, N., and Ishibashi, S. (2002) Diabetes 513368 -3375 [DOI] [PubMed] [Google Scholar]
- 20.Brugarolas, J., Chandrasekaran, C., Gordon, J. I., Beach, D., Jacks, T., and Hannon, G. J. (1995) Nature 377552 -557 [DOI] [PubMed] [Google Scholar]
- 21.Maeda, N., Shimomura, I., Kishida, K., Nishizawa, H., Matsuda, M., Nagaretani, H., Furuyama, N., Kondo, H., Takahashi, M., Arita, Y., Komuro, R., Ouchi, N., Kihara, S., Tochino, Y., Okutomi, K., Horie, M., Takeda, S., Aoyama, T., Funahashi, T., and Matsuzawa, Y. (2002) Nat. Med. 8731 -737 [DOI] [PubMed] [Google Scholar]
- 22.Naaz, A., Holsberger, D. R., Iwamoto, G. A., Nelson, A., Kiyokawa, H., and Cooke, P. S. (2004) FASEB J. 181925 -1927 [DOI] [PubMed] [Google Scholar]
- 23.Hirsch, J., and Gallian, E. (1968) J. Lipid Res. 9110 -119 [PubMed] [Google Scholar]
- 24.Cushman, S. W., and Salans, L. B. (1978) J. Lipid Res. 19269 -273 [PubMed] [Google Scholar]
- 25.Yamada, T., Katagiri, H., Ishigaki, Y., Ogihara, T., Imai, J., Uno, K., Hasegawa, Y., Gao, J., Ishihara, H., Niijima, A., Mano, H., Aburatani, H., Asano, T., and Oka, Y. (2006) Cell Metab. 3 223-229 [DOI] [PubMed] [Google Scholar]
- 26.Oda, K., Arakawa, H., Tanaka, T., Matsuda, K., Tanikawa, C., Mori, T., Nishimori, H., Tamai, K., Tokino, T., Nakamura, Y., and Taya, Y. (2000) Cell 102849 -862 [DOI] [PubMed] [Google Scholar]
- 27.Berberich, S. J., Litteral, V., Mayo, L. D., Tabesh, D., and Morris, D. (1999) Differentiation 64 205-212 [DOI] [PubMed] [Google Scholar]
- 28.Constance, C. M., Morgan, J. I. T., and Umek, R. M. (1996) Mol. Cell. Biol. 163878 -3883 [DOI] [PMC free article] [PubMed] [Google Scholar]
- 29.Shieh, S. Y., Ahn, J., Tamai, K., Taya, Y., and Prives, C. (2000) Genes Dev. 14 289-300 [PMC free article] [PubMed] [Google Scholar]
- 30.Craig, A. L., Blaydes, J. P., Burch, L. R., Thompson, A. M., and Hupp, T. R. (1999) Oncogene 186305 -6312 [DOI] [PubMed] [Google Scholar]
- 31.Okuno, A., Tamemoto, H., Tobe, K., Ueki, K., Mori, Y., Iwamoto, K., Umesono, K., Akanuma, Y., Fujiwara, T., Horikoshi, H., Yazaki, Y., and Kadowaki, T. (1998) J. Clin. Investig. 1011354 -1361 [DOI] [PMC free article] [PubMed] [Google Scholar]
- 32.Prins, J. B., Niesler, C. U., Winterford, C. M., Bright, N. A., Siddle, K., O'Rahilly, S., Walker, N. I., and Cameron, D. P. (1997) Diabetes 461939 -1944 [DOI] [PubMed] [Google Scholar]
- 33.Cram, E. J., Ramos, R. A., Wang, E. C., Cha, H. H., Nishio, Y., and Firestone, G. L. (1998) J. Biol. Chem. 2732008 -2014 [DOI] [PubMed] [Google Scholar]
- 34.Gartel, A. L., and Tyner, A. L. (1999) Exp. Cell Res. 246280 -289 [DOI] [PubMed] [Google Scholar]
- 35.Ashcroft, M., Kubbutat, M. H., and Vousden, K. H. (1999) Mol. Cell. Biol. 191751 -1758 [DOI] [PMC free article] [PubMed] [Google Scholar]
- 36.Merched, A. J., and Chan, L. (2004) Circulation 1103830 -3841 [DOI] [PubMed] [Google Scholar]
- 37.Heron-Milhavet, L., Franckhauser, C., Rana, V., Berthenet, C., Fisher, D., Hemmings, B. A., Fernandez, A., and Lamb, N. J. (2006) Mol. Cell. Biol. 268267 -8280 [DOI] [PMC free article] [PubMed] [Google Scholar]
- 38.Uchida, T., Nakamura, T., Hashimoto, N., Matsuda, T., Kotani, K., Sakaue, H., Kido, Y., Hayashi, Y., Nakayama, K. I., White, M. F., and Kasuga, M. (2005) Nat. Med. 11 175-182 [DOI] [PubMed] [Google Scholar]
- 39.Auld, C. A., and Morrison, R. F. (2006) Obesity (Silver Spring) 142136 -2144 [DOI] [PubMed] [Google Scholar]
- 40.Auld, C. A., Hopkins, R. G., Fernandes, K. M., and Morrison, R. F. (2006) Biochem. Biophys. Res. Commun. 346314 -320 [DOI] [PubMed] [Google Scholar]
- 41.Rane, S. G., Dubus, P., Mettus, R. V., Galbreath, E. J., Boden, G., Reddy, E. P., and Barbacid, M. (1999) Nat. Genet. 2244 -52 [DOI] [PubMed] [Google Scholar]
- 42.Cozar-Castellano, I., Haught, M., and Stewart, A. F. (2006) Diabetes 553271 -3278 [DOI] [PubMed] [Google Scholar]
Associated Data
This section collects any data citations, data availability statements, or supplementary materials included in this article.