
Figure 3.
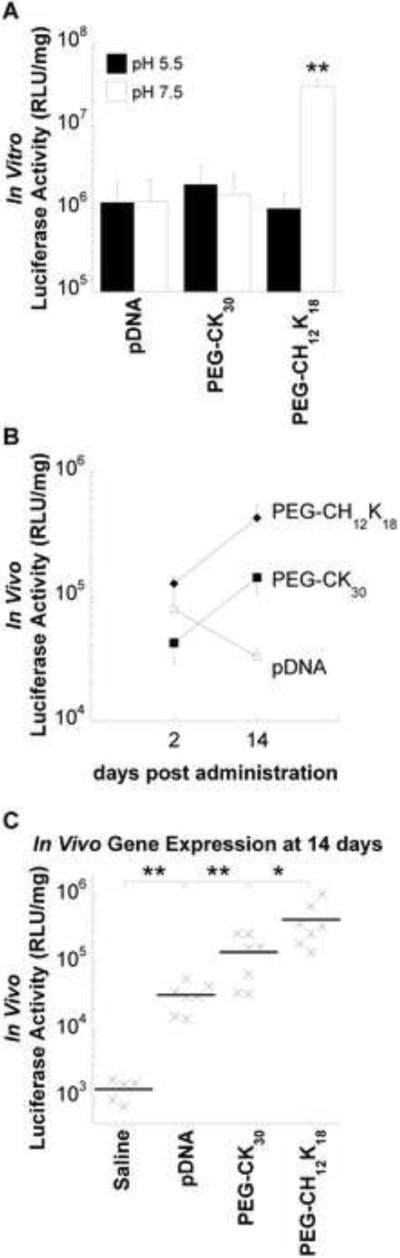
Gene transfer efficiency. (A) In vitro transfection of luciferase gene to BEAS-2B cells by DNA nanoparticles formulated at pH 5.5 or 7.5. BEAS-2B cells were incubated with DNA nanoparticles in medium containing 10% serum for 6 h, followed by an additional 42 h incubation without DNA nanoparticles. Data represents the mean +/− SD. * denotes statistical significance (** P < 0.001, Tukey HSD) as compared to all other groups. (B) Time course of in vivo gene expression. BALB/c mice received 80 μg compacted (formulated at pH 7.5) or naked pBAL DNA in saline by oropharyngeal aspiration. Luciferase activity in lung homogenates was measured at 2 days (n = 4) or 14 days (n = 7) after pulmonary administration. Data represents the mean +/− SEM. (C) In vivo gene expression at 14 days after pulmonary administration. Control mice (n=5) received saline alone. * denotes statistical significance (* P < 0.05, ** P < 0.001, Tukey HSD). pDNA, plasmid DNA; RLU, relative light unit.