Abstract
The first three-dimensional (3D) pharmacophore model was developed for potent retinoidal retinoic acid metabolism blocking agents (RAMBAs) with IC50 values ranging from 0.0009 to 5.84 nM. The seven common chemical features in these RAMBAs as deduced by the Catalyst/HipHop program include five hydrophobic groups (hydrophobes), one hydrogen bond acceptor (HBA) and one ring aromatic group. Using the pharmacophore model as a 3D search query against NCI and Maybridge conformational Catalyst formatted databases; we retrieved several compounds with different structures (scaffolds) as hits. Twenty one retrieved hits were tested for RAMBA activity at 100 nM concentration. The most potent of these compounds, NCI10308597 and HTS01914 showed inhibitory potencies less (54.7% and 53.2%, respectively, at 100 nM) than those of our best previously reported RAMBAs VN/12-1 and VN/14-1 (90% and 86%, respectively, at 100 nM). Docking studies using a CYP26A1 homology model revealed that our most potent RAMBAs showed similar binding to the one observed for a series of RAMBAs reported previously by others. Our data shows the potential of our pharmacophore model in identifying structurally diverse and potent RAMBAs. Further refinement of the model and searches of other robust databases is currently in progress with a view to identifying and optimizing new leads.
Keywords: common feature based pharmacophore hypotheses, HipHop, retinoic acid metabolism blocking agents (RAMBAs), docking, quantitative structure-activity relationships, anti-cancer agents
1. Introduction
During the last 30 years, research into cancer treatment has focused mainly on the use and development of cytotoxic agents. However, despite significant progress in the chemotherapy of some malignancies such as testicular carcinoma and lymphomas, the prognosis of patients with the most common invasive and metastatic tumors remains poor [2]. There is a clear need for new treatment approaches which ultimately may be met by novel ideas coming from recent advances in understanding the underlying biology of cancer. Cancer cells show various degrees of differentiation, and there normally is an inverse relation between the degree of cell differentiation and the clinical aggressiveness of a cancer [3].
However, certain chemicals (differentiating agents) are capable of redirecting the cells to the normal phenotype of morphologic maturation and loss of proliferative capacity. Consequently, differentiating agents may reverse or suppress evolving lesions to prevent cancer invasion [2, 4–6]. Differentiating agents thus offer an attractive potential alternative to conventional cytotoxic agents. One group, the retinoids, constitute a class of chemical compounds, including vitamin A and its synthetic and naturally occurring analogs, that have been the subject of extensive scientific and clinical investigations [4, 7, 8].
Retinoids, natural and synthetic analogues of all-tans-retinoic acid [9], play a key role in many biological functions, including induction of cellular proliferation, differentiation, and apoptosis, as well as developmental changes [10]. ATRA exerts its activity through binding with transcription-regulatory factors, known as the retinoic acid receptors (RAR), of which there are three subtypes; RARα, -β and -γ. ATRA and several synthetic retinoids are currently used in cancer differentiation therapy, cancer chemoprevention, and treatment of dermatological diseases [11, 12]. One of the most impressive effects of ATRA is on acute promyleocytic leukemia (APL). Treatment of many APL patients with high doses of ATRA has resulted in complete remission [13]. However, the clinical use of ATRA in the treatment of cancers is significantly hampered by the prompt emergence of resistance, which is believed to be caused at least in part by increased ATRA metabolism.
One of the strategies for preventing in vivo catabolism of ATRA is to inhibit the P450 enzyme(s) responsible for this process. Inhibitors of ATRA metabolism (also referred to as retinoic acid metabolism blocking agents (RAMBAs), may prove useful for the chemoprevention and/or treatment of various kinds of cancer [14, 15], and also for the treatment of various kinds of dermatological diseases [16, 17]. The major pathway of metabolic deactivation of ATRA starts with hydroxylation at C-4 to form 4-hydroxy-ATRA, which is then oxidized into 4-oxo-ATRA. 4-oxo-ATRA is further transformed into more polar metabolites [18]. The first and the rate limiting step in this process is catalyzed by a cytochrome P450 dependent 4-hydroxylase enzyme. Although several human CYPs have been shown to be capable of converting ATRA to more polar metabolites, there specificity for ATRA is generally moderate. Recently, while CYP2C8 was reported to be a major contributor to ATRA 4-hydroxylation in the human liver [19, 20], Marill et al [21] identified CYP3A7 to be the most active enzyme responsible for ATRA metabolism. In addition, CYP26 has been identified as the most dedicated ATRA 4-hydroxylase [22–26]. CYP26 recognizes only ATRA as its substrate, and its expression and/or activity can be induced by ATRA both in vitro and in vivo. In adult humans, CYP26 is expressed in several tissues, mainly in liver, adrenals, heart, and hypothalamus [27]. Perhaps of more significance of this work was the realization that a variety of human cancer cells and tumors have been shown to possess ATRA 4-hydroxylase activity [28–35]. Irrespective of the CYP isoenzyme(s) involved, increased metabolism of ATRA could generate a condition of retinoid [9] deficiency, which is implicated in cancers and dermatological diseases. Thus, agents that can prolong and intensify the action of endogenous ATRA by inhibiting ATRA metabolizing enzymes can be potentially used as clinical agents in the treatment of the aforementioned diseases.
Several categories of non-retinoidal RAMBAs have been reported in literature [14, 15, 17, 36–38], but only a few retinoidal RAMBAs, developed by our group, are known [15, 39, 40]. Our RAMBAs are considered are considered to be atypical, because in addition to being potent inhibitors of ATRA metabolism (CYP26 inhibitors that are able to enhance the antiproliferative action of ATRA), they also possess intrinsic potent cancer antiproliferative activities [15, 39–46].
The rational design of RAMBAs with novel scaffolds would be greatly helped by knowledge of the three-dimensional structure of the enzyme (CYP26). Although there is currently no crystal structure information on known RAMBAs bound to CYP 26, recent studies on a homology model of human retinoic acid metabolising enzyme (CYP26A1) has identified putative structurally and functionally important residues of the enzyme’s active/binding sites [47].
Because there is no molecular pharmacophore modeling studies on RAMBAs and also because of the exceptional potencies of our retinoidal RAMBAs, we considered it a worthy research endeavor to analyze our potent RAMBAs by three-dimensional quantitative-structure activity relationship (3D-QSAR) software program, Catalyst [48]. The hypotheses generation methods (HipHop and HypoGen) of the Catalyst software is one of the methods for rational drug design, which has been successfully applied in drug discovery research [39, 49–54] (for more comprehensive references lists see http://www.accelrys.com/references/rdd_pub.html).
Previously, we successfully employed pharmacophore perception strategy in the discovery of novel human CYP17 inhibitors [49] and androgen receptor down-regulating agents (ARDAs) [39]. The Catalyst program can be used to probe how ligands interact with a receptor/enzyme by evaluating chemical feature common to a set of active ligands (HipHop) [55] or by elucidating the correlation between activity and chemical binding features (HypoGen) [56]. The hypotheses generated may be used to estimate the biological activity of proposed target, allowing a rank ordering of synthetic priorities. In addition, the hypotheses generated may be used as three-dimensional queries to search databases of proprietary and/or commercially available compounds. These three-dimensional searches could identify novel chemical scaffold that might exhibit potent inhibition of the target enzyme. The large number of successful applications of 3D pharmacophore-base searching in medicinal chemistry clearly demonstrates its utility in the modern drug discovery paradigm [39, 49–54].
The HipHop algorithm finds common features pharmacophore models among a set of highly active compounds thus carrying out a ‘qualitative model’ without the use of activity data, which represents the essential 3D arrangement of functional groups common to a set of molecules for interacting with specific biological targets. As there is a high structural homology among the derivatives combined with narrow activity range, the HipHop method was used in this study. We believe that the common feature pharmacophore developed from the potent RAMBAs evaluated under the same assay condition could lead to the discovery of potent RAMBAs with novel scaffolds.
In this report, we present the development of the first pharmacophore models of RAMBAs using the Catalyst/HipHop module. Following evaluation of the generated models for selection of best hypo, we used the best hypotheses for database searching followed by pharmacological evaluation of hit molecules to identify new RAMBAs with non-retinoidal scafolds. Furthermore, we report docking results of some selective leads and hit molecules with CYP26A1 homology model.
2. Results and Discussion
2.1. Structures and Biological Activities of Training Set Compounds
Table 1 shows the structure of five compounds and their IC50 values for CYP26 (hamster liver microsomal assay) inhibition determined in our laboratory under the same assay conditions [40]. The range of CYP26 inhibition activity exhibited by these compounds was 0.009 – 5.84 nM. This range of inhibition activity (3 log units) and small set of molecules was not large enough to allow us to generate meaningful activity-based (predictive) pharmacophore models using Catalyst/HypoGen technology. However, on the assumption that the most active compounds bind in a similar fashion at the enzyme’s active site, we employed the Catalyst/HipHop approach to evaluate the common feature required for binding and the hypothetical geometries adopted by these ligands in their most active forms. Thus, a training set consisting of five of the most active RAMBA inhibitors (3–7; see Table 1) was submitted for pharmacophore model generation based on common chemical features.
Table 1.
Chemical structures of five training set moleculesa used to generate the common-feature (HipHop) Pharmacophore model.
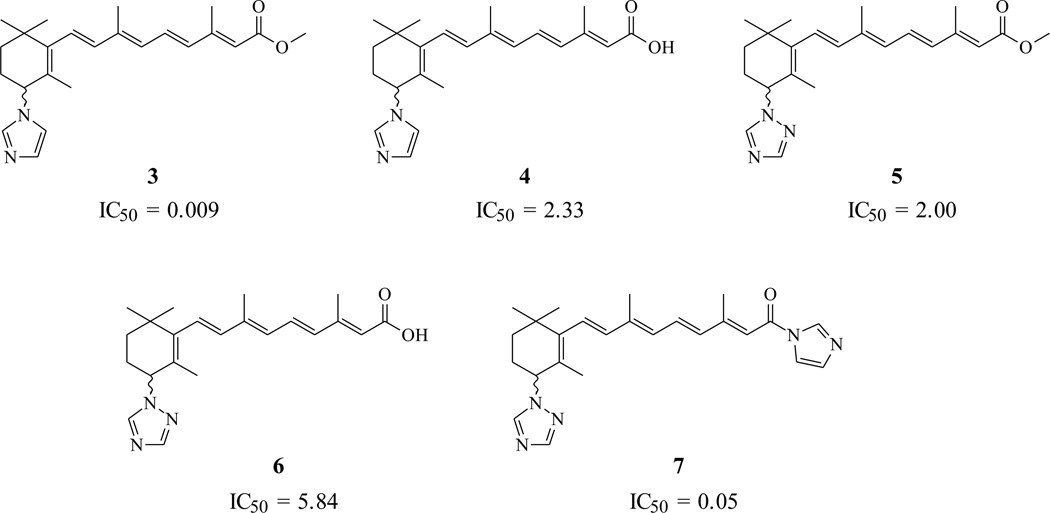 |
2.2. Pharmacophore Modeling
2.2.1. 3D Pharmacophore Generation
In the model generation methodology, the highest weighting was assigned to the most active compound in the training set (compound 3; IC50 0.009 nM), this was achieved by putting 2 (which ensures that all of the chemical features in the compound will be considered in building hypotheses space) and 0 (which forces mapping of all features of compound) in principle and maximum omitting features columns, respectively, for the most active compound, and 1 (ensures that at least one mapping for each of generated hypotheses will be found), 1 (all but one feature must map) in principle and maximum omitting feature column respectively for all other compounds (for a detailed description of these input parameters see the Catalyst 4.10 Tutorial: http://www.accelrys.com/doc/life/catalyst410/tutorials/cat410_tutsTOC.html) All other parameters were kept at default.
The 10 hypotheses (hypos) generated had scores from 86.87 to 90.62 (Table 2). This small range of ranking score suggests that the features are spatially arranged in a similar fashion in all 10 models. To determine the similarity between the ten hypotheses, a hierarchical cluster analysis was performed. The results of the cluster analysis indicate that hypos 1 and 6, 2 and 4, 3 and 8, and 7 and 10 belong to the same cluster, whereas hypos 5 and 9 are slightly different. All ten hypotheses contain seven features, of which five hydrophobic (H) features are common for all. Five hypotheses contain two hydrogen bond acceptors (HBAs) and the remaining five hypotheses contain one HBA and one ring aromatic (R) feature (Table 2). The cyclohexene ring and aliphatic polyene chain in the molecules are recognized as hydrophobic, and the acid and ester groups on the aliphatic polyene chain-end are recognized as hydrogen bond acceptors in all hypotheses. However, the heterocyclic ring on cyclohexene ring in all molecules is recognized as hydrogen bond acceptor in hypotheses 1, 3, 5, 6 and 8 and as ring aromatic in hypotheses 2, 4, 7, 9 and 10.
Table 2.
Summary of hypotheses run
| Hypo | Featurea | Rank | Direct it mask |
Partial hit mask |
|---|---|---|---|---|
| 1 | HHHHHAA | 90.62 | 11111 | 00000 |
| 2 | RHHHHHA | 90.32 | 11111 | 00000 |
| 3 | HHHHHAA | 90.16 | 11111 | 00000 |
| 4 | RHHHHHA | 89.57 | 11111 | 00000 |
| 5 | HHHHHAA | 89.38 | 11111 | 00000 |
| 6 | HHHHHAA | 88.66 | 11111 | 00000 |
| 7 | RHHHHHA | 87.91 | 11111 | 00000 |
| 8 | HHHHHAA | 87.88 | 11111 | 00000 |
| 9 | RHHHHHA | 87.55 | 11111 | 00000 |
| 10 | RHHHHHA | 86.87 | 11111 | 00000 |
Selection of the best hypotheses was performed using the Güner-Henry (GH) scoring method [57] as well as knowledge of the 3D structure of the ligand-enzyme interactions. GH scoring methodology has been successfully applied to quantification of model selectivity and coverage of activity space from database mining [58] and to the evaluation of the effectiveness of similarity search in databases containing both structural and biological activity data [59]. It is well known that all CYP enzymes contain heme as a prosthetic group, which is essential for their catalytic action. Functional groups such as hydrogen bond acceptors are known to act as the sixth ligating atom interaction with Fe (II) of heme in most CYP enzyme inhibitors. Considering the robust application of both the GH method and 3D structural information of ligand-enzyme interactions, we adapted these two criteria for selection of best hypo as described below.
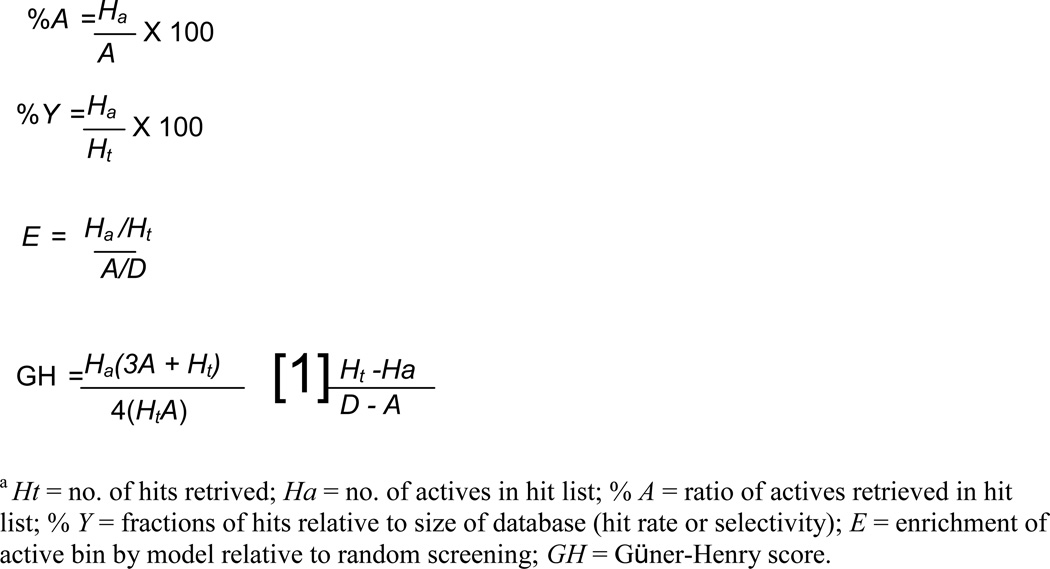
The GH analysis was done by computing the following variables: (a) the percent yield (% Y), which is a measure of the selectivity of the model, (b) the percent active (% A), which represents the coverage of activity space by the model, (c) the enrichment factor (E), and (d) the GH score. These variables (see Chart 2) are determined using information derived from the total number of compounds in the drug database (D), the number of actives in the database (A), the number of actives retrieved by the model (Ha), and the total number of hits retrieved by the model (Ht).
Chart 2.
Metrics for Analyzing Hit Lists in Pharmacophore-Based Modeling [62, 63].
2.2.2. Pharmacophore Selection and Validation
A text-based query using mechanism of action (MOA) in the search field was used to search for RAMBAs in the modified Derwent World Drug Index (WDI2003). Initially a Catalyst formatted database was created by combining five molecules of the training set and 1,000 molecules from the WDI2003 database with molecular weight range 360 – 420 (cut of MW range similar to the training set RAMBA molecules). This Catalyst formatted database of 1005 compounds was used to screen all ten hypotheses in order to evaluate the parameters - % A, % Y, E and GH score. The search results are shown in Table 3. On the basis of the GH analysis results, hypotheses #2, 4, 7, 9 and 10 with best GH score (0.784 – 1.0) and Enrichment factor (>140) were selected for further analysis. Additional pruning of these five hypotheses was based on the fit score of hypos with training set molecules (Table 4). Ideally, the best hypo should yield a fit score range that mimic the activity trend and the magnitude difference in activities. From the results of fit scores in Table 4, it is difficult to select the overall best hypo based on this analysis. However, hypos #2 and 4 show somewhat better fit scores than the others. These two hypos yield fit scores that correlate with activity trend for three out of the five RAMBAs in the training set; both hypos (#2 and #4) have similar functional features and are in the same cluster. Of the two hypos, #2 provided the overall better alignment with the RAMBA training set compounds (Figure 1a and 1b), than hypo #4. In addition, hypo #2 has the highest enrichment (201) and a perfect GH score, and hence was selected as the best hypothesis for the class of these RAMBA compounds.
Table 3.
Pharmacophore Model Evaluation based on the Güner-Henry Scoring Method [63, 69].
| Features | Ht | Ha | %A | %Y | E | GH | |
|---|---|---|---|---|---|---|---|
| Database | 1005 | 5 | 100.0 | 0.50 | 1.00 | 0.00 | |
| Hypo 1 | HHHHHAA | 12 | 5 | 100.0 | 41.67 | 83.8 | 0.559 |
| Hypo 2 | RHHHHHA | 5 | 5 | 100.0 | 100.00 | 201.0 | 1.000 |
| Hypo 3 | HHHHHAA | 18 | 4 | 80.0 | 22.22 | 44.7 | 0.362 |
| Hypo 4 | RHHHHHA | 6 | 5 | 100.0 | 83.33 | 167.5 | 0.874 |
| Hypo 5 | HHHHHAA | 18 | 5 | 100.0 | 27.78 | 55.8 | 0.452 |
| Hypo 6 | HHHHHAA | 15 | 5 | 100.0 | 33.33 | 67.0 | 0.495 |
| Hypo 7 | RHHHHHA | 6 | 5 | 100.0 | 83.33 | 167.5 | 0.874 |
| Hypo 8 | HHHHHAA | 18 | 5 | 100.0 | 27.78 | 55.8 | 0.452 |
| Hypo 9 | RHHHHHA | 7 | 5 | 100.0 | 71.43 | 143.6 | 0.784 |
| Hypo 10 | RHHHHHA | 6 | 5 | 100.0 | 83.33 | 167.5 | 0.874 |
Total number of compounds in Catalyst modified WDI2003 is 1005, and the total number of RAMBAs in this modified database (A) is 5. Ht = no. of hits retrieved; Ha = no. of actives in hit list; % A = ratio of actives retrieved in hit list; %Y = fraction of hits relative to size of database (hit rate of selectivity); E = enrichment of active bin by model relative to random screening; GH = Güner-Henry score.
Table 4.
Best fit values of five best hypotheses which retained after GH analysis
| Compd | Activity IC50 nM |
Confonc | Fit valued | ||||
|---|---|---|---|---|---|---|---|
| Hypo2 | Hypo 4 | Hypo 7 | Hypo9 | Hypo10 | |||
| 3 | 0.009a | 59 | 7.0 | 7.0 | 7.0 | 7.0 | 7.0 |
| 4 | 2.33a | 47 | 5.4 | 4.8 | 5.8 | 5.8 | 5.8 |
| 5 | 2.0a | 69 | 6.4 | 5.5 | 5.3 | 5.3 | 5.3 |
| 6 | 5.84a | 55 | 5.4 | 5.2 | 6.1 | 6.3 | 6.4 |
| 7 | 0.05a | 35 | 4.9 | 4.7 | 5.5 | 5.5 | 5.3 |
| 2 | 14.4b | 249 | 6.7 | - | - | - | - |
In vitro inhibition of ATRA metabolism by Hamster liver assay [48],
A biochemical assay was performed using microsomal preparations from T47D cells induced to express CYP26 [65].
A diverse set of conformations for all molecules were generated by using ‘Best conformer generation’ option with 20 kcal/mol energy cutoff [67],
Compare fit analysis of all compounds with maximum omitting feature value as 1.
Figure 1.
Alignment of common-feature pharmacophore models Hypo-2 (1a) and Hypo-4 (1b) with training set molecules.
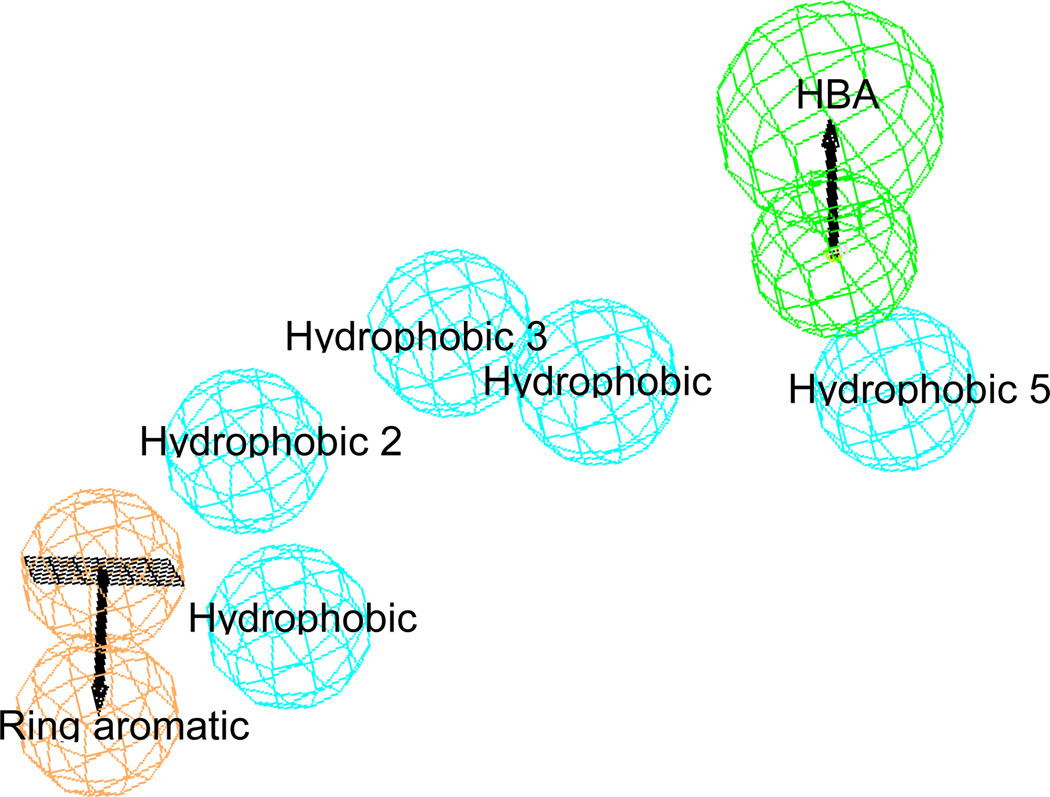
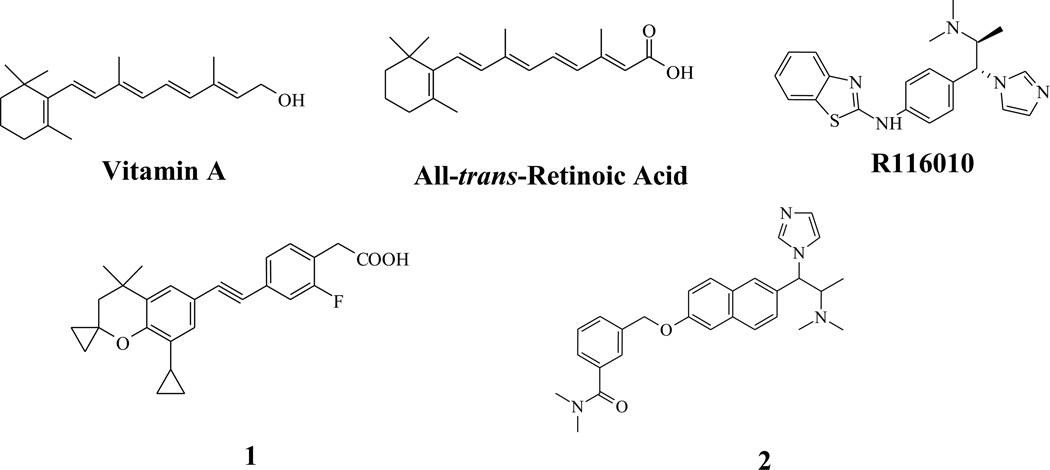
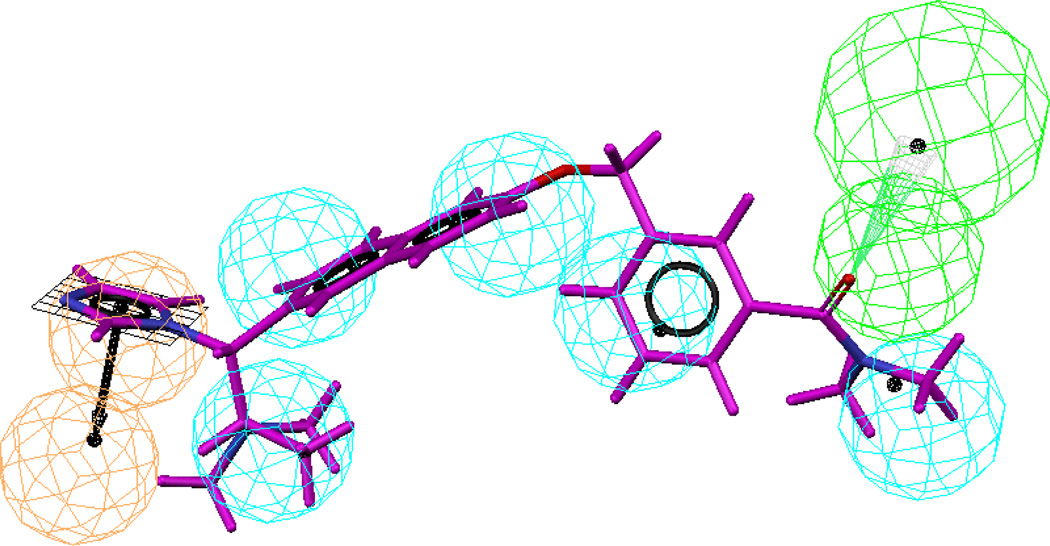
This pharmacophore model contains seven chemical features: five hydrophobic (HYD; cyan), one hydrogen bond acceptor (HBA; green) and one ring aromatic (RA; brick red) (Figure 2). The HBA maps the carbonyl oxygen of the carboxylic group on the aliphatic chain, while the heterocyclic aromatic ring attached to the cyclohexene ring maps the ring aromatic (RA). Hypo #2 was further evaluated against a known drug candidate from OSI Pharmaceutical - Compound 2 in Chart 1, which is a potent RAMBA [60]. Thus, a diverse set of conformers for Compound 2 (249 conformers) was generated by a similar protocol as described for the RAMBA training set molecules used in generating the hypotheses. Thereafter, Compound 2e was aligned with hypo #2 to generate an excellent align/fit score of 6.7 out of 7 features (Figure 3). From this data, we conclude that the selection of hypo #2 is reasonable and provides confidence for the utility of the chemical feature based pharmacophore model to retrieve structurally diverse compounds with desired biological activity.
Figure 2.
Common feature-based (Catalyst/HipHop) pharmacophore model of all-trans-retinoic acid based RAMBA inhibitors selected on the results of GH analysis (Hypo-2). The model contains seven features: five hydrophobic (cyan), one hydrogen bond acceptors (green) and one ring aromatic (red).
Chart 1.
Structures of Retinoid, all-trans-Retinoic Acid and three potent ATRA 4-Hydroxylase inhibitors.
Figure 3.
Alignment of compound 2 with hypo-2
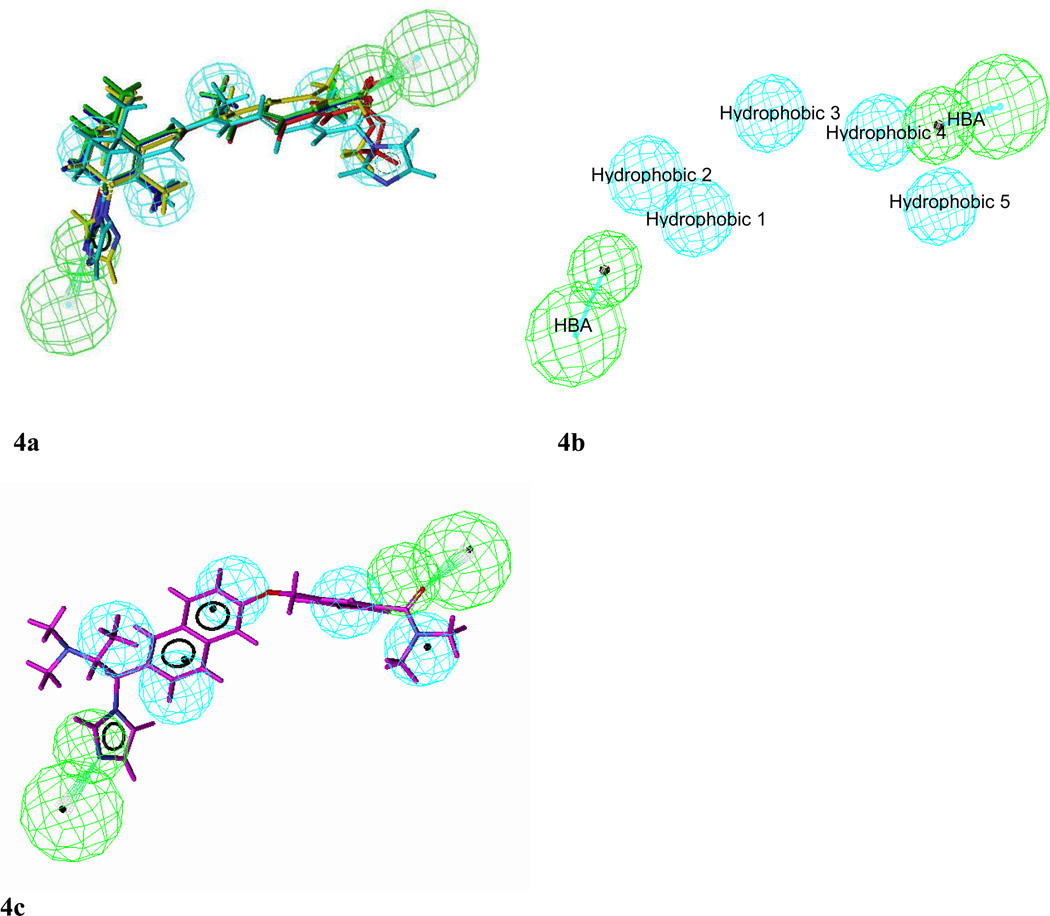
For the selection of best hypo on the basis of knowledge of ligand-enzyme interaction we selected five hypos (#1, 3, 5, 6 and 8) with two HBA functionalities. Of these five hypos, three (hypos #1, 3 and 5) were retained for further analysis as determined by the ranking of the HipHop models and by elimination of redundancies based on hierarchical clustering of the five hypotheses. Further pruning of the remaining three hypotheses was based on the criteria that of all the top ranking hypotheses, the hypotheses which maps all important features of the active compounds and if possible to some extent show correlation between best fit values, conformational energies and actual activities of the training set. Hypo 3 was selected as best hypotheses as it shows good alignment with training set molecules (Figure 4a) and correlation in fit values in comparison with hypos 1 and 5 (Table 5). This pharmacophore model contained seven chemical features: five hydrophobes (cyan) and two hydrogen bond acceptor (green) chemical features (Figure 4b). The HBAs map the carbonyl oxygen of carboxylic group on aliphatic chain and the N atom of the heterocyclic ring attached to the cyclohexene ring. Hypo #3 was further evaluated against OSI pharmaceutical’s Compound 2 (Figure 4c) as described above for hypo #2. This molecule also fits hypo #3 with a fit score of 5.36.
Figure 4.
Alignment of training set molecules with Hypo3 (4a), best hypo (hypo-3) selected on the basis of knowledge of ligand and enzyme interactions (4b) and alignment of hypo-3 with compound 2 (4c)
Table 5.
Best fit values of three hypotheses which retained after hierarchical clustering
| Compd | Activity | Fit value | ||
|---|---|---|---|---|
| Hypo1 | Hypo3 | Hypo5 | ||
| 3 | 0.009 | 6.99 | 6.99 | 6.98 |
| 4 | 2.33 | 5.91 | 5.94 | 5.94 |
| 5 | 2.0 | 6.85 | 6.65 | 6.72 |
| 6 | 5.84 | 6.85 | 5.94 | 5.91 |
| 7 | 0.05 | 5.86 | 6.64 | 6.18 |
To identify the best representative pharmacophore hypothesis among the two selected hypos (hypo #2 and hypo #3) obtained from GH analysis and knowledge of ligand-enzyme interaction respectively, we also evaluated the quality (biological activity profiles) of the compounds retrieved from the NCI and Maybridge databases by both hypos #2 and 3.
2.2.3. Database Searches
The two common feature-based pharmacophores (hypo #2 and hypo #3) were used as search queries against the Catalyst™-formatted NCI2000 and Maybrdige2004 databases in order to retrieve molecules with novel chemical structures and desired chemical features. The Best Flexible Search/Spread Sheet method in Catalyst was used to search the databases. Hypo #2 retrieved 18 and 263 molecules from the NCI and Maybridge databases, respectively, while hypo #3 retrieved 38 and 328 molecules from the NCI and Maybridge databases, respectively.
2.2.4. Biological Activities of Retrieved Molecules from Databases
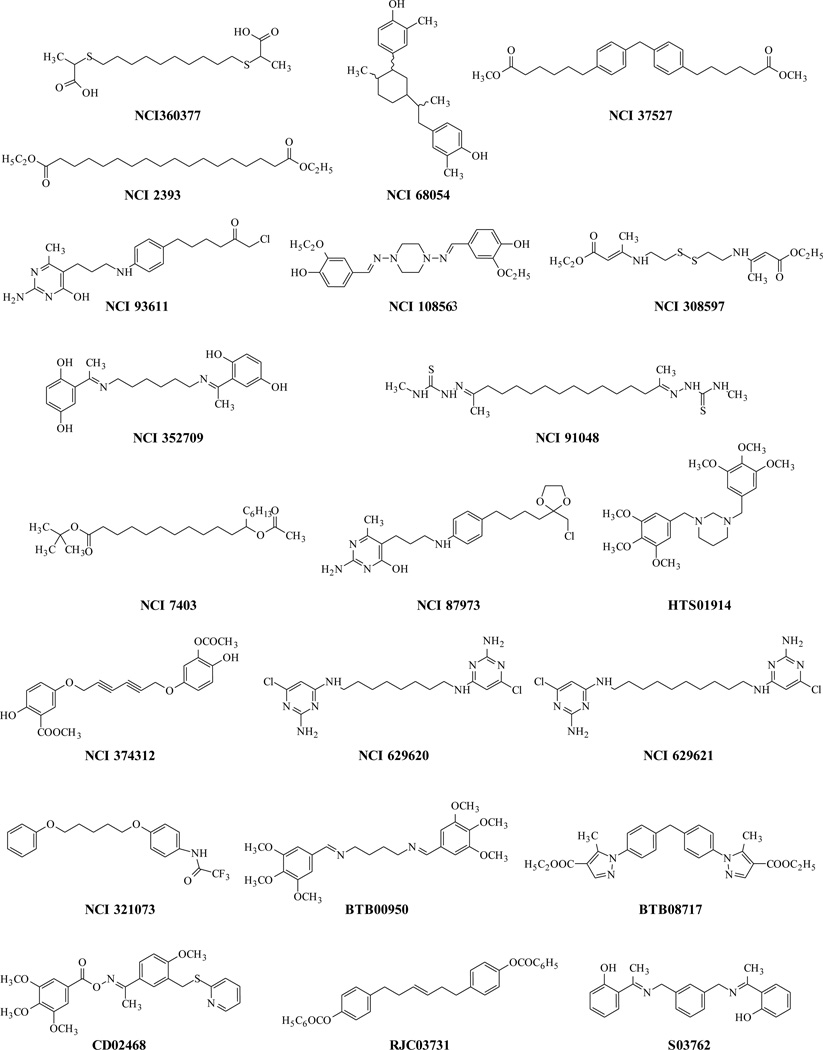
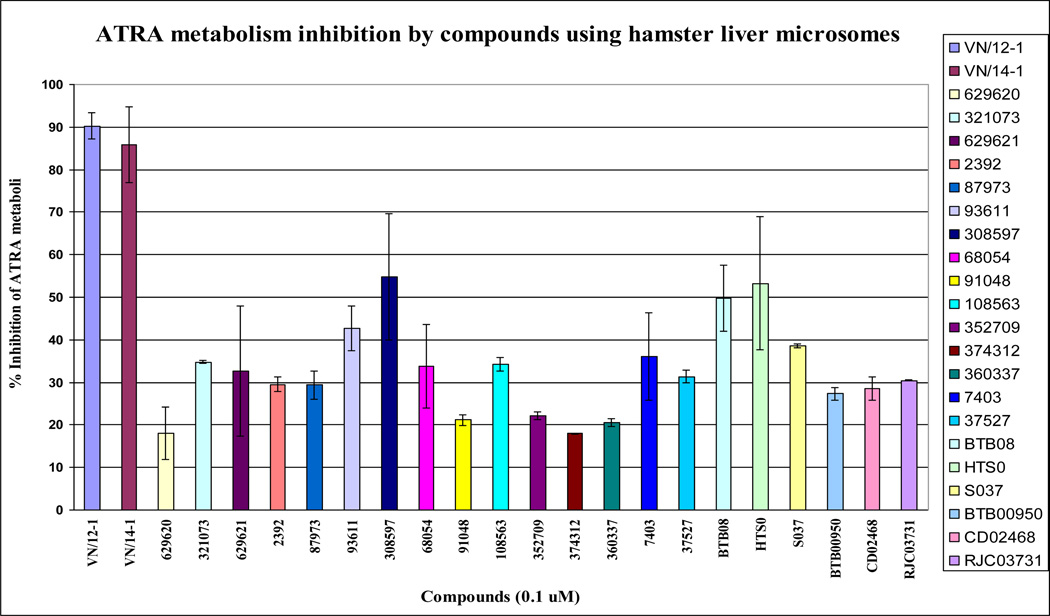
We purchased some of the molecules obtained from the database searches (NCI and Maybridge) using these hypotheses. We selected molecules which were retrieved (a) by Hypo-#3 only, (b) by hypo-#2 only, and (c) are common to both Hypo-#2 and Hypo-3 with the hope that their activities would enable selection of the better hypothesis. These molecules (Chart 3) were tested for RAMBA activity in a hamster liver microsomal assay as previously described [44]. The biological activity testing results are reported as % inhibition and are shown in Table 6 and Figure 5. Two compounds (NCI 308597 and HTS01914) selected by hypo #3 showed > 50% inhibition of ATRA metabolism by hamster liver microsomes, while one compound (BTB08717) selected by both hypos inhibited 49% of ATRA metabolism; none of the molecules selected by hypo #2 displayed ATRA metabolism inhibition more than 35%. NCI 308597 and HTS01914 retrieved by hypo #3 showed higher activities than compounds retrieved by hypo #2. Molecules retrieved from database searching which are common to both hypos showed some activity, but the computed hypo-fit values were better correlated with hypo #3.
Chart 3.
Structures of molecules retrieved from NCI and Maybridge databases
Table 6.
In vitro ATRA metabolism inhibitory activities of molecules obtained by database searching.
| Sl. no. | Name | Fit |
aInhibition % |
|
|---|---|---|---|---|
| Hypo2 | Hypo3 | |||
| 1 | NCI 360377 | - | 5.75 | 20.52 |
| 2 | NCI 68054 | - | 5.05 | 33.77 |
| 3 | NCI 37527 | - | 5.05 | 31.38 |
| 4 | NCI 2393 | - | 5.77 | 29.47 |
| 5 | NCI0093611 | - | 5.3 | 42.78 |
| 6 | NCI 108563 | - | 5.19 | 34.27 |
| 7 | NCI 308597 | - | 5.15 | 54.73 |
| 8 | NCI 352709 | - | 5.17 | 22.186 |
| 9 | NCI 91048 | - | 5.06 | 21.22 |
| 10 | NCI 7403 | - | 5.46 | 36.168 |
| 11 | NCI 87973 | - | 5.64 | 29.36 |
| 12 | HTS01914 | - | 5.36 | 53.24 |
| 13 | NCI 374312 | - | 5.46 | 17.94 |
| 14 | NCI 629620 | 4.92 | - | 18.07 |
| 15 | NCI 629621 | 5.06 | - | 32.70 |
| 16 | NCI 321073 | 4.27 | - | 34.785 |
| 17 | BTB0950 | 1.27 | 5.21 | 27.317 |
| 18 | BTB08717 | 4.10 | 4.92 | 49.785 |
| 19 | CD02468 | 2.59 | 4.58 | 28.53 |
| 20 | RJC03771 | 3.73 | 4.78 | 30.45 |
| 21 | S03762 | 0.28 | 4.76 | 38.616 |
Tested at 100 nM concentration of each compound by hamster liver microsome assay
Figure 5.
ATRA metabolism inhibition by compounds using hamster liver microsomes.
Based on all of these data, hypo #3 with five hydrophobic and two hydrogen bond acceptor features is chosen as a good representative computer-generated model for identifying new RAMBAs. The most active molecules in this study displayed less potency when compared to the training set molecules. The activity profile of these molecules correlate with the fit values imputed from the hypothesis (<5.5 vs. 7 features). It is possible that searching of other commercial and/or proprietary databases for may result in the identification of other potentially more active ATRA metabolism inhibitors.
2.3. Molecular Modeling Studies
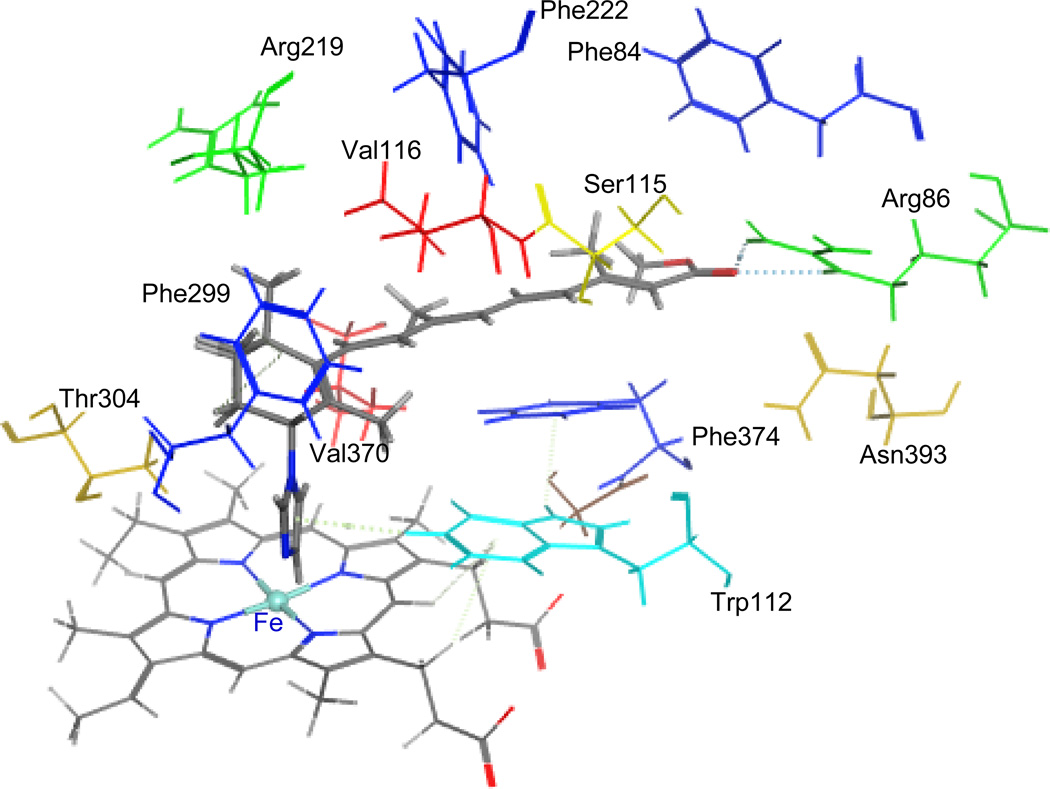
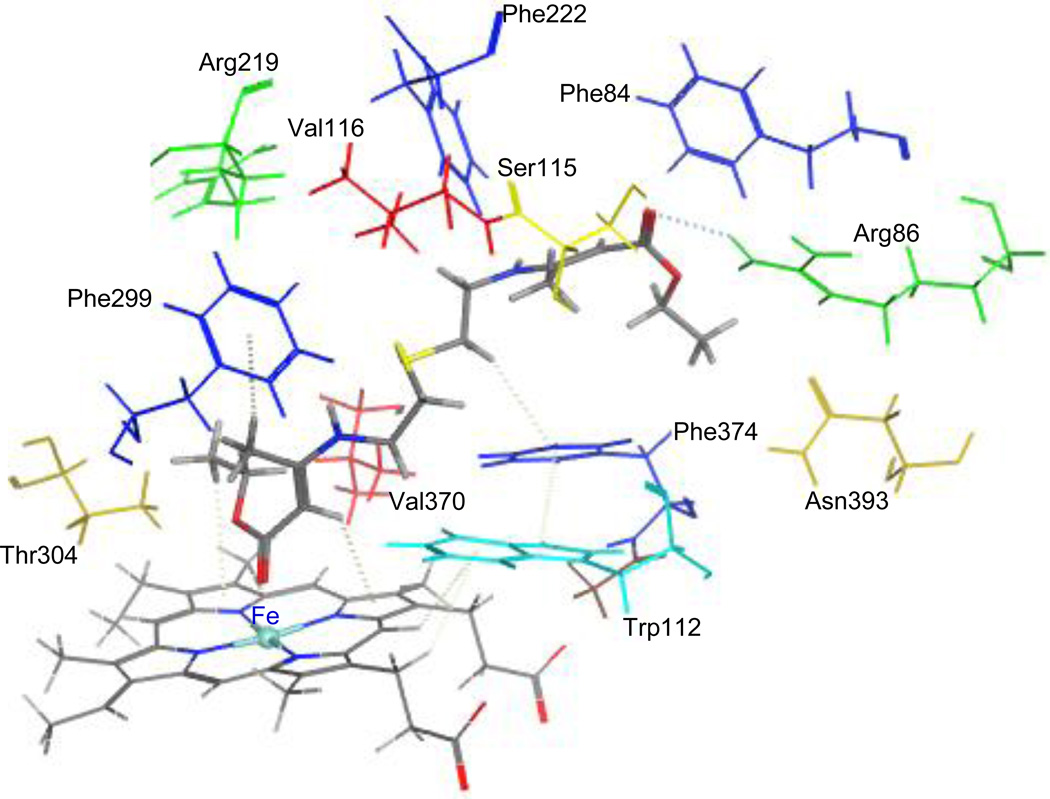
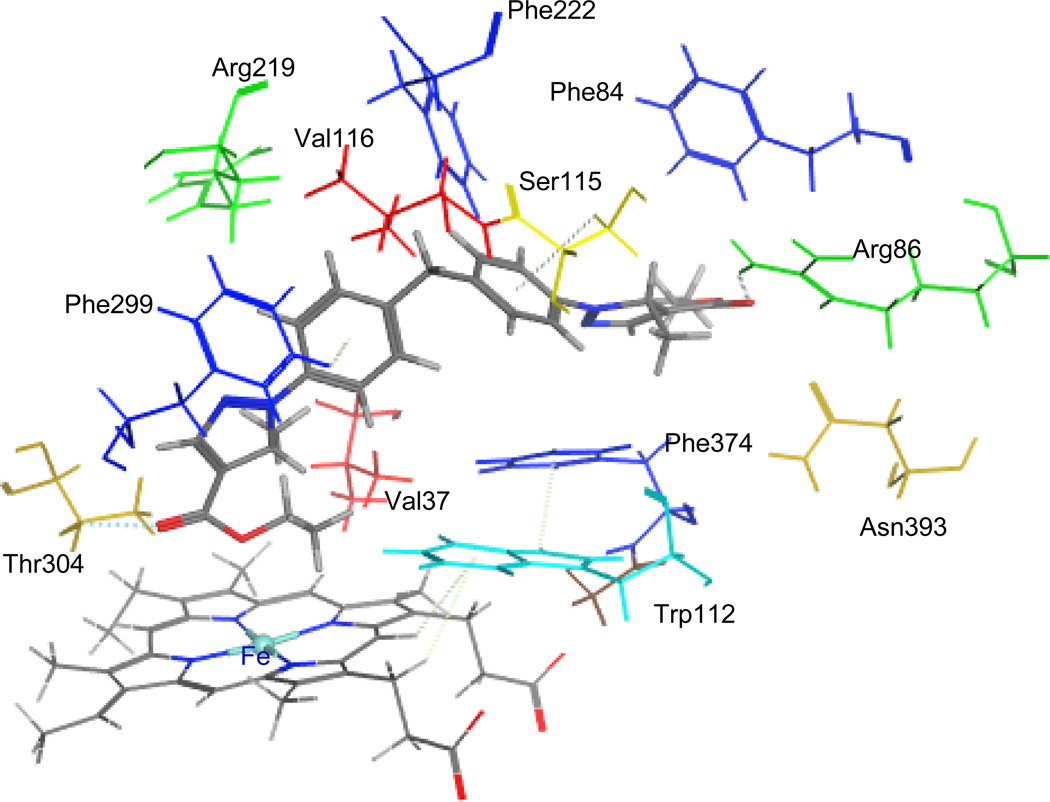
To study the binding modes of the active hit molecules and our RAMBAs with the CYP26A enzyme, we performed molecular docking experiments of the following molecules ATRA, compound 3, 4, NCI308597, and BTB08717 into the ligand binding site of the enzyme. ATRA was found to dock satisfactorily in the active site as previously reported [36, 47]. The C-4 of cyclohexene ring positioned above the heme iron at the distance of 4.98 Å and the polyene chain passes through a hydrophobic tunnel made up of Phe84, Trp112, Phe119, Phe222, Pro371 and Phe374 to form hydrogen bonding interactions between carbonyl group of ATRA and Arg86. Similarly the retinoid RAMBAs (3 and 4) also form hydrogen bonding interactions with Arg86 and polyene chain covered with hydrophobic tunnel (Figure 6). The imidazole group on C-4 of cyclohexene lies perpendicular to the heme iron at a distance of 4.22 Å. This distance would accommodate a water molecule between imidazole ring at C-4 of compound 3, 4 and heme iron. In the case of NCI308597, one carbonyl group is oriented perpendicular to heme iron and the other carbonyl group at other end form hydrogen bonding interaction with Arg86. The scaffold holding two ester groups is surrounded by hydrophobic amino acids (Figure 7). Similarly, two carbonyl groups at each end of BTB08717 are oriented towards the heme iron and Arg86 to form hydrophilic interactions (Figure 8). The scaffold’s diaryl ring is surrounded by hydrophobic amino acid residues. The interaction of ligands with active site is complimentary to pharmacophore model (hypo #3). Out of two hydrogen bond acceptors, one found around imidazole and triazole ring at C-4 position of cyclohexene is for interaction with heme iron and second one for interaction with Arg86. Five hydrophobic features are for interaction with hydrophobic tunnel formed by Phe84, Trp112, Phe119, Phe222, Pro371 and Phe374 at active site. Clearly, these binding modes are similar to those reported for other known potent RAMBAs [36, 37, 47].
Figure 6.
Stereoview of the binding mode of compound 3 (color by element cap-stick) in the active site of CYP26A. The active site residues in the binding pocket are shown in different color (stick).
Figure 7.
Stereoview of the binding mode of NCI308597 (color by element with cap-stick) in the active site of CYP26A. The active site residues in the binding pocket are shown in different color (stick).
Figure 8.
Stereoview of the binding mode of BTB08717 (color by element with cap-stick) in the active site of CYP26A. The active site residues in the binding pocket are shown in different color (stick).
3. Conclusions
This chemical feature based pharmacophore model and molecular docking study has provided the first insight into hypothetical ligand binding requirements for retinoic acid metabolism blocking agents. This hypothesis can be used for virtual screening of other databases to get insight for designing new and highly potent RAMBA inhibitors with possibly hitherto unknown scaffolds.
4. Experimental section
4.1. Chemistry
All the RAMBAs used in this study were synthesized in our laboratories and the methodologies for their preparation have been previously published [40, 44]. The compounds identified by database searching were obtained from either the NCI (National Institute of Health, Bethesda, MD, USA) or Maybridge (Rayan Scientific, Inc., Isle of Palms. SC, USA).
4.2. In Vitro assay of RAMBAs in Hamster Liver Microsomal Assay
We assessed ATRA hydroxylase activity in incubations containing liver or cancer cell microsomes and the inhibitors by measuring the radio-labeled polar metabolites produced from [11,12-3H]-ATRA as we have previously described [44].
All enzymatic studies were performed in 0.1 M phosphate buffer, pH 7.4, at a final incubation volume of 0.40 mL. The incubation mixture contained 100 µL of microsomes (500 µg/mL dissolved in buffer); 100 µL of NADPH (20 mM dissolved in dH2O); 40 µL of inhibitor (dissolved in DMSO); and 140 µL of assay buffer [0.01 M MgCl2 and 0.02 (w/v) bovine serum albumin (BSA) in phosphate buffer solution]. After a 3 minute preincubation at 37 °C, the reaction was initiated by the addition of 20 µM of [11,12-3H]-ATRA (20 µCi/mL) and the incubation was carried out for 30 minutes under oxygen with shaking in a water bath at 37 °C. The reaction was terminated by the addition of 100 µL of formic acid. The retinoid products were extracted (2 x) with 1 mL of ethyl acetate containing 10% methanol and 0.05% butylated hydroxyanisole (BHA). The organic and aqueous phases are separated by centrifugation at 3000g for 10 minutes at 4 °C. The organic phase, containing the retinoids, was dried with a stream of argon and dissolved in 100 µL of methanol for HPLC analysis.
4.3 Generation of Pharmacophore Models
Pharmacophore modeling studies was performed using Catalyst 4.10 [48] installed on Silicon Graphics O2 desktop work-station equipped with a 300 MHz MIPS R5000 processor (128 MB RAM) running the Irix 6.5 operating system.
All structures were generated using 2D/3D editor sketcher and minimized to the closest minimum using the CHARMm-like force field implemented in the program [61]. Regarding the asymmetric centers of all the compounds, as no experimental data on the biologically relevant conformations of these molecules is available; it was arbitrarily decided to assign ‘undefined’ chirality. Allowing the pharmacophore model to choose which configuration of the asymmetric carbon atoms is the most appropriate. A stochastic research coupled to a poling method [62] was applied to generate conformers for each compound by using ‘Best conformer generation’ option with 20 kcal/mol energy cutoff (20 kcal/mol maximum compared to the most stable conformer).
The pharmacophore-based investigation of RAMBAs involved using the catalyst/HipHop program to generate feature-based 3D pharmacophore alignments [63, 64]. This was performed in three step procedure [65]: (a) a conformation model for each molecule in the training set was generated; (b) each conformer was examined for the presence of chemical feature; (c) a three-dimensional configuration of chemical feature common to the input molecules was determined. Catalyst provides a dictionary of chemical features found to be important in drug-enzyme/receptor interactions. These are hydrogen bond donors, hydrogen bond acceptors, hydrophobic groups, ring aromatic and positive and negative ionizable groups. For the pharmacophore modeling runs, common features selected for the run were ring aromatic (R), hydrogen bond donor (D), hydrogen bond acceptor (A), and hydrophobic group (H).
4.4. Molecular Docking
All molecular modeling calculations related to docking studies were performed using ‘Molecular Operating Environment (MOE) version 2010.10 release of Chemical Computing Group’s [66], on a Windows Vista operating system installed on an Intel® Core™2 Duo 2.2 GHz processor and 3 GB RAM. The target compounds were built using the MOE builder interface and subjected to energy minimization using MMFF94x force field and the partial charges were computed using the same force field. Homology model of human retinoic acid metabolizing enzyme Cytochrome P450 26A1 (CYP26A1) was used for docking was provided by Drs. C. Simons and Andrea Brancale. The enzyme was prepared for the docking studies where: (i) hydrogen atoms were added to the structure with their standard geometry; (ii) heme was defined as part of receptor (iii) partial charges were computed using Amber99 force field. The active site was defined by all the amino acid residues within a 6.5A ° distance from ligand atom. Docking calculations were done using Alpha triangle placement method and poses were prioritized by London dG scoring method.
Acknowledgement
This research was supported by grants from US National Institutes of Health and National Cancer Institute (R21 CA117991-01, 1R01CA129379-01 A2 and 5R01CA129379-02) to Professor Vincent C. O. Njar. We also thank Drs. Claire Simons, Welsh School of Pharmacy, Cardiff University, Cardiff, UK for providing CYP26A enzyme homology model used for docking studies.
Abbreviation
- 3D
three-dimensional
- 3D-QSAR
three-dimensional quantitative structure activity relationships
- ARDAs
androgen receptor down-regulating agents
- ATRA
all-trans retinoic acid
- GH
Güner-Henry
- Hypos
hypotheses
- MOE
molecular operating environment
- RAMBAs
retinoic acid metabolism blocking agents
- RAR
retinoic acid receptor
Footnotes
Publisher's Disclaimer: This is a PDF file of an unedited manuscript that has been accepted for publication. As a service to our customers we are providing this early version of the manuscript. The manuscript will undergo copyediting, typesetting, and review of the resulting proof before it is published in its final citable form. Please note that during the production process errors may be discovered which could affect the content, and all legal disclaimers that apply to the journal pertain.
References
- 1.Güner OF, Güner OF, editors. Metric for analyzing hit lists and pharmacophores. La Jolla, CA: International University Line; Pharmacophore Perception, development, and Use in Drug Design; pp. 191–211. [Google Scholar]
- 2.Sporn MB. Carcinogenesis and cancer: different perspectives on the same disease. Cancer Res. 1991;51:6215–6218. [PubMed] [Google Scholar]
- 3.Warrell RP. In: Cancer, principles & practice of oncology. DeVita VT, Hellman S, Rosenberg SA, editors. Philadelphia, PA: J. B. Lippincott; 1977. pp. 483–490. [Google Scholar]
- 4.Lotan R. Retinoids in cancer chemoprevention. The FASEB Journal. 1996;10:1031–1039. doi: 10.1096/fasebj.10.9.8801164. [DOI] [PubMed] [Google Scholar]
- 5.Moon RC, Mehta RG, Rao KVN. Retinoids and cancer in experimental animals. In: Sporn MB, Roberts AB, Goodman DS, editors. The Retinoids: Biology, Chemistry, and Medicine. New York, NY: Raven Press Ltd; 1994. pp. 573–595. [Google Scholar]
- 6.Sporn MB, Dunlop NM, Newton DL, Smith JM. Prevention of chemical carcinogenesis by vitamin A and its synthetic analogs (retinoids) Fed Proc. 1976;35:1332–1338. [PubMed] [Google Scholar]
- 7.Smith MA, Parkinson DR, Cheson BD, Friedman MA. Retinoids in cancer therapy. J Clin Oncol. 1992;10:839–864. doi: 10.1200/JCO.1992.10.5.839. [DOI] [PubMed] [Google Scholar]
- 8.Sporn MB, Roberts AB, DeWitt SG. The retinoids: biology, chemistry and medicine. New York: Raven Press; 1994. [Google Scholar]
- 9.Patra SK, Patra A, Dahiya R. Histone deacetylase and DNA methyltransferase in human prostate cancer. Biochem Biophys Res Commun. 2001;287:705–713. doi: 10.1006/bbrc.2001.5639. [DOI] [PubMed] [Google Scholar]
- 10.Mangelsdorf DJ, Umesono K, Evans RM. In: THE RETINOIDS: Biology, Chemistry, and Medicine. Sporn MB, Roberts AB, Goodman DS, editors. New York: Raven; 1994. pp. 319–349. [Google Scholar]
- 11.Muindi J, Frankel SR, Miller WH, Jr, Jakubowski A, Scheinberg DA, Young CW, Dmitrovsky E, Warrell RP., Jr Continuous treatment with all-trans retinoic acid causes a progressive reduction in plasma drug concentrations: implications for relapse and retinoid "resistance" in patients with acute promyelocytic leukemia. Blood. 1992;79:299–303. [PubMed] [Google Scholar]
- 12.Muindi JF, Scher HI, Rigas JR, Warrell RP, Jr, Young CW. Elevated plasma lipid peroxide content correlates with rapid plasma clearance of all-trans-retinoic acid in patients with advanced cancer. Cancer Res. 1994;54:2125–2128. [PubMed] [Google Scholar]
- 13.Lee JS, Newman RA, Lippman SM, Huber MH, Minor T, Raber MN, Krakoff IH, Hong WK. Phase I evaluation of all-trans-retinoic acid in adults with solid tumors. J Clin Oncol. 1993;11:959–966. doi: 10.1200/JCO.1993.11.5.959. [DOI] [PubMed] [Google Scholar]
- 14.Miller WH., Jr The emerging role of retinoids and retinoic acid metabolism blocking agents in the treatment of cancer. Cancer. 1998;83:1471–1482. doi: 10.1002/(sici)1097-0142(19981015)83:8<1471::aid-cncr1>3.0.co;2-6. [DOI] [PubMed] [Google Scholar]
- 15.Njar VC. Cytochrome p450 retinoic acid 4-hydroxylase inhibitors: potential agents for cancer therapy. Mini Rev Med Chem. 2002;2:261–269. doi: 10.2174/1389557023406223. [DOI] [PubMed] [Google Scholar]
- 16.Freyne E, Raeymaekers A, Venet M, Sanz G, Wouters W, De Coster R, Wauwe JV. Synthesis of LIAZAL, a retinoic acid metabolism blocking agent (RAMBA) with potential clinical applications in oncology and dermatology. Bioorg Med Chem Lett. 1998;8:267–272. doi: 10.1016/s0960-894x(98)00004-3. [DOI] [PubMed] [Google Scholar]
- 17.Thacher SM, Vasudevan J, Tsang KY, Nagpal S, Chandraratna RA. New dermatological agents for the treatment of psoriasis. J Med Chem. 2001;44:281–297. doi: 10.1021/jm0000214. [DOI] [PubMed] [Google Scholar]
- 18.Frolik CA, Roberts AB, Tavela TE, Roller PP, Newton DL, Sporn MB. Isolation and identification of 4-hydroxy- and 4-oxoretinoic acid. In vitro metabolites of all-trans-retinoic acid in hamster trachea and liver. Biochemistry. 1979;18:2092–2097. doi: 10.1021/bi00577a039. [DOI] [PubMed] [Google Scholar]
- 19.McSorley LC, Daly AK. Identification of human cytochrome P450 isoforms that contribute to all-trans-retinoic acid 4-hydroxylation. Biochem Pharmacol. 2000;60:517–526. doi: 10.1016/s0006-2952(00)00356-7. [DOI] [PubMed] [Google Scholar]
- 20.Nadin L, Murray M. Participation of CYP2C8 in retinoic acid 4-hydroxylation in human hepatic microsomes. Biochem Pharmacol. 1999;58:1201–1208. doi: 10.1016/s0006-2952(99)00192-6. [DOI] [PubMed] [Google Scholar]
- 21.Marill J, Cresteil T, Lanotte M, Chabot GG. Identification of human cytochrome P450s involved in the formation of all-trans-retinoic acid principal metabolites. Mol Pharmacol. 2000;58:1341–1348. doi: 10.1124/mol.58.6.1341. [DOI] [PubMed] [Google Scholar]
- 22.Abu-Abed SS, Beckett BR, Chiba H, Chithalen JV, Jones G, Metzger D, Chambon P, Petkovich M. Mouse P450RAI (CYP26) expression and retinoic acid-inducible retinoic acid metabolism in F9 cells are regulated by retinoic acid receptor gamma and retinoid X receptor alpha. J Biol Chem. 1998;273:2409–2415. doi: 10.1074/jbc.273.4.2409. [DOI] [PubMed] [Google Scholar]
- 23.Ray WJ, Bain G, Yao M, Gottlieb DI. CYP26, a novel mammalian cytochrome P450, is induced by retinoic acid and defines a new family. J Biol Chem. 1997;272:18702–18708. doi: 10.1074/jbc.272.30.18702. [DOI] [PubMed] [Google Scholar]
- 24.Sonneveld E, van der Saag PT. Metabolism of retinoic acid: implications for development and cancer. Int J Vitam Nutr Res. 1998;68:404–410. [PubMed] [Google Scholar]
- 25.White JA, Beckett-Jones B, Guo YD, Dilworth FJ, Bonasoro J, Jones G, Petkovich M. cDNA cloning of human retinoic acid-metabolizing enzyme (hP450RAI) identifies a novel family of cytochromes P450. J Biol Chem. 1997;272:18538–18541. doi: 10.1074/jbc.272.30.18538. [DOI] [PubMed] [Google Scholar]
- 26.White JA, Guo YD, Baetz K, Beckett-Jones B, Bonasoro J, Hsu KE, Dilworth FJ, Jones G, Petkovich M. Identification of the retinoic acid-inducible all-trans-retinoic acid 4-hydroxylase. J Biol Chem. 1996;271:29922–29927. doi: 10.1074/jbc.271.47.29922. [DOI] [PubMed] [Google Scholar]
- 27.Marill J, Idres N, Capron CC, Nguyen E, Chabot GG. Retinoic acid metabolism and mechanism of action: a review. Curr Drug Metab. 2003;4:1–10. doi: 10.2174/1389200033336900. [DOI] [PubMed] [Google Scholar]
- 28.Bhat PV, Lacroix A. Metabolism of retinol and retinoic acid in N-methyl-N-nitrosourea-induced mammary carcinomas in rats. Cancer Res. 1989;49:139–144. [PubMed] [Google Scholar]
- 29.Han IS, Choi JH. Highly specific cytochrome P450-like enzymes for all-trans-retinoic acid in T47D human breast cancer cells. J Clin Endocrinol Metab. 1996;81:2069–2075. doi: 10.1210/jcem.81.6.8964830. [DOI] [PubMed] [Google Scholar]
- 30.Krekels MD, Verhoeven A, van Dun J, Cools W, Van Hove C, Dillen L, Coene MC, Wouters W. Induction of the oxidative catabolism of retinoid acid in MCF-7 cells. Br J Cancer. 1997;75:1098–1104. doi: 10.1038/bjc.1997.190. [DOI] [PMC free article] [PubMed] [Google Scholar]
- 31.Krekels MD, Zimmerman J, Janssens B, Van Ginckel R, Cools W, Van Hove C, Coene MC, Wouters W. Analysis of the oxidative catabolism of retinoic acid in rat Dunning R3327G prostate tumors. Prostate. 1996;29:36–41. doi: 10.1002/(SICI)1097-0045(199607)29:1<36::AID-PROS5>3.0.CO;2-G. [DOI] [PubMed] [Google Scholar]
- 32.Sonneveld E, van den Brink CE, van der Leede BM, Schulkes RK, Petkovich M, van der Burg B, van der Saag PT. Human retinoic acid (RA) 4-hydroxylase (CYP26) is highly specific for all-trans-RA and can be induced through RA receptors in human breast and colon carcinoma cells. Cell Growth Differ. 1998;9:629–637. [PubMed] [Google Scholar]
- 33.van der Leede BM, van den Brink CE, Pijnappel WW, Sonneveld E, van der Saag PT, van der Burg B. Autoinduction of retinoic acid metabolism to polar derivatives with decreased biological activity in retinoic acid-sensitive, but not in retinoic acid-resistant human breast cancer cells. J Biol Chem. 1997;272:17921–17928. doi: 10.1074/jbc.272.29.17921. [DOI] [PubMed] [Google Scholar]
- 34.Van Heusden JVG, Bruwiere R, Moelans H, Janssen P, Floren B, van der Leede W, van Dun BJ, Sanz J, Venet G, Dillen M, Van Hove L, Willemsens C, Janicot G, M. Wouters W. Inhibition of all-TRANS-retinoic acid metabolism by R116010 induces antitumour activity. Br J Cancer. 2002;86:605–611. doi: 10.1038/sj.bjc.6600056. [DOI] [PMC free article] [PubMed] [Google Scholar]
- 35.Wouters W, van Dun J, Dillen A, Coene MC, Cools W, De Coster R. Effects of liarozole, a new antitumoral compound, on retinoic acid-induced inhibition of cell growth and on retinoic acid metabolism in MCF-7 human breast cancer cells. Cancer Res. 1992;52:2841–2846. [PubMed] [Google Scholar]
- 36.Gomaa MS, Armstrong JL, Bobillon B, Veal GJ, Brancale A, Redfern CP, Simons C. Novel azolyl-(phenylmethyl)]aryl/heteroarylamines: potent CYP26 inhibitors and enhancers of all-trans retinoic acid activity in neuroblastoma cells. Bioorg Med Chem. 2008;16:8301–8313. doi: 10.1016/j.bmc.2007.06.048. [DOI] [PubMed] [Google Scholar]
- 37.Gomaa MS, Bridgens CE, Aboraia AS, Veal GJ, Redfern CP, Brancale A, Armstrong JL, Simons C. Small molecule inhibitors of retinoic acid 4-hydroxylase (CYP26): synthesis and biological evaluation of imidazole methyl 3-(4-(aryl-2-ylamino)phenyl)propanoates. J Med Chem. 2011;54:2778–2791. doi: 10.1021/jm101583w. [DOI] [PubMed] [Google Scholar]
- 38.McCaffery P, Simons C. Prospective teratology of Retinoic Acid Metabolic Blocking Agents (RAMBAs) and loss of CYP26 activity. Curr Pharm Des. 2007;13:3020–3037. doi: 10.2174/138161207782110534. [DOI] [PubMed] [Google Scholar]
- 39.Njar VC, Gediya L, Purushottamachar P, Chopra P, Vasaitis TS, Khandelwal A, Mehta J, Huynh C, Belosay A, Patel J. Retinoic acid metabolism blocking agents (RAMBAs) for treatment of cancer and dermatological diseases. Bioorg Med Chem. 2006;14:4323–4340. doi: 10.1016/j.bmc.2006.02.041. [DOI] [PubMed] [Google Scholar]
- 40.Njar VC, Nnane IP, Brodie AM. Potent inhibition of retinoic acid metabolism enzyme(s) by novel azolyl retinoids. Bioorg Med Chem Lett. 2000;10:1905–1908. doi: 10.1016/s0960-894x(00)00391-7. [DOI] [PubMed] [Google Scholar]
- 41.Bruno RD, Njar VC. Targeting cytochrome P450 enzymes: a new approach in anti-cancer drug development. Bioorg Med Chem. 2007;15:5047–5060. doi: 10.1016/j.bmc.2007.05.046. [DOI] [PMC free article] [PubMed] [Google Scholar]
- 42.Gediya LK, Belosay A, Khandelwal A, Purushottamachar P, Njar VC. Improved synthesis of histone deacetylase inhibitors (HDIs) (MS-275 and CI-994) and inhibitory effects of HDIs alone or in combination with RAMBAs or retinoids on growth of human LNCaP prostate cancer cells and tumor xenografts. Bioorg Med Chem. 2008;16:3352–3360. doi: 10.1016/j.bmc.2007.12.007. [DOI] [PMC free article] [PubMed] [Google Scholar]
- 43.Gediya LK, Khandelwal A, Patel J, Belosay A, Sabnis G, Mehta J, Purushottamachar P, Njar VC. Design, synthesis, and evaluation of novel mutual prodrugs (hybrid drugs) of all-trans-retinoic acid and histone deacetylase inhibitors with enhanced anticancer activities in breast and prostate cancer cells in vitro. J Med Chem. 2008;51:3895–3904. doi: 10.1021/jm8001839. [DOI] [PubMed] [Google Scholar]
- 44.Patel JB, Huynh CK, Handratta VD, Gediya LK, Brodie AM, Goloubeva OG, Clement OO, Nanne IP, Soprano DR, Njar VC. Novel retinoic acid metabolism blocking agents endowed with multiple biological activities are efficient growth inhibitors of human breast and prostate cancer cells in vitro and a human breast tumor xenograft in nude mice. J Med Chem. 2004;47:6716–6729. doi: 10.1021/jm0401457. [DOI] [PubMed] [Google Scholar]
- 45.Patel JB, Khandelwal A, Chopra P, Handratta VD, Njar VC. Murine toxicology and pharmacokinetics of novel retinoic acid metabolism blocking agents. Cancer Chemother Pharmacol. 2007;60:899–905. doi: 10.1007/s00280-007-0438-3. [DOI] [PubMed] [Google Scholar]
- 46.Patel JB, Mehta J, Belosay A, Sabnis G, Khandelwal A, Brodie AM, Soprano DR, Njar VC. Novel retinoic acid metabolism blocking agents have potent inhibitory activities on human breast cancer cells and tumour growth. Br J Cancer. 2007;96:1204–1215. doi: 10.1038/sj.bjc.6603705. [DOI] [PMC free article] [PubMed] [Google Scholar]
- 47.Gomaa MS, Yee SW, Milbourne CE, Barbera MC, Simons C, Brancale A. Homology model of human retinoic acid metabolising enzyme cytochrome P450 26A1 (CYP26A1): active site architecture and ligand binding. J Enzyme Inhib Med Chem. 2006;21:361–369. doi: 10.1080/14756360600742014. [DOI] [PubMed] [Google Scholar]
- 48.Catalyst, release version 4.10. 9685 Scranton Road, San Diego, CA 92121: Accelrys; [Google Scholar]
- 49.Clement OO, Freeman CM, Hartmann RW, Handratta VD, Vasaitis TS, Brodie AM, Njar VC. Three dimensional pharmacophore modeling of human CYP17 inhibitors. Potential agents for prostate cancer therapy. J Med Chem. 2003;46:2345–2351. doi: 10.1021/jm020576u. [DOI] [PubMed] [Google Scholar]
- 50.Lee K, Jeong KW, Lee Y, Song JY, Kim MS, Lee GS, Kim Y. Pharmacophore modeling and virtual screening studies for new VEGFR-2 kinase inhibitors. Eur J Med Chem. 45:5420–5427. doi: 10.1016/j.ejmech.2010.09.002. [DOI] [PubMed] [Google Scholar]
- 51.Lopez-Rodriguez ML, Benhamu B, de la Fuente T, Sanz A, Pardo L, Campillo M. A three-dimensional pharmacophore model for 5-hydroxytryptamine6 (5-HT6) receptor antagonists. J Med Chem. 2005;48:4216–4219. doi: 10.1021/jm050247c. [DOI] [PubMed] [Google Scholar]
- 52.Ren JX, Li LL, Zou J, Yang L, Yang JL, Yang SY. Pharmacophore modeling and virtual screening for the discovery of new transforming growth factor-beta type I receptor (ALK5) inhibitors. Eur J Med Chem. 2009;44:4259–4265. doi: 10.1016/j.ejmech.2009.07.008. [DOI] [PubMed] [Google Scholar]
- 53.Waltenberger B, Wiechmann K, Bauer J, Markt P, Noha SM, Wolber G, Rollinger JM, Werz O, Scuster D, Hermann S. Pharmacophore Modeling and Virtual Screening of Novel Acidic Inhibitors of Microsomal Prostaglandin E2 Synthase-1 (mPGES-1) Journal of Medicinal Chemistry. 2011;54:3163–3174. doi: 10.1021/jm101309g. [DOI] [PMC free article] [PubMed] [Google Scholar]
- 54.Wang Z, Zhang S, Jin H, Wang W, Huo J, Zhou L, Wang Y, Feng F, Zhang L. Angiotensin-1-converting enzyme inhibitory peptides: Chemical feature based pharmacophore generation. European Journal of Medicinal Chemistry. 2011;46:3428–3433. doi: 10.1016/j.ejmech.2011.05.007. [DOI] [PubMed] [Google Scholar]
- 55.Barnum D, Greene J, Smellie A, Sprague P. Identification of common functional configurations among molecules. J Chem Inf Comput Sci. 1996;36:563–571. doi: 10.1021/ci950273r. [DOI] [PubMed] [Google Scholar]
- 56.Sutte lH, Hoffmann R. Hypogen: An automated system for generating 3D predictive pharmacophore models. In: guner OF, editor. IPharmacophore Perception, Development, and Use in Drug Design. La Jolla, CA: International University Line; 2000. pp. 171–189. [Google Scholar]
- 57.Güner OF. Metric for analyzing hit lists and pharmacophoresPharmacophore Perception, development, and Use in Drug Design. In: Güner OF, editor. Pharmacophore Perception, development, and Use in Drug Design. La Jolla, CA: International University Line; 2000. pp. 191–211. [Google Scholar]
- 58.Guner OF. Strategies for database mining and pharmacophore development. In: Guner OF, editor. Pharmacophore Perception, development, and Use in Drug Design. La Jolla, CA: International University Line; 2000. pp. 213–236. [Google Scholar]
- 59.Edger ES, Holliday JD, Willett P. LJ. Mol. Graphics Modell. 2000;18:343–375. doi: 10.1016/s1093-3263(00)00061-9. [DOI] [PubMed] [Google Scholar]
- 60.Mulvihill MJ, Kan JL, Beck P, Bittner M, Cesario C, Cooke A, Keane DM, Nigro AI, Nillson C, Smith V, Srebernak M, Sun FL, Vrkljan M, Winski SL, Castelhano AL, Emerson D, Gibson N. Potent and selective [2-imidazol-1-yl-2-(6-alkoxy-naphthalen-2-yl)-1-methyl-ethyl]-dimethyl-ami nes as retinoic acid metabolic blocking agents (RAMBAs) Bioorg Med Chem Lett. 2005;15:1669–1673. doi: 10.1016/j.bmcl.2005.01.044. [DOI] [PubMed] [Google Scholar]
- 61.Brooks BRB, Olafson RE, States BD, Swaminathan DJ, S. Karplus M. Charmm - a program for macromolecular energy, minimization, and dynamics calculations. J. Comp. Chem. 1983;4:187–217. [Google Scholar]
- 62.Smellie AT, S.L. Towbin P. Poling: Promoting conformational variation. J. Comput. Chem. 1995;16:171. [Google Scholar]
- 63.Greene J, Kahn S, Savoj H, Sprague P, Teig S. Chemical Function Queries for 3D Database Search. J. Chem. Inf. Comput. Sci. 1994;34:1297–1308. [Google Scholar]
- 64.Sprague PW. Automated Chemical Hypotheses Generation and Database Searching with Catalyst. In: Müller K, editor. Perspectives in Drug Discovery and Design. The Netherlands: ESCOM Science Publishers Leiden, B. V.; 1995. pp. 1–20. [Google Scholar]
- 65.O.O.T.-M Clement A. HipHop: Pharmacophores based on multiple common-feature alignments. In: Güner OF, editor. Pharmacophore Perception, Development, and Use in Drug Design. La Jolla, CA: International University Line; 2000. pp. 69–83. [Google Scholar]
- 66.M.O.E. (MOE) Montreal, Quebec, Canada: Chemical Computing Group, Inc.; 2010. [Google Scholar]


