Abstract
The radiological features of lobar and segmental liver atrophy and compensatory hypertrophy associated with biliary obstruction are important to recognise for diagnostic and therapeutic reasons. Atrophied lobes/segments reduce in volume and usually contain crowded dilated bile ducts extending close to the liver surface. There is often a “step” in the liver contour between the atrophied and non-atrophied parts. Hypertrophied right lobe or segments enlarge and show a prominently convex or “bulbous” visceral surface. The atrophied liver parenchyma may show lower attenuation on pre-contrast computed tomography (CT) and CT intravenous cholangiography (CT-IVC) and lower signal intensity on T1-weighted magnetic resonance imaging (MRI). Hilar biliary anatomical variants can have an impact on the patterns of lobar/segmental atrophy, as the cause of obstruction (e.g. cholangiocarcinoma) often commences in one branch, leading to atrophy in that drainage region before progressing to complete biliary obstruction and jaundice. Such variants are common and can result in unusual but explainable patterns of atrophy and hypertrophy. Examples of changes seen with and without hilar variants are presented that illustrate the radiological features of atrophy/hypertrophy.
Keywords: Atrophy, Cholestasis, Bile duct diseases, Liver, Hypertrophy
Introduction
Lobar atrophy is well recognised in association with both benign and malignant biliary obstruction, the most common aetiologies being post-cholecystectomy stricture and cholangiocarcinoma respectively [1–3]. Benign strictures result in atrophy as a result of lobar/segmental biliary obstruction, whereas cholangiocarcinoma can result in atrophy because of biliary obstruction and/or portal vein branch compromise [3–5]. In either situation the contralateral lobe often hypertrophies [3, 6].
If cholangiocarcinoma arises in a right or left hepatic duct, the resulting obstruction, with or without portal vein branch compromise, may lead to asymptomatic atrophy of that lobe, with jaundice not occurring until the tumour extends centrally to involve the confluence of the right and left hepatic ducts [3–5].
It is important to recognise the presence of lobar and segmental liver atrophy and hypertrophy, as it influences the surgical and interventional management of biliary obstruction [3, 7].
This pictorial essay describes the radiological findings of lobar and segmental atrophy associated with hilar cholangiocarcinoma. The impact of hilar biliary anatomical variants, which are relatively common, is highlighted as these have not been described previously and can result in unusual findings.
Lobar atrophy
Reduction in volume and ductal crowding
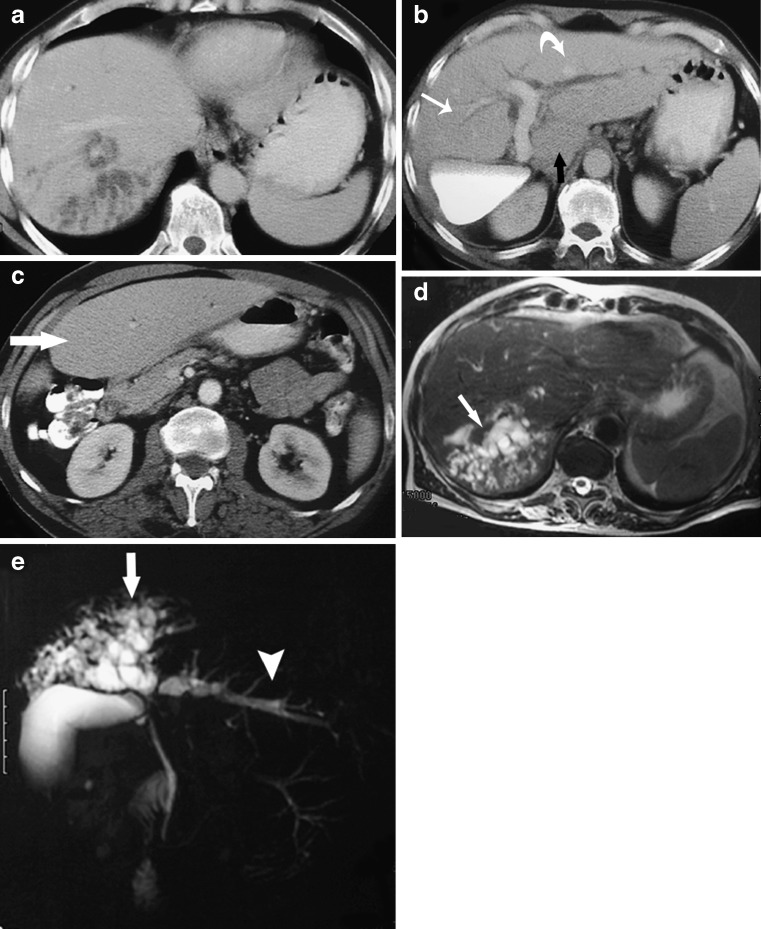
On cross-sectional imaging, lobar atrophy is usually defined as a reduction in the size of that lobe by at least 50% [8], or the presence of obvious ductal crowding on sectional imaging or cholangiography [1–3, 8–10] (Figs. 1, 2 and 3).
Fig. 1.
a–e A patient with right lobe atrophy associated with cholangiocarcinoma. a–c Contrast-enhanced CT; d, e T2-weighted magnetic resonance imaging (MRI)/magnetic resonance cholangiopancreatogram (MRCP). a The right lobe is atrophied, and lies posteriorly with markedly dilated ducts. b The caudate lobe is probably hypertrophied (black arrow), and there is definite hypertrophy of segment IV (white arrow) and the left lateral segments (curved arrow). c The hypertrophied left lobe (segment III) extends inferiorly (white arrow). d, e Within the atrophied lobe, the ducts are markedly dilated and crowded (white arrow). e The ducts of the hypertrophied lobe are mildly dilated and spread out (arrowhead)
Fig. 2.
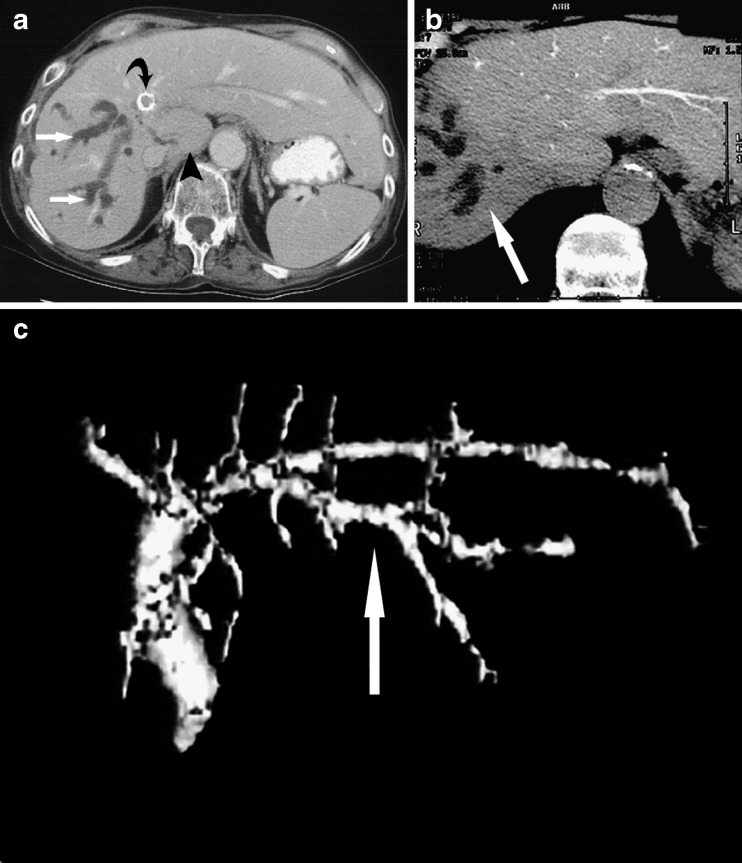
a–c A patient with right lobar atrophy and left lobar hypertrophy associated with cholangiocarcinoma. a The right lobe is atrophic with markedly dilated ducts (arrow) on computed tomography (CT). The left lobe, and probably the caudate lobe (arrowhead), are hypertrophied. A stent is in place (curved arrow). b The atrophied lobe (arrow) shows lower attenuation relative to the non-atrophied lobe on CT-IVC. c CT-IVC surface-rendered reformat. The ducts draining segments II and III in the hypertrophied lobe are spread out (arrow), relative to the ducts of the atrophied lobe
Fig. 3.
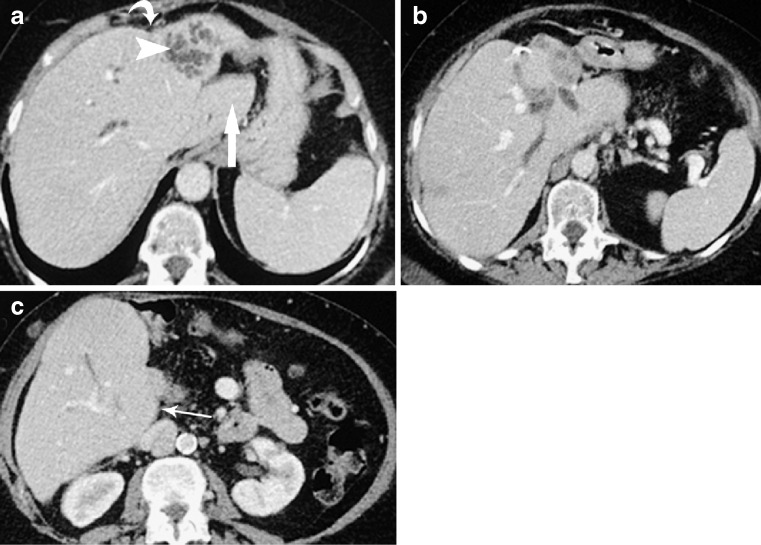
a–c A patient with left lobe atrophy and right lobe hypertrophy associated with cholangiocarcinoma. a, b CT demonstrates a “step” in the contour between the atrophied and non-atrophied lobes (curved arrow). The ducts within the atrophied left lobe appear crowded and markedly dilated (arrowhead). The caudate lobe is clearly hypertrophied (arrow). c The hypertrophied right lobe has a “bulbous” visceral contour inferiorly (arrows)
As the left lobe is normally smaller than the right, being 40-70% of the right lobe volume [11–15], it is important to factor this into assessment of size difference between the two lobes.
There is a reduction in the volume of hepatic parenchyma between the dilated bile ducts, so the actual parenchymal reduction is frequently greater than the overall lobar volume reduction. The dilated ducts consequently become more crowded and they appear to extend more peripherally towards the liver capsule, somewhat analogous to bronchial dilatation in bronchiectasis (Fig. 1).
With right lobe atrophy, the atrophic lobe tends to “rotate” more superiorly and posteriorly (Fig. 1). In left lobe atrophy, the lobe is smaller but otherwise not appreciably displaced (Fig. 3).
Contour “step”
There is often a change in hepatic contour, or a “step”, between the atrophied and non-atrophied parts (Figs. 3 and 8). This “step” sign, when present, allows more confident diagnosis of atrophy and is a useful sign when determining the lobar or segmental distribution of atrophy.
Fig. 8.
a–d A patient with segmental atrophy associated with cholangiocarcinoma; the right posterior sectoral duct drained into the left hepatic duct. a Diagram representing a variant right posterior sectoral duct (RPSD) draining into the left hepatic duct (LHD) (RASD right anterior sectoral duct, CHD common hepatic duct). b CT demonstrates atrophy of the left lobe (black arrow) and right posterior segments (white arrow), and hypertrophy of the right anterior segments. c Note the “step” in the contour between the left lobe/right anterior segments (arrow), and between the right anterior segments/ right posterior segments (arrowhead). d Note the “bulbous” contour of the visceral surface of the hypertrophied right anterior segments inferiorly (arrow)
CT attenuation and MRI signal intensity
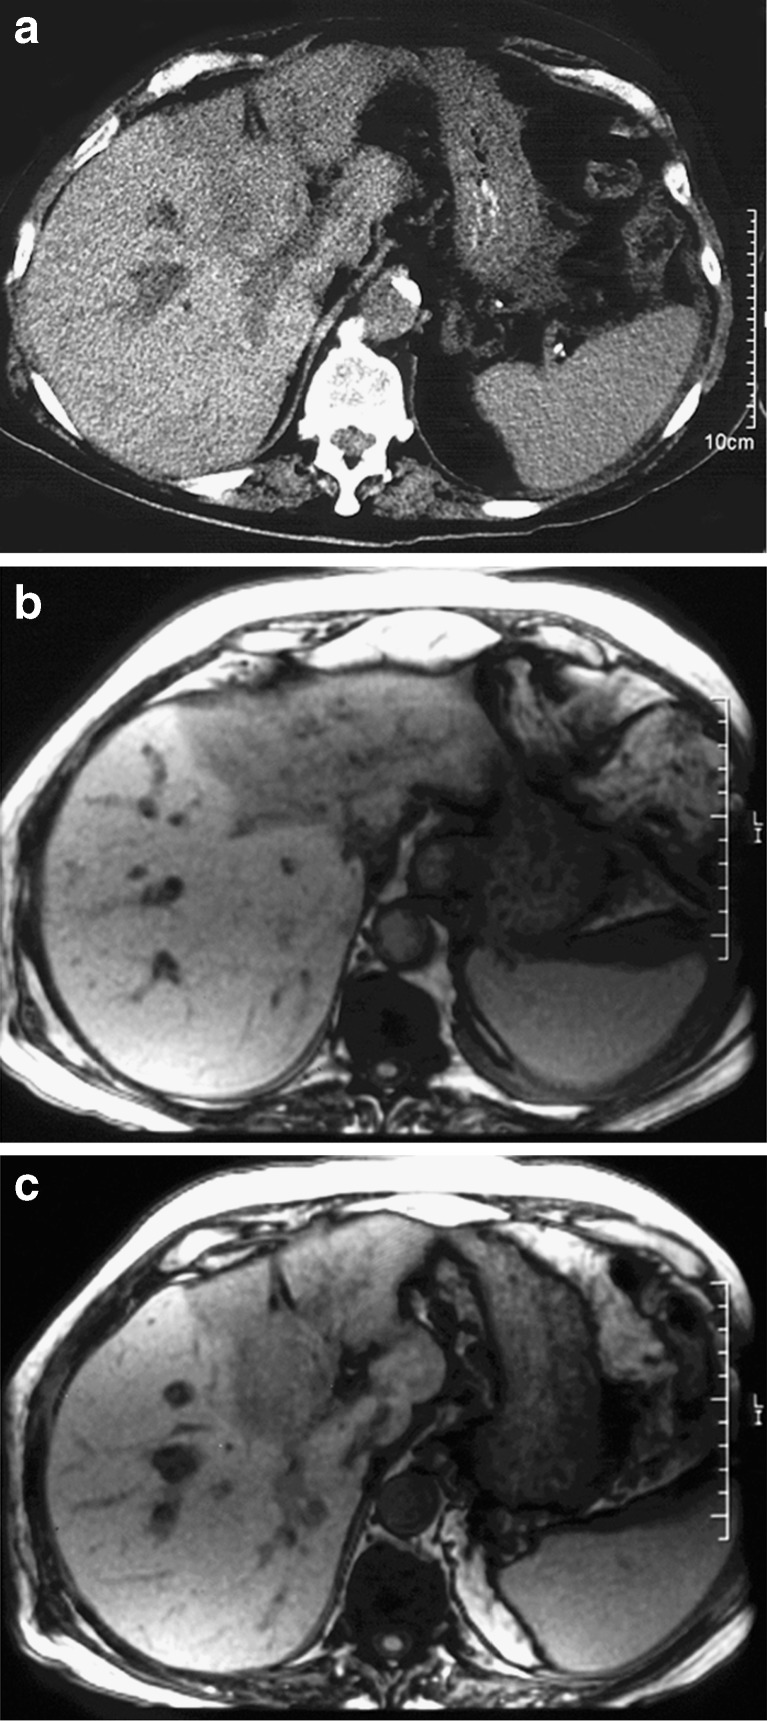
Atrophied liver parenchyma relative to non-atrophied parenchyma may show lower attenuation on pre-contrast CT [16], higher attenuation during the hepatic arterial phase of contrast-enhanced CT [4, 17], decreased signal intensity on T1-weighted MRI and increased signal intensity on T2-weighted MRI [17, 18].
Some of these features are illustrated in Fig. 5, where the atrophied parenchyma shows lower attenuation on pre-contrast CT, and lower signal intensity on T1-weighted MRI.
Fig. 5.
a–c A patient with left lobe atrophy associated with malignant hilar biliary obstruction due to metastasis of colorectal origin. The left portal vein branch is occluded. a Non-contrast-enhanced CT. The atrophied lobe shows lower attenuation than the non-atrophied lobe. b, c T1-weighted MRI. The atrophied left lobe shows lower signal intensity than the hypertrophied right lobe
An explanation for these findings on pre-contrast CT and T1-weighted MRI could be the increased water content in that portion of liver resulting from oedema, arterio-portal shunting [19] and/or fibrosis [17] within the atrophied lobe/segment.
In our experience, these CT attenuation and MRI signal intensity changes are not present in the majority of patients with lobar or segmental liver atrophy.
The atrophic liver parenchyma may also show lower attenuation on CT intravenous cholangiography (CT-IVC) (Fig. 2). This finding is explained by the reduced hepatocyte function and/or number, and consequently decreased contrast medium uptake and excretion by the atrophic parenchyma.
Compensatory hypertrophy
Lobar volume increase and duct spreading
In patients with lobar or segmental liver atrophy, the non-atrophied parenchyma may undergo compensatory hyperplasia (more often referred to as hypertrophy, even though histologically the volume increase results from hyperplasia) (Figs. 1, 2, 3, 4, 6, 7, 8) [3, 5]. Compensatory hypertrophy is common [4, 8] and is important to recognise as it helps with recognition of contralateral atrophy, and has critical importance in planning surgical resection or interventional approaches to biliary decompression [3, 7].
Fig. 4.
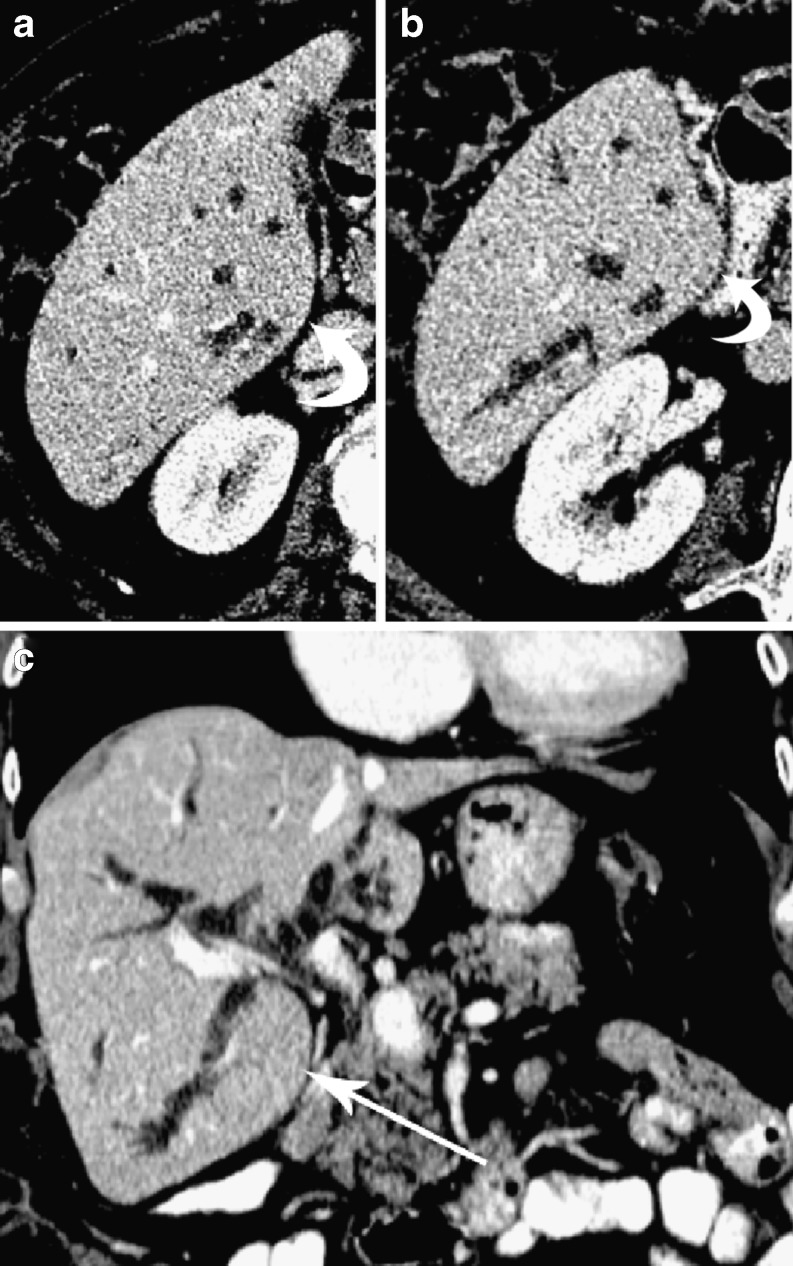
a–c A patient with atrophy of the left lobe and hypertrophy of the right lobe associated with cholangiocarcinoma. a–c Portal venous phase contrast-enhanced CT. a, b A small portion of the atrophied left lobe is visible (a); the visceral surface of the hypertrophied right lobe appears “bulbous” (curved arrows). c The increase in dimensions and inferior extent of the hypertrophied right lobe is more apparent in the coronal plane. The bulbous visceral surface of the hypertrophied right lobe is again demonstrated (arrow)
Fig. 6.
a–d A patient with right lobe and left lateral segmental atrophy associated with cholangiocarcinoma. a Diagram representing a variant segment IV duct draining into the common hepatic duct (CHD) (RASD right anterior sectoral duct, RPSD right posterior sectoral duct, RHD right hepatic duct, LHD left hepatic duct, IV segment four duct). b Endoscopic retrograde cholangiopancreatogram (ERCP) demonstrates the normal calibre segment IV duct (arrow) draining into the common hepatic duct, inferior to the hilar stricture. c, d CT demonstrates atrophy of the right lobe and left lateral segments, and hypertrophy of segment IV
Fig. 7.
a–d A patient with left lobe and right anterior segmental atrophy associated with cholangiocarcinoma. a Diagram representing a variant right anterior sectoral duct (RASD) draining into the left hepatic duct (LHD) (RPSD right posterior sectoral duct, CHD common hepatic duct). b Percutaneous transjejunal cholangiogram demonstrates a variant RASD (straight arrow) draining into the LHD (arrowhead). The RPSD (curved arrow) is seen. c, d CT demonstrates atrophy of the left lobe and right anterior segments, and hypertrophy of the right posterior segments. Note the convex (“bulbous”) visceral surface of the hypertrophied right posterior segments inferiorly (curved arrows)
Contrary to the crowded appearance of bile ducts in an atrophic lobe, those in a hypertrophied lobe appear relatively spread out (Figs. 1, 2). This spreading is most obvious when it affects the left lateral segments with resulting increased separation of the segment II and III ducts (Fig. 2c).
The relative occurrence of compensatory hypertrophy in patients with right versus left lobe atrophy has received little attention in the English literature. In two small series, one reported an equal rate of compensatory hypertrophy [8], whereas the other showed a higher rate in patients with right lobe atrophy [20].
In our experience compensatory hypertrophy is more common in patients with right lobe atrophy than left lobe atrophy, possibly because right lobe hypertrophy is more difficult to perceive.
In left lobe hypertrophy, the main increase in dimensions occurs in the axial plane on CT, which is the standard imaging plane (Figs. 1, 2). Normally, as mentioned above, the left liver lobe is substantially smaller than the right. Therefore, left lobe hypertrophy as a percentage change from baseline volume may be more substantial and therefore more obvious. Left lobe hypertrophy extends towards the left (Fig. 2a), and the left lateral segments tend to extend inferiorly into the central abdomen (Fig. 1c).
In cases of right lobe hypertrophy, the increase in dimensions is more obvious in the coronal plane (Fig. 4c). In the axial plane the hypertrophied right lobe (or segments) tends to show a prominent convex or “bulbous” contour of the visceral surface (Figs. 3, 4, 7, 8). To our knowledge, this finding has not previously been described. As the right lobe is normally larger than the left the degree of hypertrophy has to be more marked for it to be conspicuous. The recognition of the “bulbous” contour sign as well as the use of coronal CT or MRI should allow more ready recognition of right lobe hypertrophy.
Caudate lobe
In the presence of right or left lobe atrophy the caudate lobe may be atrophied or hypertrophied or neither (Figs. 1, 2, 3). In our experience the latter is the most common.
The development of atrophy or hypertrophy is likely to be determined by the involvement of caudate bile duct obstruction, which is variable in hilar malignant obstruction, as well as the status of the left portal vein, which provides the dominant portal supply to the caudate lobe [20, 21].
Segmental atrophy/hypertrophy associated with hilar biliary anatomical variation
Unilateral biliary obstruction tends to result in a pattern of lobar atrophy with contralateral lobar hypertrophy [6]. In at least some cases of lobar atrophy associated with cholangiocarcinoma, the tumour arises more peripherally, at which stage it is often asymptomatic, before it extends to the confluence of the right and left ducts causing jaundice [3–5]. During this time the atrophy and hypertrophy processes are occurring [6]. With standard hilar biliary anatomy this process results in lobar atrophy with or without compensatory hypertrophy of the contralateral lobe [3, 4, 6]. Variations in hilar biliary anatomy, however, have the potential to change the results of this progression so that the distribution of atrophy and hypertrophy may be more complex (Figs. 6, 7, 8). Such variations are common [22, 23]. Two of the most common variations are drainage of either the right posterior or right anterior sectoral ducts to the left hepatic duct (Figs. 7, 8). To our knowledge, there has been only one case report describing the complex pattern of atrophy and hypertrophy resulting from such anatomical variations in patients with cholangiocarcinoma [24].
Recognition of atypical patterns of atrophy and hypertrophy arising from hilar biliary anatomical variations is important as it has major implications for selection of the most appropriate duct for palliative decompressive stenting, whether it is via an endoscopic or percutaneous approach. Stenting an atrophic lobe can increase the risk of cholangitis developing subsequently [7], is unlikely to relieve jaundice and does not reverse the process of atrophy [3].
Three patterns of segmental atrophy/hypertrophy associated with hilar biliary anatomical variations are illustrated in Figs. 6, 7, 8, all in patients with cholangiocarcinoma.
Conclusion
Recognising the presence of lobar or segmental atrophy in patients with biliary obstruction is important because of the implications for treatment. The imaging signs are a combination of morphological changes resulting from volume loss and increase respectively in atrophy and hypertrophy, as well as attenuation changes on CT and CT-IVC, and signal changes on MRI. Hilar biliary anatomical variants result in a range of unusual but predictable patterns of segmental atrophy with or without hypertrophy.
References
- 1.Czerniak A, Soreide O, Gibson RN, et al. Liver atrophy complicating benign bile duct strictures. Surgical and interventional radiologic approaches. Am J Surg. 1986;152:294–300. doi: 10.1016/0002-9610(86)90261-8. [DOI] [PubMed] [Google Scholar]
- 2.Ham JM. Lobar and segmental atrophy of the liver. World J Surg. 1990;14:457–462. doi: 10.1007/BF01658667. [DOI] [PubMed] [Google Scholar]
- 3.Fausto N, Hadjis NS, Fong Y. Liver hyperplasia, hypertrophy and atrophy, and the molecular basis of liver regeneration. In: Blumgart LH, Fong Y, editors. Surgery of the liver and biliary tract. 3. New York: Saunders; 2000. pp. 65–83. [Google Scholar]
- 4.Takayasu K, Muramatsu Y, Shima Y, et al. Hepatic lobar atrophy following obstruction of the ipsilateral portal vein from hilar cholangiocarcinoma. Radiology. 1986;160:389–393. doi: 10.1148/radiology.160.2.3014598. [DOI] [PubMed] [Google Scholar]
- 5.Hadjis NS, Adam A, Gibson RN, et al. Nonoperative approach to hilar cancer determined by the atrophy-hypertrophy complex. Am J Surg. 1989;157:395–399. doi: 10.1016/0002-9610(89)90583-7. [DOI] [PubMed] [Google Scholar]
- 6.Schalm L, Bax H, Mansen B. Atrophy of the liver after occlusion of the bile ducts or portal vein and compensatory hypertrophy of the un-occluded portion and its clinical importance. Gastroenterology. 1956;31(2):131–155. [PubMed] [Google Scholar]
- 7.Gibson RN. Percutaneous transhepatic cholangiography and biliary drainage. In: Adam A, Gibson RN, editors. Practical interventional radiology of the hepatobiliary system and gastrointestinal tract. London: Arnold; 1994. pp. 14–31. [Google Scholar]
- 8.Hadjis NS, Hemingway A, Carr D, et al. Liver lobe disparity consequent upon atrophy. Diagnostic, operative and therapeutic considerations. J Hepatol. 1986;3:285–293. doi: 10.1016/S0168-8278(86)80480-9. [DOI] [PubMed] [Google Scholar]
- 9.Hann LE, Getrajdman GI, Brown KT, et al. Hepatic lobar atrophy: association with ipsilateral portal vein obstruction. AJR Am J Roentgenol. 1996;167:1017–1021. doi: 10.2214/ajr.167.4.8819404. [DOI] [PubMed] [Google Scholar]
- 10.Myracle MR, Stadalnik RC, Blaisdell FW, et al. Segmental biliary obstruction: diagnostic significance of bile duct crowding. AJR Am J Roentgenol. 1981;137(1):169–71. doi: 10.2214/ajr.137.1.169. [DOI] [PubMed] [Google Scholar]
- 11.Humar A, Ramcharan T, Sielaff TD, et al. Split liver transplantation for two recipients: an initial experience. Am J Transplant. 2001;1:366–372. doi: 10.1034/j.1600-6143.2001.10413.x. [DOI] [PubMed] [Google Scholar]
- 12.Kawasaki S, Makuuchi M, Matsunami H, et al. Preoperative measurement of segmental liver volume of donors for living related liver transplantation. Hepatology. 1993;18:1115–1120. doi: 10.1002/hep.1840180516. [DOI] [PubMed] [Google Scholar]
- 13.Hermoye L, Laamari-Azjal I, Cao Z, et al. Liver segmentation in living liver transplant donors: comparison of semiautomatic and manual methods. Radiology. 2005;234:171–178. doi: 10.1148/radiol.2341031801. [DOI] [PubMed] [Google Scholar]
- 14.Kamel IR, Kruskal JB, Warmbrand G, et al. Accuracy of volumetric measurements after virtual right hepatectomy in potential donors undergoing living adult liver transplantation. Am J Roentgenol. 2001;176:483–487. doi: 10.2214/ajr.176.2.1760483. [DOI] [PubMed] [Google Scholar]
- 15.Chaib E, Morales MM, Bordalo MB, et al. Predicting the donor liver lobe weight from body weight for split-liver transplantation. Braz J Med Biol Res. 1995;28:759–760. [PubMed] [Google Scholar]
- 16.Demaerel P, Marchal G, Steenbergen W, et al. CT demonstration of right hepatic lobe atrophy. J Comput Assist Tomogr. 1989;13:351–353. doi: 10.1097/00004728-198903000-00036. [DOI] [PubMed] [Google Scholar]
- 17.Yamashita Y, Takahashi M, Kanazawa S, et al. Parenchymal changes of the liver in cholangiocarcinoma: CT evaluation. Gastrointest Radiol. 1992;17:161–166. doi: 10.1007/BF01888536. [DOI] [PubMed] [Google Scholar]
- 18.Siegelman ES, Outwater EK, Piccoli CW, et al MRI of benign and malignant hepatic lobar atrophy. Clin Imaging. 1997;21(1):43–50. doi: 10.1016/0899-7071(95)00062-3. [DOI] [PubMed] [Google Scholar]
- 19.Itai Y, Ohtomo K, Kokubo T, et al. Segmental intensity differences in the liver on MR images: a sign of intrahepatic portal flow stoppage. Radiology. 1988;167:17–19. doi: 10.1148/radiology.167.1.2831561. [DOI] [PubMed] [Google Scholar]
- 20.Ishida H, Naganuma K, Konno T, et al. Lobar atrophy of the liver. Abdom Imaging. 1998;23:150–153. doi: 10.1007/s002619900309. [DOI] [PubMed] [Google Scholar]
- 21.Ortale JR, Borges Keiralla LC. Anatomy of the portal branches and the hepatic veins in the caudate lobe of the liver. Surg Radiol Anat. 2004;26:384–391. doi: 10.1007/s00276-004-0240-4. [DOI] [PubMed] [Google Scholar]
- 22.Smadja C, Blumgart LH. The biliary tract and the anatomy of biliary exposure. In: Blumgart LH, editor. Surgery of the liver and biliary tract. Philadelphia: Churchill Livingstone; 1994. [Google Scholar]
- 23.Couinaud C (1957) Le foie. Etudes anatomiques et chirurgicales, vol. 1. Masson, Paris.
- 24.Hadjis NS, Carr D, Hatzis G, et al. Anicteric presentation of hilar cholangiocarcinoma. Anatomical and pathological considerations. Dig Surg. 1987;4:119–122. doi: 10.1159/000171784. [DOI] [Google Scholar]


