Abstract
Background
Recent meta-analysis has demonstrated no significant differences in diagnostic accuracy among different imaging techniques (US, MRI and CT) in the evaluation of Crohn’s disease (CD). High-resolution bowel ultrasound has emerged as an alternative imaging technique for the diagnosis and follow-up of patients with CD, being as accurate as CT and MR for detecting intramural and extramural extension of the disease. B-Mode US can evaluate the localization and length of the affected intestinal segments and allow identification of transmural complications, stenosis and intestinal obstruction. Doppler techniques are tools that visualize and quantify bowel vascularization. Contrast-enhanced ultrasound (CEUS) is a new technique that involves IV administration of an ultrasound contrast agent with real-time examination, providing an accurate depiction of the bowel wall microvascularization and the perienteric tissues. The introduction of imaging quantification techniques enables an objective quantitative measurement of the enhancement.
Method and results
The article reviews the technique, sonographic findings, advantages and limitations, and clinical applications of contrast-enhanced US in the evaluation of Cohn’s disease. Current CEUS applications in CD are: CD activity assessment, evaluation of inflammatory masses, distinguishing phlegmons from abscesses, characterization of stenosis by differentiating fibrosis from inflammation, monitoring the efficacy of drug treatments and improving the detection of disease recurrence.
Conclusion
CEUS is an emerging technique that is part of the entire sonographic evaluation, with a role in the diagnosis and follow-up of CD, thus improving therapy planning and monitoring of the efficacy of treatment.
Electronic supplementary material
The online version of this article (doi:10.1007/s13244-011-0124-1) contains supplementary material, which is available to authorized users.
Keywords: Crohn’s disease, Ultrasound, Contrast-enhanced ultrasound, Ultrasound contrast agents, Inflammatory bowel disease
Introduction
Crohn’s disease (CD) is a chronic transmural intestinal inflammatory disease that primarily affects young individuals, characterised by episodes of inflammation alternating with periods of relative quiescence.
Cross-sectional imaging techniques have been proposed as effective diagnostic techniques to assess the mural and perivisceral changes in CD [1]. A recent meta-analysis has demonstrated no significant differences in diagnostic accuracy among ultrasound (US), MRI and CT in the evaluation of CD [2]. Because of the relapsing nature of the disease and its prevalence in young individuals, frequent re-evaluation is necessary over the years in many patients, and techniques without ionising radiation should be considered in this population. As far as we know, there are four studies comparing B-mode US and MRI in the same group of patients [3]. In three of them, US performed better than MRI, although significant differences were not found. In our opinion the choice of imaging technique depends on local availability and the skill of the radiologist. Advantages of US over MRI include the lower cost, higher patient acceptance and shorter scan time.
US has advantages over CT, as it is free of ionising radiation, non-invasive, well-tolerated and easily repeatable in patient clinical follow-ups. In recent years, high-resolution bowel ultrasound has emerged as an alternative imaging technique in the diagnosis and follow-up of patients with CD, being as accurate as CT or MRI for detecting intramural and extramural extensions of the disease [4, 5].
Contrast-enhanced ultrasound (CEUS) is a new technique that provides accurate depiction of bowel wall perfusion and the perienteric tissues after IV administration of microbubble contrast agents with real-time examination. In this article, we describe the CEUS technique in the evaluation of patients with CD, illustrate the sonographic findings and depict clinical CEUS applications, including the assessment of disease activity, evaluation of complications, characterisation of stenosis, monitoring the efficacy of drug treatments or detection of disease recurrence.
Description of the sonographic image and technique
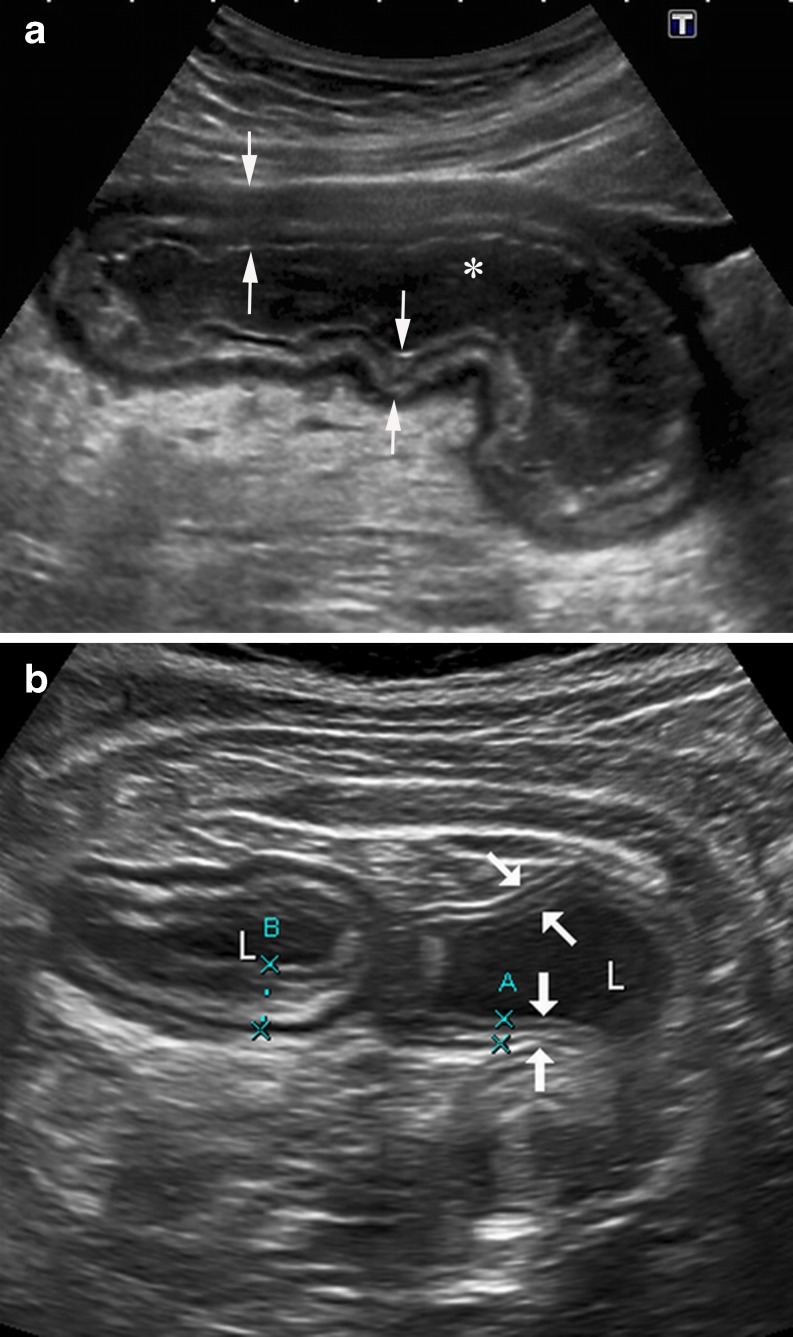
The normal bowel wall has a layered appearance, often referred to as mural echo-stratification (Fig. 1). Stratification appears as five concentric alternating hyperechoic and hypoechoic layers, where the hyperechoic central layer corresponds to the submucosa and the hypoechoic external layer to the muscularis propria. These layers become more prominent in CD because of transmural inflammation and oedema. The main ultrasonographic sign in CD consists of wall thickening >3 mm [6]. Moreover, segments of diseased bowel often appear rigid with loss of normal peristalsis.
Fig. 1.
a B-mode US shows the longitudinal section of a thickened intestinal wall (arrows) in a patient with CD. The stratification as five concentric layers is clearly identified with a high-resolution convex probe. Fluid-filled lumen appears black (*). b Transverse section of two adjacent intestinal segments in a different CD patient: US appearance of the wall of a normal ileal segment (arrows, A) is similar to the adjacent bowel (B) showing a significant wall thickening. Fluid-filled lumen (L)
A general survey of the abdomen with gradual and gentle compression techniques should be performed with a 3–5-MHz convex array transducer, but in most of the cases high-resolution convex or linear probes (>5 MHz) are indispensable for detailed examination of the bowel wall and the surrounding mesentery.
B-Mode US can evaluate the localisation and length of the affected intestinal segments and identifies complications such as fistulae, abscesses, stenosis and intestinal obstructions [4, 5].
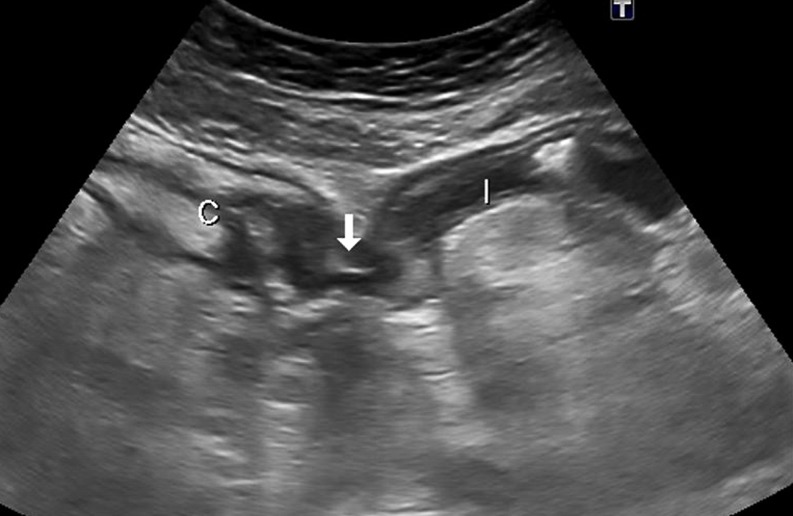
Transmural extension of the disease occurs in 20–40% of patients at some time during the course of the disease [7]. Intramural deep ulcers or fissures that contain gas can be seen on B-mode US scans as echogenic lines, which initially are located in the thickened wall, but when they extend into the serosa may become extramural. Fissures or fistulae appear as tubular hypoechoic tracts, the former in the mesentery adjacent to the inflamed loops (Fig. 2), and the latter between intestinal loops (enteroenteric fistula) (Fig. 3) or between loops and other internal structures such as the bladder or the skin. In some cases, if there are bubbles of extraluminal gas in the tracts, it is possible to see them as hyperechoic foci. Hypoechoic tracts may have a blind end in the mesentery or be internal to an inflammatory extraintestinal mass, either a phlegmon (hypoechoic mass with irregular poorly defined borders) or an abscess (complex collection frequently with echogenic bubbles of gas and a well-defined wall).
Fig. 2.
A 42-year-old man with CD and extramural disease. a Longitudinal US scan depicts a blind-end hypoechoic tract (arrows) originating from the thickened intestinal wall that represents a fistula, penetrating the mesentery (*). The stratified appearance of the bowel is lost focally at the site of the penetrating ulcer. b Macroscopic view of a transverse section of the surgical specimen through a fistulous tract (arrows) in the mesentery (*). Note the hyperaemic and thickened serosa of the resected intestinal segment
Fig. 3.
Enteroenteric fistula. US appearance of an enteroenteric fistula seen as a hypoechoic tract with internal echoes (air bubbles) (arrow), connecting the caecum (c) and a thickened ileal loop (I)
A thickened, rigid bowel wall is identified at the site of stenosis with dilatation of the proximal bowel (>3.0 cm). These lesions are often associated with increased proximal peristalsis and retropulsion of bowel contents.
Contrast-enhanced ultrasound
Basic principles of US contrast agents
US contrast agents are exogenous substances that can be administered in the blood pool to enhance the ultrasound signals. All the agents contain gas-filled microbubbles with a diameter of 2–6 μm, which are surrounded by a shell composed of varying lipids or polymers. The gas and the shell influence the half-lives of the microbubbles and their response to insonation.
There are two kinds of US contrasts agents for intestinal imaging:
Air-filled agents, named first-generation contrast agents (for example, SHU508, Levovist®), can be used with high mechanical index intermittent. The microbubbles can be disrupted, releasing a strong, but transient irregular harmonic signal that increases the Doppler signal intensity on colour Doppler sonography. Indeed, such contrast agents are not true contrast agents but rather vascular Doppler signal enhancers. Rupture of the microbubbles due to high pressure is a significant limitation for real-time imaging, so currently these contrast agents are not used in clinical practice.
Second-generation US contrast agents (for example, BR-1, Sonovue®) are filled with gases other than air. These new US contrast agents oscillate without destruction at low mechanical index, producing harmonic frequencies that are multiples of the transmitted frequency (non-linear fundamental echoes), allowing real-time imaging of microbubble signals. The introduction of a dedicated contrast agent-specific software in the ultrasound equipment enables the visualisation of the microbubble signals without the fundamental grey-scale echoes. Second-generation contrast agents with low-power insonation techniques are routinely used in clinical practices.
CEUS technique in the evaluation of patients with Crohn’s disease
The procedure is performed in two steps. An accurate baseline US and colour Doppler exploration is always performed prior to the contrast-enhanced study. Only after the initial grey-scale examination has detected the location and extension of inflammatory bowel disease can we proceed to evaluate the area of interest with CEUS.
We choose the thickest bowel segment or segments to perform the quantitative analysis of the contrast agent enhancement. We employ a 3–6-MHz convex transducer to perform the bowel study with CEUS. A low mechanical index (MI < 0.10) and wideband harmonic mode (Pulse inversion, Toshiba, Tokyo, Japan) are used.
We employ the sulfur-hexafluoride based second-generation echo-signal enhancer (SonoVue®, Bracco, Milan, Italy) injected as a bolus in units of 1.2 ml through a three-way 20-gauge catheter in a forearm vein, followed by 10 ml of a normal saline solution (0.9% NaCl). A different range of 1.2-ml boluses of contrast agent can be used for each patient, depending on the number of involved bowel segments. In our experience, with a 3–6-MHz convex transducer, the use of higher doses of contrast agents does not improve the image or change the quantitative measurement. However, when using higher frequency transducers, either convex or linear-array probes, the best results are obtained with the administration of a 5-ml bolus.
For each examination the recording starts a few seconds before the intravenous administration of the contrast agent and continuous imaging is performed for 40 s. A predetermined region of interest (ROI) is selected and the software determines the brightness over a defined time period. The whole examination is stored in the scanner as a videoclip and subsequently sent to a personal computer for conversion into an .avi format video file.
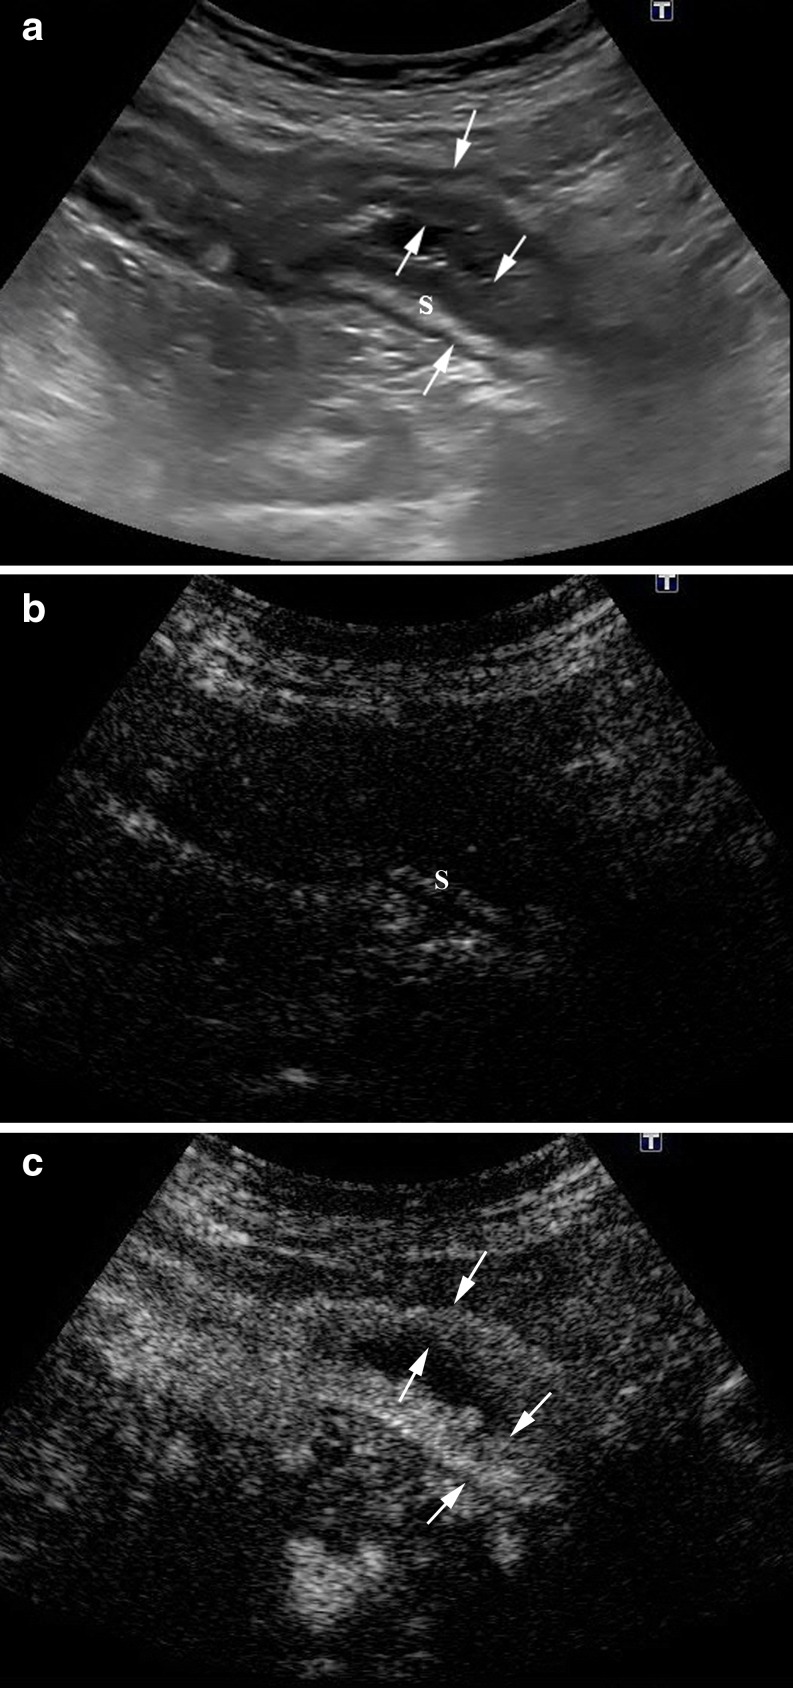
Immediately after intravenous administration of the contrast agent, the harmonic mode is switched on. The gain setting has previously been regulated to obtain an anechoic bowel wall. The hyperechoic submucosal layer and the central hyperechoic line arising from the bowel lumen can be seen in some cases in the harmonic mode (Fig. 4). The transducer must be kept as still as possible on the previously selected image of the intestinal segment. Approximately 12–20 s after contrast agent injection the bowel wall enhances, achieving the maximum enhancement in approximately 5 s [video 1, Supplemental Material]. Afterwards the enhancement decreases gradually. No contrast agent pooling is observed in the intestinal wall because microbuble contrast agents present a pure intravascular distribution.
Fig. 4.
a Longitudinal B-mode US scan of the intestinal involved segment with a multilayered appearance. Hyperechoic submucosa (S). b Longitudinal US scan in the contrast-specific mode before contrast agent administration, with the signal almost completely suppressed by the software. Note that the submucosa (S) can be seen. c Diffuse transmural contrast enhancement is seen after specific contrast agent injection. Arrows point to the anterior and posterior thickened intestinal wall
Contrast-enhanced ultrasound of intestinal wall hyperaemia
Both colour and power Doppler sonography have been used to assess the wall hypervascularisation of inflamed loops. However, their resolution for small vessels is limited, and changes in wall vascularity detectable by these techniques are very likely only due to large arteries feeding the vascular bed. With the advent of low-mechanical-index real-time harmonic sonography associated with second-generation contrast agents, which remain for a longer period in the intestinal wall microcirculation, it is now possible to provide an accurate mapping of the intraparietal vasculature, even identifying low-velocity flows in small vessels.
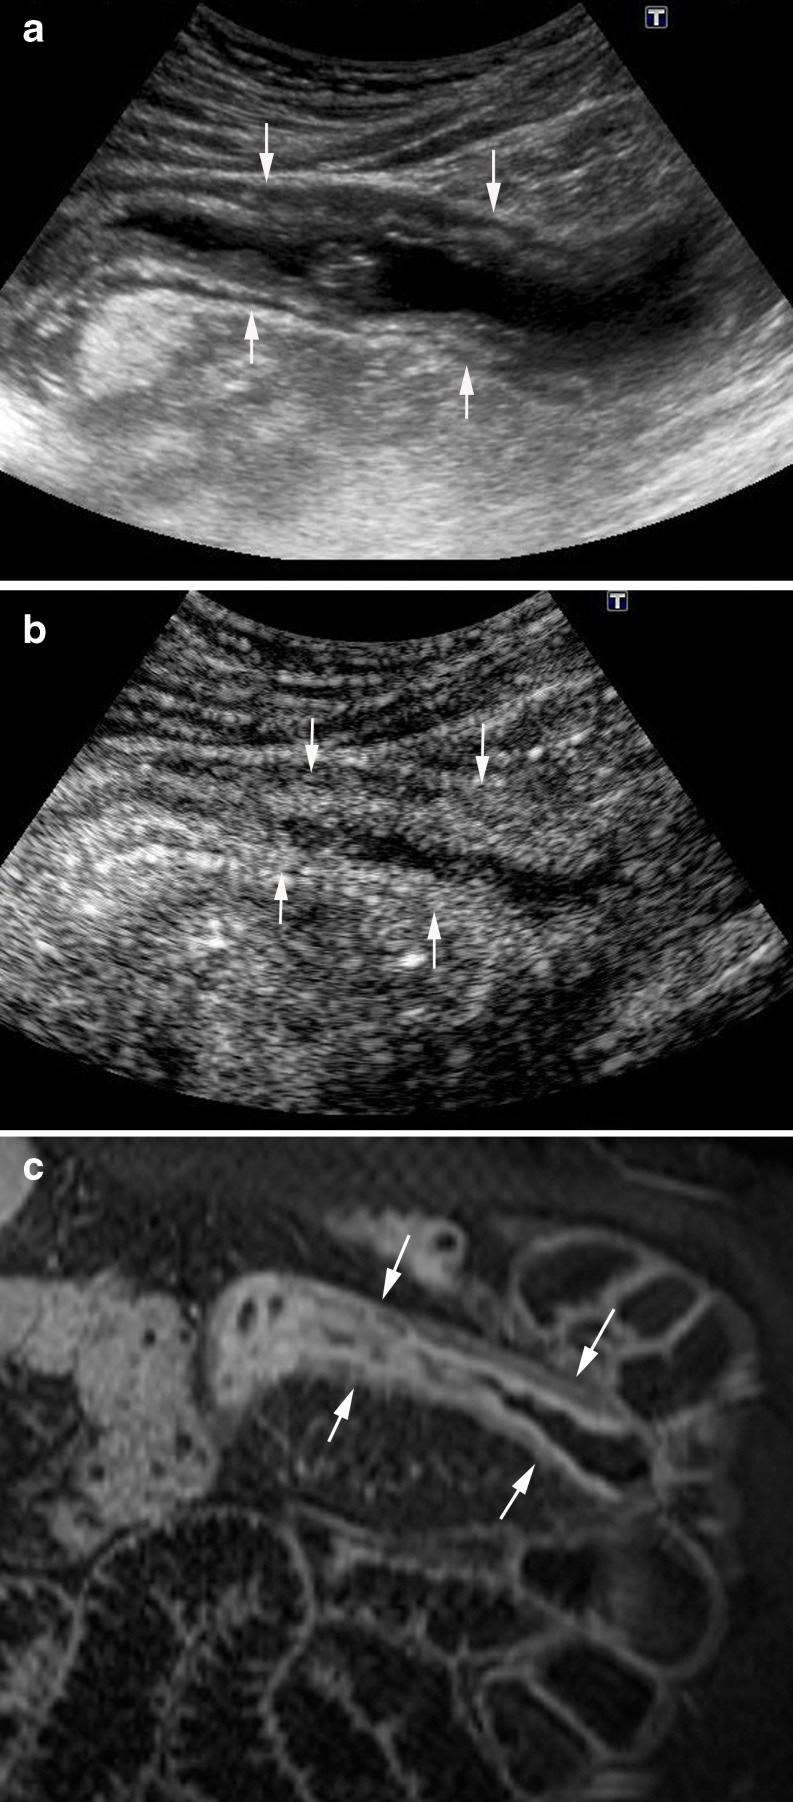
Histological studies have demonstrated that neovascularisation of the bowel wall, characterised by the development of new capillary vessels in the lamina propria and submucosa, is an early pathological change occurring in patients with active CD [8]. The activation of the angiogenesis is the basis for visualisation of inflamed bowel walls by imaging methods employing intravenous contrast agents. CT enterography and MRI with oral contrast agents are sensitive markers of small bowel inflammation and correlate with histological findings of inflammatory CD [9, 10]. Prior studies have shown a high correlation between signal enhancement at CEUS and MRI, confirming that both techniques are capable of objective evaluation of the increase in vascularisation of the bowel wall (Figs. 5 and 6) [11].
Fig. 5.
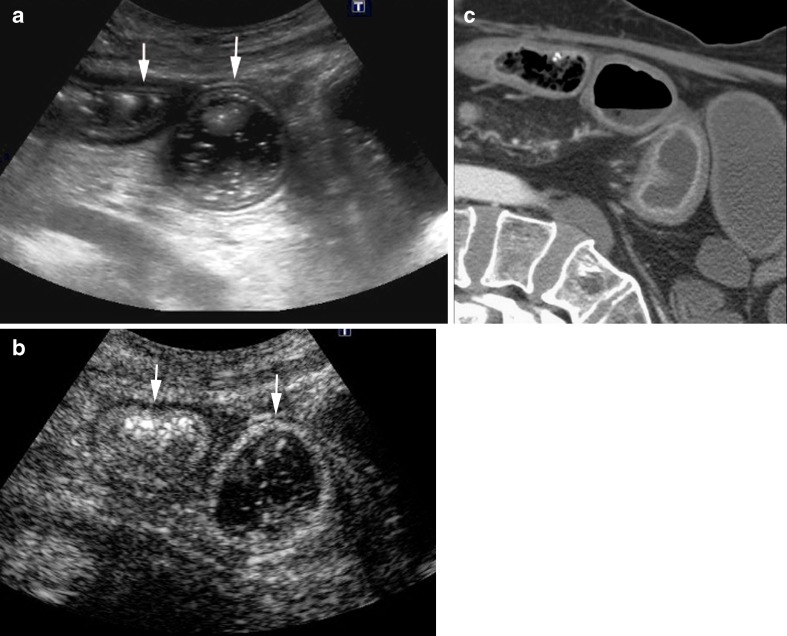
Acute exacerbation of CD in a 43-year-old man. a A thickened ileal wall is identified in basal US (arrows). b CEUS and (c) the corresponding MR image (post-contrast coronal VIBE section) show a layered enhancement in the involved segment (arrows)
Fig. 6.
a Sagittal B-mode US scan identifies mild circumferential wall thickening in two ileal loops (arrow). b CEUS and (c) the corresponding MDCT demonstrates contrast agent enhancement of the intestinal wall
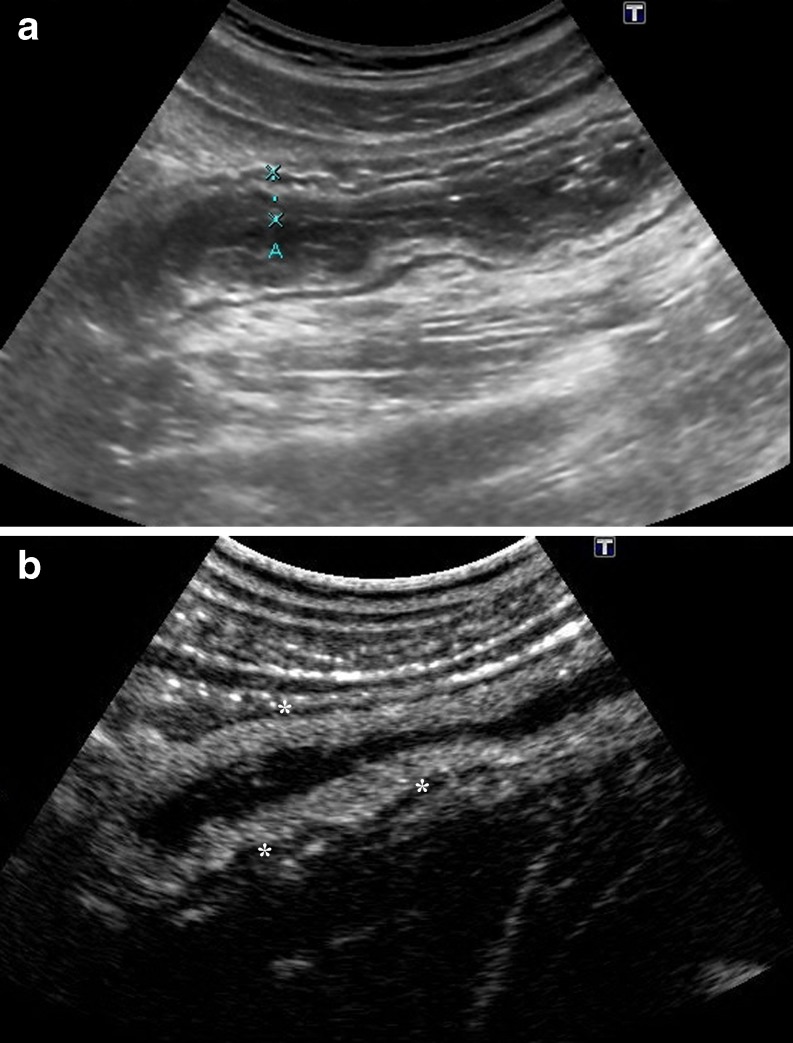
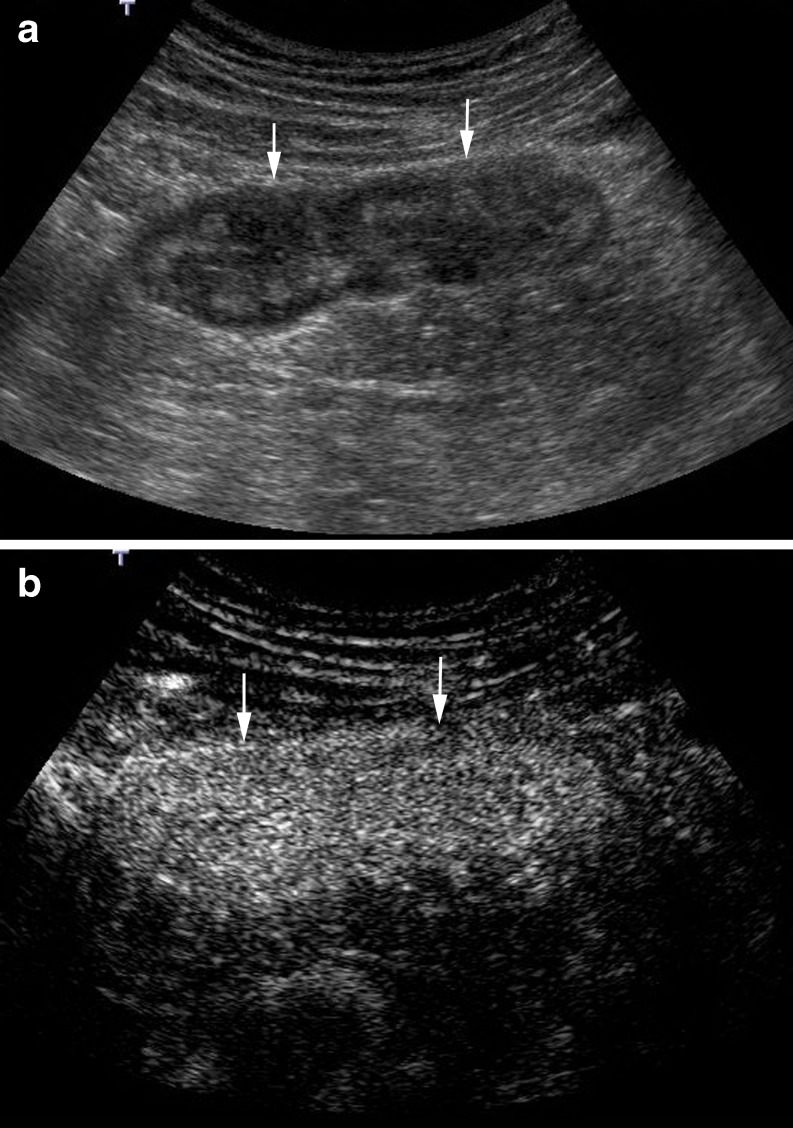
CEUS can identify different patterns of enhancement of the thickened bowel wall. Pattern 1 corresponds to a complete enhancement of the bowel wall (Fig. 7); pattern 2 corresponds to enhancement of the inner layers (except the muscularis propria) (Fig. 8); pattern 3 depicts enhancement only of the intermediate layer (submucosa); pattern 4 corresponds to the complete absence of enhancement.
Fig. 7.
Inner layer enhancement. a B-mode US shows a thickened and layered bowel loop. Anterior wall is between marks. b CEUS depicts intense enhancement of the inner and intermediate layer, with absence of enhancement in the muscularis propria (hypoechoic external layer) (*)
Fig. 8.
Diffuse transmural enhancement. a B-mode US shows a hypoechoic thickened wall (arrows). b CEUS shows complete and homogeneous enhancement of the entire wall, from the mucosa to the serosa layers
Quantitative measurement of bowel wall vascularity
To assess the vascularisation of the involved bowel loop, the contrast agent uptake over a period of 40 s is measured by quantitative analysis of the brightness in regions of interest (ROI) localised in the brighter zone of the intestinal wall, using a dedicated software installed into the US equipment or by a specific software of quantification installed on a personal computer. The software automatically obtains a brightness-time curve (Fig. 9). The manually defined area of the ROI is variable on each patient depending on the thickness of the wall, but has to be at least 2 cm2. This provides objective assessment of the signal quantity, which can be considered an expression of parietal vascular density. The vascularity of the intestinal segment is measured in grey-scale levels from 0 (black pixels) to 255 (white pixels) by the dedicated software.
Fig. 9.
a Transverse B-mode US scan of the intestinal involved segment shows a deep ulcer with echogenic gas (arrow). The thickened anterior wall is between marks. b CEUS: Transverse US scan in the contrast-specific mode. Measurement of bowel wall vascularity, after second-generation contrast agent injection, in a manually defined ROI, obtaining the brightness-time curves over a period of 40 s. In this case, the absolute and percentage of enhancement increases were 71 and 122, respectively (baseline value 58, maximum value 129)
We assess the quantitative measurement of contrast agent enhancement as the difference between the baseline brightness before contrast agent injection and the value of maximum enhancement. This is considered as the absolute change of vascularity during the examined period and is interpreted to represent the vascularity of the small bowel wall. We also calculate the percentage of increase in wall brightness by using the following formula: [(brightness postcontrast – brightness precontrast) × 100]/brightness precontrast.
Other softwares allow the calculation of several different parameters, including the slope of the first ascending tract of the curve, time-to-peak enhancement and area under the enhancement curve.
CEUS has some advantages over colour Doppler sonography: curves of brightness-time analysis are theoretically more reliable than semiquantitative measurements of the number of vessels. Motion artefacts produced by peristalsis or intestinal contents do not impair CEUS as happens with colour Doppler (video 2, Supplemental Material). Even if the ROI cannot be continuously placed over a defined area because of motion of the intestinal wall, it is possible to analyse the contrast agent enhancement from individual images.
Nevertheless, CEUS also has its limitations: it is not possible, even with the newer machine, to evaluate the enhancement if the bowel wall is not clearly identified or if it is too thin; also each intestinal segment evaluated needs an injection of contrast agents. Furthermore, CEUS needs specific software to quantify the enhancement, and it is time consuming.
Clinical applications of CEUS in CD
CD activity assessment
Crohn’s disease is a chronic inflammatory disease characterised by episodes of inflammation alternating with periods of remission. Therefore, it requires periodic assessment of the inflammatory activity to plan proper treatment [12]. Many disease-specific instruments to measure inflammatory activity have been evaluated, but to date no diagnostic technique is regarded as the standard reference for a reliable and reproducible quantification of CD inflammatory activity. In the routine clinical practice of gastroenterologists, this evaluation is currently based on the integration of clinical symptoms, physical findings, laboratory parameters, endoscopy and imaging tests [13].
In previous studies, both bowel wall thickness determined by sonography and vascularity within the diseased bowel wall assessed by colour Doppler have been significantly related to clinical activity indexes [14] and endoscopic activity [15, 16] in CD.
Wall enhancement after iv administration of Sonovue® has been studied as a parameter reflecting bowel inflammation. The reason for this phenomenon is assumed to be an increase of blood flow and local tissue perfusion (because of vasodilatation and neovascularisation). Mural hyperenhancement in CEUS correlates with active disease. To reliably quantify this finding, either a subjective categorical scale or an enhancement quantification can be used:
Semiquantitative evaluation: Serra et al. [17], who considered as active only the patients with abundant bowel wall enhancement (including both complete enhancement of the bowel wall or enhancement of the inner layers), reported a sensitivity and specificity of 81% and 63%, respectively, in distinguishing active and inactive disease according to the CDAI index (Figs. 7 and 8). Migaleddu et al. [18], using the same criteria as Serra et al., had a sensitivity and specificity of 93.5% and 93.7%, respectively, in distinguishing active and inactive disease according to endoscopy/biopsy as the reference standard.
Quantitative measures of bowel enhancement by quantitative analysis of brightness: the contrast agent enhancement of the bowel wall in patients with active endoscopic disease is significantly increased in comparison with the normal endoscopic bowel wall (Figs. 9 and 10). In the study of Ripollés et al. [19] a threshold brightness value of 45% increment had an overall sensitivity of 95% and specificity of 78% in predicting moderate or severe endoscopic inflammation.
Fig. 10.
a Transversal US scan of a thickened terminal ileum wall (arrows). b Post-contrast agent image shows scarce enhancement of the internal layers. A 27% increase in wall brightness was measured in the brightness-time curve (ROI in bowel wall). Mild endoscopic disease was demonstrated in the ileocolonoscopy
CEUS studies assessing inflammatory activity are based solely on ileocolonoscopy, so evidence of their ability is proved only for the colon and terminal ileum, while CD can also be localised in the small bowel.
Mural thickening correlates with inflammatory activity demonstrated by endoscopy. However, similar to the results of some previous CT or MR imaging studies [9, 20], CEUS has showed that inflammatory activity has the best correlation with mural enhancement after contrast agent injection rather than with the assessed bowel wall thickness [19].
The perfusion pattern evaluations have a subjective character. Quantitative measures of bowel enhancement by quantitative analysis of brightness are more objective and, above all, more precise. However, the selection of the ROI to measure the contrast agent enhancement depends on the radiologist, potentially introducing an interobserver variability. The exact threshold value for defining abnormal mural enhancement will vary depending of the method of measurement. However, studies comparing quantitative measures obtained with the software packages of the different kinds of commercially available ultrasound equipment have not been performed.
Characterisation of inflammatory masses
Extraintestinal complications in CD include phlegmon and abscess formation. The differentiation between these two entities has important implications for patient management, because abscesses can require surgical or percutaneous drainage. Moreover, with new therapies, especially biological therapy (antibodies to tumor necrosis factor alpha drugs, anti-TNF), the presence of abscesses should be ruled out before starting the treatment, because undetected abscesses may become clinically apparent (with risk of sepsis) only after the closure of the drainage from a fistulous tract.
On US and colour Doppler examination a phlegmon appears as a hypoechoic mass with no identifiable wall and internal colour signals. On the other hand, abscesses are present as hypoechoic fluid collections with an irregular wall and peripheral flow on colour Doppler. However, sometimes it is difficult to distinguish inflammatory infiltrates from abscesses if gas, fluid or clear signals of colour Doppler in their interior are missing.
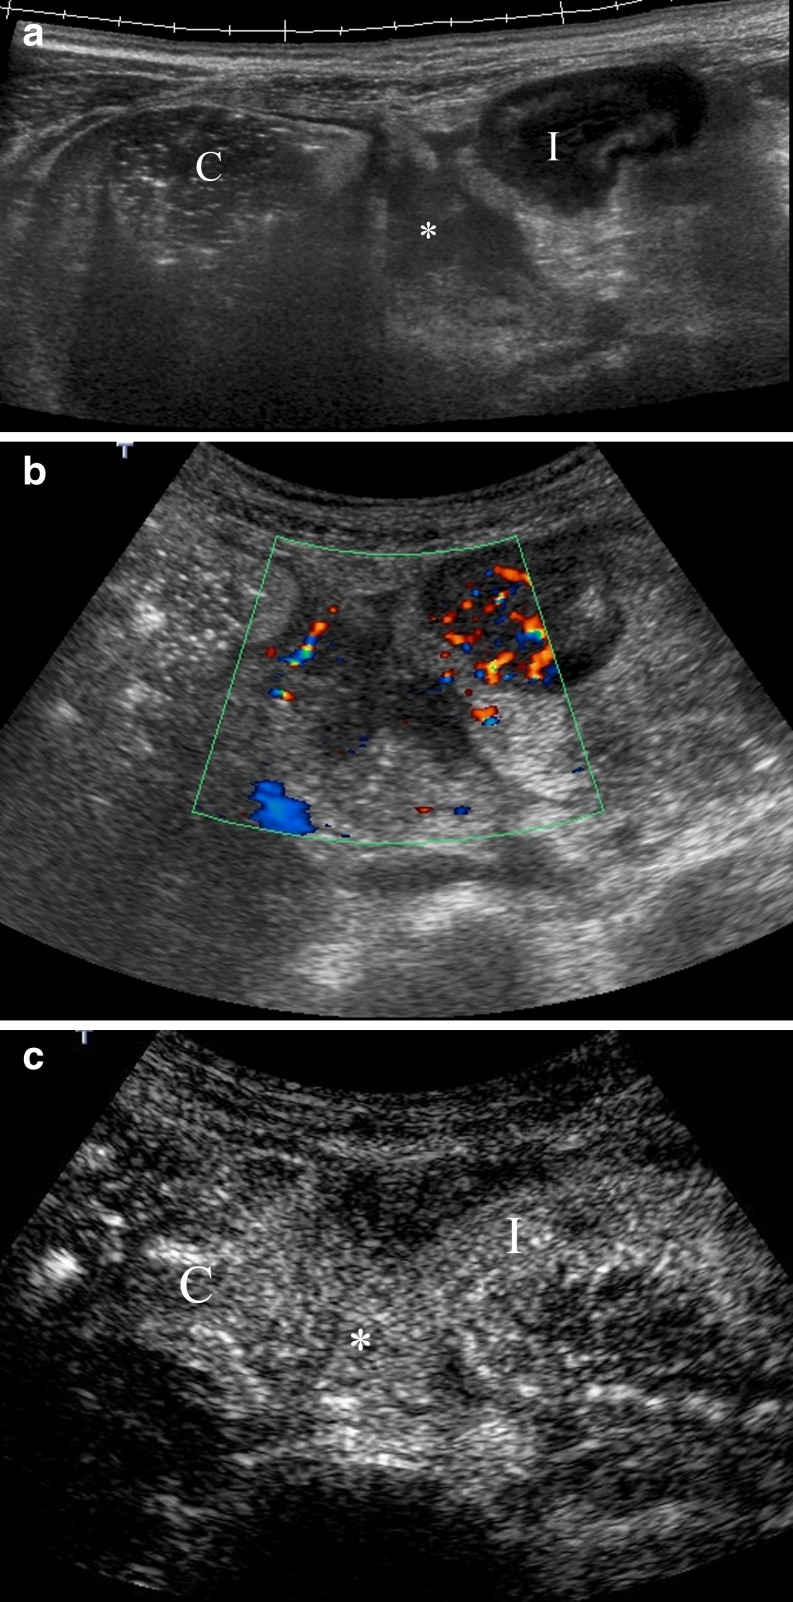
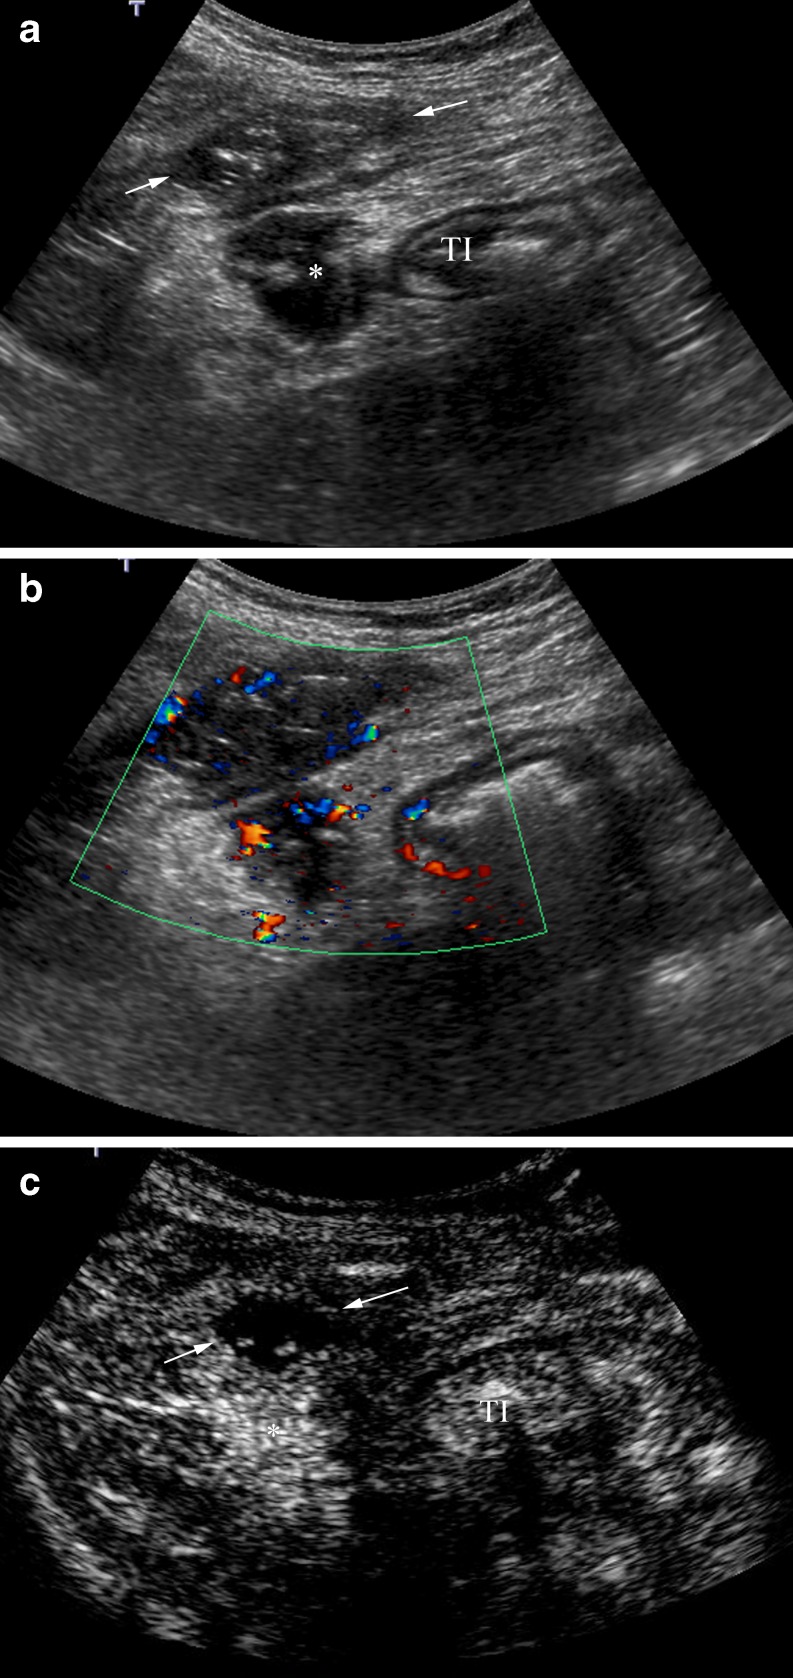
CEUS is extremely useful in distinguishing these two entities since phlegmons show intra-lesional enhancement, while abscesses show enhancement only in the wall (Figs. 11 and 12) [21].
Fig. 11.
Perienteric phlegmon. a Panoramic US view shows a hypoechoic inflammatory mass (asterisk) between the ascending colon (c) and a thickened intestinal loop (I). b Colour Doppler depicts increased Doppler signal in the intestinal wall and absence of vascularisation in the inflammatory perienteric mass. c Post-contrast image obtained after contrast agent injection detects intense enhancement of the lesion identifying the mass as a perienteric phlegmon
Fig. 12.
Anterior abdominal wall abscess. a B-mode US shows a thickened terminal ileum (TI) and two possible collections, in the anterior abdominal wall (arrows) and intraperitoneal (*). b Hypoechoic collections depict peripheral flow on colour Doppler. c Post-contrast agent image shows high enhancement of the intraperitoneal collection corresponding to a phlegmon (*). The collection located in the anterior abdominal wall is an area completely devoid of microbubble signal, representing an avascular abscess (arrows). CEUS defines its size better
Stenosis evaluation
Stenosis occurs in 12–54% of CD patients [22]. It is associated with significant morbidity and impaired quality of life. Treatment options are based on the differentiation between inflammatory versus fibrous-predominant strictures. The former can potentially be managed with conservative medical treatment, and the latter necessitates endoscopic balloon dilation or surgery. Colonoscopy is currently considered the standard method for assessing stenosis, but this technique can only provide information of the intestinal mucosa and in many cases cannot reach a stenosis located in the small bowel.
The combination of power Doppler sonography with the use of a first-generation contrast agent (Levovist®) appears to be effective in differentiating between hypervascularised inflammatory stenosis and hypovascularised, predominantly cicatritial stenosis [23].
Similar to CT or MRI, inflammatory stenosis shows abundant bowel wall enhancement after contrast agent injection (including both complete enhancement of the bowel wall or enhancement of the inner layers) that can be measured by quantitative analyses of brightness in predefined ROIs (Fig. 13) [24, 25]. A study presented only in abstract form reported that the percentage of increase in contrast agent enhancement of the bowel wall in patients with inflammatory strictures is significantly greater in comparison with patients with fibrotic strictures using surgical pathological examination as the reference standard, 82 ± 17% versus 63 ± 28%, respectively [24].
Fig. 13.
A 63-year-old man with CD and a predominant fibrotic stenosis. a US scan demonstrates stenosis of the lumen (arrows) with severe dilatation of the proximal bowel (asterisk). b Post-contrast agent image shows mild enhancement of the bowel wall. Corresponding brightness-time curve shows a 50% increase of enhancement. Pathological examination of the surgical specimen showed significant fibrostenosis with scarce-grade of inflammation
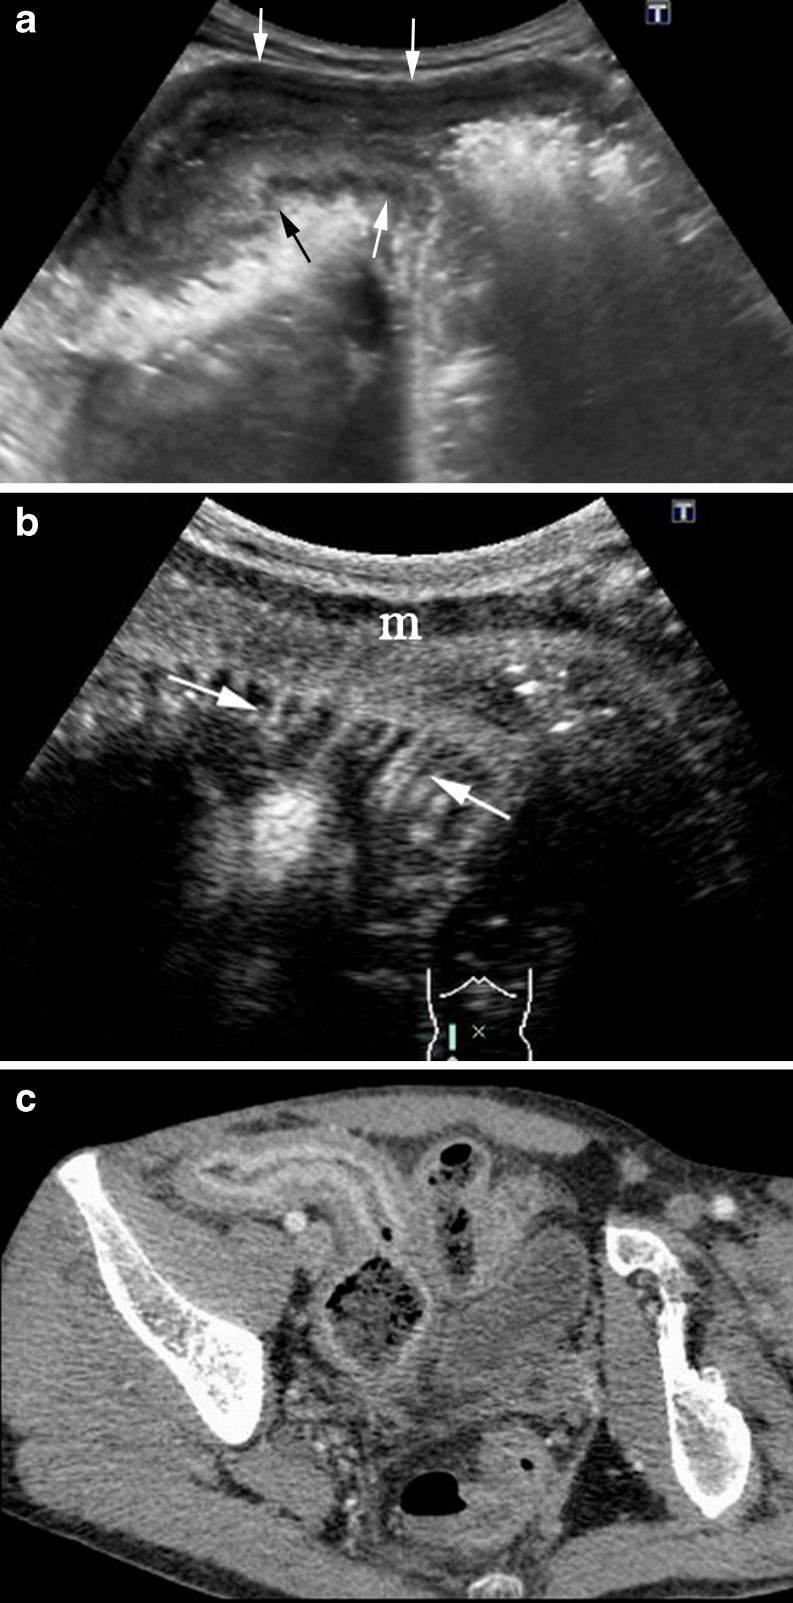
CEUS may help to differentiate between inflammatory and fibrostenotic lesions. However, in many cases a mixture of acute inflammation and fibrosis in the same stenotic segment can be found in the pathological analysis, making impossible the diagnosis (Fig. 14) [26], or even in some cases a stenotic segment can have some zones of inflammation and different zones with fibrosis as the predominant component, making the differentiation difficult (Fig. 15). Thus, although future prospective studies are needed, CEUS may have a role in differentiating hypervascular strictures from hypovascular fibrotic strictures.
Fig. 14.
A 25-year-old man with CD and obstructive symptoms. a Axial sonographic scan shows long luminal stenosis of the ileum (arrows) associated with prestenotic dilation (asterisks). b Post-contrast image obtained 20 s after contrast agent injection depicts enhancement of the proximal segment of the stenosis (large arrow) as well as of the proximal dilated intestinal loops, whereas there is scarce enhancement in the midportion of the stenosis (shorts arrows). c Surgical specimen shows a short segment of fibrous stenosis (short arrows) and severe inflammation of the proximal segment (large arrow)
Fig. 15.
A 37-year-old man with recurrent CD and obstructive signs. a Longitudinal US scan demonstrates marked thickening of the neoterminal ileum (arrows) with dilated proximal loop. b CEUS at 20 s after injection shows intense enhancement of the inner layers of the wall, with absence of contrast in the muscularis propria (m). It is associated with an increased number of adjacent mesenteric vessels (comb sign) (arrows), a finding described in CT and MRI studies as suggestive of active lesions. c Correlative image of MDCT shows the thickened enhancing wall of the stenotic segment with a stratified appearance (target sign) (arrows). Pathological analysis of the surgical specimen showed coexistence of inflammatory and fibrous components
Monitoring drug treatments
For an optimal evaluation of the efficiency of treatment, the patient must be monitored frequently; therefore, an appropriate monitoring technique should be noninvasive, without ionising radiation and, above all, patient-friendly. US fulfils all these requisites, therefore it can be performed repeatedly.
Bowel wall thickness and colour Doppler in the wall have been used to evaluate the response to classical medical treatments [27–29].
Quantitative techniques for assessment of bowel wall vascularisation by CEUS can determine changes of contrast agent enhancement, reflecting the response of intestinal inflammatory disease to therapy at follow-up (Fig. 16). It has been published that quantitative parameters by CEUS, for example the slope of the first ascending tract or the curve or the area under the enhancement curve, decrease significantly after effective pharmacological treatment [30]. Potential differences in the results obtained with different software are not important in monitoring the treatment, because patients can be evaluated by the same radiologist with the same machine.
Fig. 16.
A 24-year-old woman with CD. a CEUS before treatment with the anti-TNF drug shows marked enhancement in the involved loop (the absolute and percentage of enhancement increases were 96 and 168, respectively). b CEUS examination depicts a reduction of the enhancement (percentage increase of 59%) in the same loop following the induction treatment with anti-TNF
However, despite the initial clinical improvement after treatment, many patients relapse on discontinuing treatment once maintained remission of the disease has been achieved. Residual hyperaemia in the affected bowel wall by colour Doppler may detect patients with incomplete histopathological remission, reflecting subclinical inflammation, with a predisposition to relapse [28].
Patients with quiescent CD after medical treatment with a thickened enhancing wall after contrast agent injection also present a higher risk of relapse, with a higher number of hospitalisations and surgeries (Fig. 17) [31]. This fact could have treatment implications; patients in clinical remission with persistent enhancement should be monitored closely or undergo prolonged treatment, whereas in the absence of or scarce enhancement, therapy could be stopped.
Fig. 17.
Crohn’s disease in a 20-year-old woman in clinical remission after effective medical treatment. Scheduled sonographic exam: a transverse sonographic scan of the caecum shows thickening of the wall with preserved stratification. b Measurement of bowel wall vascularity after second generation contrast agent injection in a manually defined ROI localised in the ileal wall. The percentage of enhancement increase in wall brightness was 100%. The patient did not change the treatment and 6 months later required hospitalisation due to an enterocutaneous fistula (see Fig. 12). There is a correlation between residual enhancement after treatment and an unfavourable outcome
Moreover, after the introduction of new therapies, especially biological therapy, endoscopic mucosal healing has been proposed to be the treatment goal, because mucosal healing is associated with a decrease in rates of hospitalisation and surgery. Endoscopic examination is invasive and unpleasant, with poor patient compliance, so it cannot be performed repeatedly. Furthermore, it cannot be used to assess proximal segments of the small bowel.
Future prospective studies comparing CEUS with colonoscopy are required to determine if sonographic enhancement changes correlate with endoscopic changes.
Postoperative follow-up and detection of disease recurrence
Two studies have demonstrated that US can identify the recurrence of CD with a sensitivity of 81–82% when compared with endoscopy [32, 33]. In both of these studies a bowel wall thickness greater than 5 mm was considered pathological. The detection of an increased enhancement by CEUS in intestinal segments with mild mural thickening (<5 mm) may improve the diagnosis of disease recurrence (Fig. 18) [34].
Fig. 18.
A 43-year-old woman with previous ileocolic resection for CD, with recurrence at the anastomotic site. a Longitudinal US scan shows mild thickening (3.2 mm) of a short segment of the anastomosis (arrows). b CEUS after specific contrast agent injection depicts intense enhancement (100%) of the anastomosis allowing the diagnosis of recurrent disease. Ileocolonoscopy showed a Rutgeerts score of 3
Conclusions
US today has clearly defined roles in the diagnosis and follow-up of CD, thus improving therapy planning and monitoring the efficacy of treatment. CEUS is an emerging technique that must be considered part of the entire sonographic evaluation. It has good diagnostic accuracy, with results comparable with those of other imaging techniques, such as CT or MR. CEUS of the intestinal tract does not require any specific preparation, so it is well-tolerated and accepted by patients and therefore can be performed repeatedly, a fact that represents the main advantage of this technique over other cross-sectional imaging procedures. CEUS is especially useful to evaluate the inflammatory activity of CD and to monitor the efficiency of treatments.
Electronic supplementary material
(AVI 2538 kb)
(AVI 3306 kb)
Contributor Information
Tomás Ripollés, Phone: +34-667523904, Email: ripolles_tom@gva.es.
María J. Martínez-Pérez, Phone: +34-670772404, Email: martinez_marper@gva.es
Esther Blanc, Phone: +34-616726374, Email: esblanc@seram.org.
Fructuoso Delgado, Phone: +34-650657064, Email: frudelgado@gmail.com.
José Vizuete, Phone: +34-650596498, Email: vizujose@gmail.com.
José M. Paredes, Phone: +34-676124514, Email: paredes_jos@gva.es
José Vilar, Phone: +34-635465642, Email: vilarjlu@gmail.com.
References
- 1.Furukawa A, Saotome T, Yamasaki M, et al. Cross-sectional imaging in Crohn disease. RadioGraphics. 2004;24:689–702. doi: 10.1148/rg.243035120. [DOI] [PubMed] [Google Scholar]
- 2.Horsthuis K, Bipat S, Bennink RJ, Stoker J. Inflammatory bowel disease diagnosed with US, MR, Scintigraphy and CT: meta-analysis of prospective studies. Radiology. 2008;247:64–79. doi: 10.1148/radiol.2471070611. [DOI] [PubMed] [Google Scholar]
- 3.Panés J, Bouzas R, Chaparro M, et al. Systematic review: the use of ultrasonography, computed tomography and magnetic resonance imaging for the diagnosis, assessment of activity and abdominal complications of Crohn’s disease. Aliment Pharmacol Ther. 2011;34:125–145. doi: 10.1111/j.1365-2036.2011.04710.x. [DOI] [PubMed] [Google Scholar]
- 4.Maconi G, Sampietro GM, Parente F, et al. Contrast radiology, computed tomography and ultrasonography in detecting internal fistulas and intra-abdominal abscesses in Crohn’s disease: a prospective comparative study. Am J Gastroenterol. 2003;98:1545–55. doi: 10.1111/j.1572-0241.2003.07521.x. [DOI] [PubMed] [Google Scholar]
- 5.Parente F, Greco S, Molteni M, Anderloni A, Maconi G, Porro GB. Modern imaging of Crohn’s disease using bowel ultrasound. Inflamm Bowel Dis. 2004;10:452–461. doi: 10.1097/00054725-200407000-00022. [DOI] [PubMed] [Google Scholar]
- 6.Fraquelli M, Colli A, Casazza G, et al. Role of US in detection of Crohn disease: meta-analysis. Radiology. 2005;235:95–101. doi: 10.1148/radiol.2361040799. [DOI] [PubMed] [Google Scholar]
- 7.Herrmann KA, Michaely HJ, Zech CJ, et al. Internal fistulas in Crohn’s disease: magnetic resonance enteroclysis. Abdominal Imaging. 2006;31:675–687. doi: 10.1007/s00261-005-0400-y. [DOI] [PubMed] [Google Scholar]
- 8.Thornton M, Solomon MJ. Crohn’s disease: in defense of a microvascular aetiology. Int J Colorectal Dis. 2002;17:287–297. doi: 10.1007/s00384-002-0408-5. [DOI] [PubMed] [Google Scholar]
- 9.Bodily KD, Fletcher JG, Solem CA, et al. Crohn disease: mural attenuation and thickness at contrast-enhanced CT enterography. Correlation with endoscopic and histologic findings of inflammation. Radiology. 2006;238:505–516. doi: 10.1148/radiol.2382041159. [DOI] [PubMed] [Google Scholar]
- 10.Sempere JGA, Martínez-Sanjuán V, Medina E, et al. MRI evaluation of inflammatory activity in Crohn’s disease. Am J Roentgenol. 2005;184:1829–1835. doi: 10.2214/ajr.184.6.01841829. [DOI] [PubMed] [Google Scholar]
- 11.Pauls S, Gabelmann A, Schmidt SA, et al. Evaluating bowel wall vascularity in Crohn’s disease: a comparison of dynamic MRI and wideband harmonic imaging contrast-enhanced low MI ultrasound. Eur Radiol. 2006;16:2410–2417. doi: 10.1007/s00330-006-0330-2. [DOI] [PubMed] [Google Scholar]
- 12.Maccioni F, Viscido A, Broglia L, et al. Evaluation of Crohn disease activity with magnetic resonance imaging. Abdom Imaging. 2000;25:219–2284. doi: 10.1007/s002610000004. [DOI] [PubMed] [Google Scholar]
- 13.Sostegni R, Daperno M, Scaglione N, Lavagna A, Rocca R, Pera A. Crohn’s disease: monitoring disease activity. Aliment Pharmacol Ther. 2003;17(Suppl 2):11–17. doi: 10.1046/j.1365-2036.17.s2.17.x. [DOI] [PubMed] [Google Scholar]
- 14.Spalinguer J, Patriquin H, Miron MC, et al. Doppler US in patients with Crohn disease: vessel density in the diseased bowel reflects disease activity. Radiology. 2000;217:787–91. doi: 10.1148/radiology.217.3.r00dc19787. [DOI] [PubMed] [Google Scholar]
- 15.Haber HP, Busch A, Ziebach R, Dette S, Ruck P, Stern M. Ultrasonographic findings correspond to clinical, endoscopic, and histologic findings in inflammatory bowel disease and other enterocolitides. J Ultrasound Med. 2002;21:375–382. doi: 10.7863/jum.2002.21.4.375. [DOI] [PubMed] [Google Scholar]
- 16.Neye H, Voderholzer W, Rickes S, Weber J, Wermke W, Lochs H. Evaluation of criteria for the activity of Crohn’s disease by power Doppler sonography. Dig Dis. 2004;22:67–72. doi: 10.1159/000078737. [DOI] [PubMed] [Google Scholar]
- 17.Serra C, Menozzi G, Morselli AM, et al. Ultrasound assessment of vascularisation of the thickened terminal ileum wall in Crohn’s disease patients using a low-mechanical index real-time scanning technique with a second generation ultrasound contrast agent. Eur J Radiol. 2007;62:114–121. doi: 10.1016/j.ejrad.2006.11.027. [DOI] [PubMed] [Google Scholar]
- 18.Migaleddu V, Scanu AM, Quaia E, et al. Contrast-enhanced ultrasonographic evaluation of inflammatory activity in Crohn,s disease. Gastroenterology. 2009;137:43–61. doi: 10.1053/j.gastro.2009.03.062. [DOI] [PubMed] [Google Scholar]
- 19.Ripollés T, Martínez-Perez MJ, Paredes JM, Blanc E, Flors L, Delgado F. Crohn’s disease: correlation of findings at contrast-enhanced US with endoscopic severity at endoscopy. Radiology. 2009;253:241–248. doi: 10.1148/radiol.2531082269. [DOI] [PubMed] [Google Scholar]
- 20.Low LN, Sebrechts AR, Politoske DA, et al. Crohn disease with endoscopic correlation: single-shot fast spin-echo and gadolinium-enhanced fat-suppressed spoiled gradient-echo MR imaging. Radiology. 2002;222:652–660. doi: 10.1148/radiol.2223010811. [DOI] [PubMed] [Google Scholar]
- 21.Kratzer W, Schmidt SA, Mittrach Ch, et al. Contrast-enhanced wideband harmonic imaging ultrasound (SonoVue): a new technique for quantifying bowel wall vascularity in Crohn’s disease. Scand J Gastroenterol. 2005;40:985–991. doi: 10.1080/00365520510015818. [DOI] [PubMed] [Google Scholar]
- 22.Maconi G, Radice E, Greco S, Porro GB. Bowel Ultrasound in Crohn’s disease. Best Pract Res Clin Gastroenterol. 2006;20(1):93–112. doi: 10.1016/j.bpg.2005.09.001. [DOI] [PubMed] [Google Scholar]
- 23.Kratzer W, Tirpitz CH, Mason R, et al. Contrast-enhanced power Doppler sonography of the intestinal wall in the differentiation of hypervascularized and hypovascularized intestinal obstructions in patients with Crohn’s disease. J Ultrasound Med. 2002;21:149–57. doi: 10.7863/jum.2002.21.2.149. [DOI] [PubMed] [Google Scholar]
- 24.Pellicer B, Romá E, Ripollés T, Martínez MJ, Paredes JM, Rausell N. (2010) Effectiveness of contrast-enhanced US for characterization of intestinal strictures in Crohn disease [abstract]. In: Radiological Society of North America scientific assembly and annual meeting program. RSNA p 492
- 25.Migaleddu V, Quaia E, Scano D, Virgilio G. Inflammatory activity in Crohn disease: ultrasound findings. Abdom Imaging. 2008;33:589–597. doi: 10.1007/s00261-007-9340-z. [DOI] [PubMed] [Google Scholar]
- 26.Zappa M, Stefanescu C, Cazals-Hatem D et al (2010) Which magnetic resonance imaging findings accurately evaluate inflammation in small bowel Crohn’s disease? A retrospective comparison with surgical pathologic analysis. Inflamm Bowel Dis; Aug 18 [Epub ahead of print] doi:10.1002/ibd.21414 [DOI] [PubMed]
- 27.Ruess L, Nussbaum AR, Bulas D, et al. Inflammatory bowel disease in children and young adults: correlation of sonographic and clinical parameters during treatment. AJR. 2000;175:79–84. doi: 10.2214/ajr.175.1.1750079. [DOI] [PubMed] [Google Scholar]
- 28.Ripollés T, Martinez MJ, Barrachina M. Crohn’s disease and color Doppler sonography: response to treatment and its relationship with long-term prognosis. J Clin Ultrasound. 2008;36:267–272. doi: 10.1002/jcu.20423. [DOI] [PubMed] [Google Scholar]
- 29.Paredes JM, Ripollés T, Cortés X, et al. Abdominal sonographic changes after antibody to tumour necrosis factor (anti-TNF) alpha therapy in Crohn’s disease. Dig Dis Sci. 2010;55(2):404–410. doi: 10.1007/s10620-009-0759-7. [DOI] [PubMed] [Google Scholar]
- 30.Quaia E, Migaleddu V, Baratella E, et al. The diagnostic value of small bowel wall vascularity after sulfur hexafluoride-filled microbuble injection in patients with Crohn’s disease. Correlation with the therapeutic effectiveness of specific anti-inflammatory treatment. Eur J Radiol. 2009;69(3):438–445. doi: 10.1016/j.ejrad.2008.10.029. [DOI] [PubMed] [Google Scholar]
- 31.Robotti D, Cammarota T, Debani P, Sarno A, Astegiano M. Activity of Crohn disease: value of color-power-Doppler and contrast-enhanced ultrasonography. Abdom Imaging. 2004;29:648–52. doi: 10.1007/s00261-003-0157-0. [DOI] [PubMed] [Google Scholar]
- 32.Rispo A, Bucci L, Pesce G, et al. Bowel sonography for the diagnosis and grading of postsurgical recurrence of Crohn,s disease. Inflamm Bowel Dis. 2006;12:486–490. doi: 10.1097/00054725-200606000-00007. [DOI] [PubMed] [Google Scholar]
- 33.Paredes JM, Ripollés T, Cortés X, et al. Non-invasive diagnosis of postsurgical endoscopic recurrence in Crohn’s disease. Usefulness of abdominal ultrasonography and 99mTc-hexamethylpropylene amineoxime labelled leucocyte scintigraphy. J Crohns Colitis. 2010;4(5):537–545. doi: 10.1016/j.crohns.2010.03.002. [DOI] [PubMed] [Google Scholar]
- 34.Boronat A, Ripollés T, Martínez MJ, Paredes JM, Barber C, Blanc E (2009) Contrast-enhanced sonography in the diagnosis postsurgical recurrence of Crohn’s disease: comparison with endoscopy. In: European Congress of Gastrointestinal Society (ESGAR) Valencia, 23–26 June
Associated Data
This section collects any data citations, data availability statements, or supplementary materials included in this article.
Supplementary Materials
(AVI 2538 kb)
(AVI 3306 kb)


