Fig. 1.
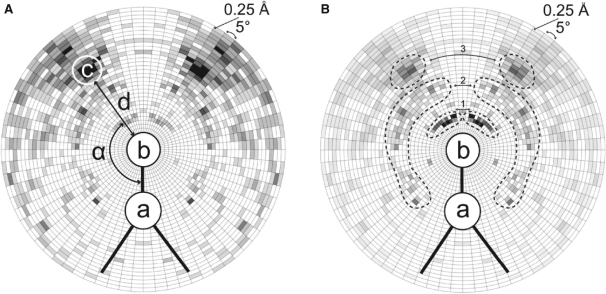
Schematic views of the radial grid R used for deriving contact statistics for RNA atom pairs [a, b] in contact with cation c. The grid used for counting uses radial steps of 0.25Å and 5○ around atom b (an O or N atom) and a (covalently bound to b). (A) Statistics of cation presence. For each cation, its distance d to the respective atom b, and the angle α (a, b, c) are calculated. The contact statistics derived for the RNA atom pair [P, OP2] and Mg2+ ions are shown in a gray scale (the more Mg2+ in a given bin, the darker the area). (B) The diagram shows the distribution of values for a normalized potential derived from contact statistics (A) for the RNA atom pair [P, OP2] and Mg2+ ions (the darker the area, the more negative value of the potential for the given bin). The three possible states of magnesium binding to RNA (Draper, 2004) are represented by the three peak tuples of the darkest areas. The first peak tuple (i) corresponds to Mg2+ chelated and partially dehydrated by phosphate groups of RNA. The second peak tuple (ii) corresponds to the water-mediated state. The third peak tuple (iii) represents the situation where the Mg2+ ion remains hydrated and interacts with the RNA via a layer of water molecules.

